Archives

Prediabetes

ABSTRACT


The global epidemic of type 2 diabetes remains one of the greatest health challenges of our time. The collective human and economic costs are staggering and rising. Widespread initiatives now exist to prevent diabetes wherever possible. These initiatives are singularly focused on preventing diabetes in the very highest risk group: people with prediabetes. Plasma glucose concentrations can exist over a continuum with normoglycemia on one side and diabetes mellitus on the other. Nevertheless, the concept of “prediabetes” – a state of neither normoglycemia or bonafide diabetes – has been in the clinical purview since the first formal diagnostic criteria of diabetes itself. Most can agree that prediabetes represents a high-risk state for diabetes (and for the sake of this review, high-risk for type 2 diabetes, specifically), but consensus is lacking for much else, including the diagnostic thresholds, if, when, or what to initiate as to pharmacotherapy for diabetes prevention, and whether prediabetes is actually just an earlier form of diabetes warranting similarly aggressive risk factor modification for diabetes-related complications. In this chapter, PREDIABETES, we will review the recommendations for screening, diagnosis, and intervention, largely according to the American Diabetes Association (ADA).  We will also look at the pathogenesis of this highly heterogeneous dysglycemic state as well as an increasing body of evidence that treatment of prediabetes back to normoglycemia should be the goal for people with prediabetes. Lastly, the scientific evidence reviewed will be distilled into an example of a conversation intended to engage patients in this process.


INTRODUCTION


In 1979-1980, the National Diabetes Data Group and World Health Organization introduced the first formal diagnostic criteria for diabetes (1,2). Cross sectional observations that the presence of both microvascular disease (MVD) (3-6)and cardiovascular disease (CVD) (7,8) were higher when fasting plasma glucose (FPG) was >140 mg/dl and/or 2-hour post-challenge glucose (2h-PG) was >200 mg/dl were confirmed in longitudinal population studies, providing rationale for these cut points (9-11). Nevertheless, clear evidence that lowering plasma glucose could prevent diabetic complications was not available until the 1993 publication of the Diabetes Complications and Control Trial (DCCT) (12). The DCCT noted an inflection point between A1c 6.5-7.0% (48-53 mmol/mol) and risk for retinopathy, as well as a 76% reduction in retinopathy, in participants with type 1 diabetes randomized to intensive treatment (12). Hence, the A1c goal of <6.5-7.0% soon became – and has remained – the major benchmark of care for people with diabetes (type 1 and 2) (13).  


Diagnostic criteria for diabetes have evolved over the years, lowering plasma glucose thresholds (14) and even advocating use of the A1c for diagnosis (15), while continuing to calibrate these thresholds against risk for retinopathy. Far less well known than the landmark publication of the DCCT is the re-analysis of the original data demonstrating a flaw in the models with no inflection point in A1c and risk for retinopathy noted (16). Instead, reduction in retinopathy was appreciated across the A1c range, including what is now considered the pre-diabetic A1c range. The first formal diagnostic criteria for “pre”-diabetes (i.e. impaired glucose tolerance) were introduced concurrently with those for diabetes itself (1). Diagnostic thresholds for prediabetes have been more moveable (14,15,17) and more controversial. Despite evidence demonstrating higher MVD and CVD in people with prediabetes compared to their normoglycemic peers (18-21), treatment of people with prediabetes is uncommon (22,23) as the notion of a “pre” disease presents a clinical and regulatory conundrum. 


SCREENING


Much ado has been made about the cost-effectiveness of screening for prediabetes.  Nevertheless, because roughly one-quarter of people with diabetes in the U.S. remain undiagnosed (24), numerous guidelines do advocate screening for dysglycemia (e.g. diabetes and prediabetes). According to the American Diabetes Association (ADA) together with the European Association for the Study of Diabetes (EASD), an informal assessment of risk factors or use of a risk assessment tool (e.g. www.diabetes.org/socrisktest) can guide who should undergo blood testing (25). Children >10 years old or who have gone through puberty (whichever occurs first) who are >85th% weight for height, with one or more risk factors (Table 1), should be screened. Non-pregnant adults >35 years without risk factors, or adults of any age who are overweight (BMI>25 kg/m2 or BMI >23 kg/m2, if Asian ethnicity) and have one or more risk factors (Table 1), should be screened. The screening test should be A1c, fasting glucose, or 2-hour glucose, and repeated at least at 3-year intervals for those whose screening reveals normoglycemia and once yearly in those diagnosed with prediabetes (26).


Table 1.  Risk Factors for Prediabetes and Diabetes

First-degree relative with type 2 diabetes

Non-Caucasian ethnicity

History of cardiovascular disease

Hypertension (blood pressure >140/90 or use of anti-hypertensive medication)

HDL cholesterol <35 mg/dl and/or triglyceride concentration >250 mg/dl

Women with polycystic ovary syndrome

Physical inactivity (<90 min/wk aerobic activity)

Presence of severe obesity, acanthosis nigricans and/or skin tags


DIAGNOSIS


According to the ADA and EASD, the diagnosis of prediabetes is made when the fasting plasma glucose (FPG) is 100-125 mg/dl (5.6-6.9 mmol/l; “impaired fasting glucose” (IFG)), plasma glucose concentration is 140-199 mg/dl (7.8-11.1 mmol/l; “impaired glucose tolerance” (IGT)) 2 hours after a 75 g oral glucose tolerance test (OGTT), and/or A1c 5.7-6.4% (26) (Table 2).  Unlike diagnostic criteria for diabetes that are based on their predictive value for retinopathy (14), diagnostic thresholds for prediabetes are based on the likelihood of developing overt diabetes (27-30).  However, discussion regarding the existing cut points is ongoing. Longitudinal data from a cohort of Israeli soldiers suggest that a fasting glucose above 87 mg/dl (4.8 mmol/l) is associated with an increased risk of future diabetes (31). Further, misclassification is common given the day-to-day variability in the fasting (15%) and 2-hour (46%) glucose concentrations (32). A1c can be confounded by a number of comorbid conditions like renal disease, anemia, and hemoglobinopathies (see www.ngsp.org/interf.asp)  and must be done using a method certified by the National Glycohemoglobin Standardization Program (NGSP).  Use of the 1-hour glucose value (i.e., >155 mg/dl post-OGTT), fructosamine, 5-androhydroglucitol among others have also been proposed, but none are standardized hence none currently recommended (33,34). Despite the fact that A1c-defined prediabetes appears to confer worse outcomes than prediabetes defined by fasting or 2-hour glucose criteria (35), the use of the A1c is not supported by the World Health Organization (WHO) for the diagnosis of prediabetes (36).


Table 2.  Current Diagnostic Criteria for Prediabetes (ADA & EASD)

Fasting plasma glucose 100-125 mg/dl

and/or

Glucose 140-199 mg/dl 2-hours post 75 g OGTT

and/or

A1c 5.7-6.4%


PREVALENCE


The changes in diagnostic criteria over the past years make it difficult to estimate exact trends in the global burden of prediabetes. However, by combining recent data from diverse sources, the prevalence of prediabetes can roughly be approximated. In 2021, the Centers for Disease Control (CDC) estimated that 96 million Americans – 38% of the adult population – had prediabetes demonstrating an increase in the percent of the population that has prediabetes that had previously been stable (24). Discordance in the diagnostic criteria for prediabetes, regional differences in surveillance and reporting for chronic diseases, and other cultural nuances pose challenges in estimating the global burden of prediabetes. To this point, the literature is currently devoid of any estimate of global prevalence of IFG, specifically. In 2017, the International Diabetes Federation (IDF) estimated the worldwide prevalence of IGT at 318 million - a number expected to increase to 482 million by 2040 (www.diabetesatlas.org) – with no further update in 2021. Data from the National Health and Nutrition Examination Survey (NHANES) would contend that the prevalence of IFG is twice that of IGT (37) (using ADA criteria), suggesting that the worldwide prevalence of prediabetes (IFG and/or IGT) may exceed 1 billion. Most alarming is that roughly one- third of people with IGT (and possibly IFG) are between 20 and 39 years old, thus are expected to spend many years at risk for or with diabetes (www.diabetesatlas.org).


RISK FOR DIABETES


Screening for and diagnosis of prediabetes is advocated as it represents a high-risk state for the development of overt type 2 diabetes. A recent meta-analysis showed that the yearly progression rate to diabetes in individuals with prediabetes is 3.5-7.0% (vs. 2%/year in their normoglycemic counterparts) (28), with highest rates in those with combined IFG and IGT and the lowest in those with IFG by ADA (vs. WHO) definition (38). Increasing A1c is also associated with increased risk of diabetes with yearly incidence rates approximating 5% for those with an A1c of 5.7-6.0% and up to 10% for those with an A1c of 6.1-6.4% (39).  Adding non-glycemic risk factors (Table 1) to the diagnosis of prediabetes markedly increases risk for diabetes, approaching 30% per year (40).  Decompensation from prediabetes to diabetes appears rapid in the later stages (41) and may warrant closer monitoring for people close to the thresholds for diabetes as well as earlier risk factor modification.


A recent study looked at the prevalence of prediabetes and risk of developing diabetes in 3412 individuals between 71 and 90 years of age (42). The prevalence of diabetes in this population was very high with 44% meeting the criteria based on A1C, 59% based on fasting glucose, 73% based on either A1c or fasting glucose, and 29% based on both A1c and fasting glucose. After a median 5-year follow-up only 9% of individuals with prediabetes based on A1c developed diabetes and only 8% of individuals with prediabetes based on fasting glucose developed diabetes. In individuals with prediabetes based on both A1c and fasting glucose levels 12% developed diabetes during the 5-year follow-up period. Many of the individuals with prediabetes regressed to normal glycemia. Thus, in the elderly the risk of progressing from prediabetes to diabetes appears to be lower than in middle aged individuals.  


SUBTYPES & PATHOGENESIS


Not long ago, the universal teaching was that post-prandial hyperglycemia always preceded fasting hyperglycemia in the evolution of diabetes (Figure 1).  The past decade has ushered in compelling evidence that this is not always the case. IFG can be isolated or precede IGT, IGT can be isolated or precede IFG, or they can be concurrent in the prediabetic state (27,29,43) (Figure 1).  This realization has sparked rigorous investigations into the pathogenesis of the subtypes - IFG, IGT and IFG/IGT - as discreet prediabetic states. Early studies used the homeostasis model assessment (HOMA) to delineate IFG from IGT, concluding that IFG was more insulin resistant than IGT (43).  Most noteworthy is the fact that this conclusion is inherently flawed since HOMA relies on FPG (i.e., HOMA-IR = FPG x FPI / 22.5) and IFG is defined by FPG.  Fortunately, more rigorous investigations have followed.

Figure 1. A) Former concept as to the pathophysiology of prediabetes and diabetes >10 years ago; B) Current knowledge as to the pathophysiology of prediabetes and diabetes <10 years

In some individuals, type 2 diabetes seems to develop as a consequence of inherent beta cell dysfunction (44). In others, development of insulin resistance precedes defects in the pancreatic beta cells (44,45). These findings underscore that prediabetes (like type 2 diabetes) is not a single disease entity, but rather multiple diseases with different pathologies (Table 3) and trajectories for disease development. This notion is supported by longitudinal data from the Whitehall II Study illustrating that the underlying disease mechanisms for individuals developing type 2 diabetes differ depending on whether diabetes is diagnosed by increased fasting or 2-hour plasma glucose levels (44). Further, this heterogeneity in the disease process is present decades before the clinical onset of diabetes.  Defects unique to IFG and IGT may be collective or unique when IFG and IGT exist in combination (46).


Table 3. Overview of the Distinguishing Features of IFG vs. IGT


IFG

IGT


Demographics

Men > women

Women > men


Younger

Older


Lipids

High plasma triglycerides

---


Low HDL cholesterol

---


Site of insulin resistance

Liver

Skeletal muscle


Type of beta cell defect

1st phase insulin secretion

2nd phase insulin secretion


Impaired Fasting Glucose (IFG)


THE ROLE OF THE LIVER


In healthy humans, circulating plasma glucose concentration is maintained in a narrow range by the liver’s ability to regulate its direction of glucose flux (47).  By virtue of hepatic insulin resistance (48), decreased hepatic glucose clearance (49), or lower glucose effectiveness (50), endogenous glucose production (EGP) becomes abnormal in the development of isolated IFG (48,51-54).  EGP, as measured by glucose rate of appearance (Ra), has been reported as 8-25% higher in people with IFG vs. normal glucose tolerant (NGT) controls in some studies (46,54), or “inappropriately” comparable to NGT (given the higher circulating glucose and insulin levels in IFG) in others (48,55). It is clear that the liver, rather than muscle, plays a distinctive role in the pathogenesis of IFG.


THE ROLE OF THE BETA CELL


Unique defects in beta cell function are seen in concert with the defects in the liver in people with isolated IFG. Collective data suggest that beta cell function may be intrinsically impaired, vs. acquired, in IFG. This notion is supported by epidemiologic studies showing diminished insulin response to glucose in normoglycemic individuals who later develop isolated IFG (56) and that this defect may be seen as long as 18 years before they are diagnosed with diabetes (44).  Furthermore, beta cell dysfunction has been demonstrated in individuals with isolated IFG and normal peripheral insulin sensitivity (48,51). 


The exact manner of beta cell dysfunction in IFG appears specific to 1st vs. 2nd phase insulin secretion (55,57).  It should be pointed out, however, that 1st phase insulin secretion is only appreciated in response to an intravenous glucose challenge bringing its physiologic relevance into question. Studies carefully examining insulin secretion in IFG (vs. NGT or IGT) have uniformly noted decrements in response to intravenous, but not oral, glucose challenges (46,48,51,54,55). Collectively, these data imply a dependence on the incretin hormones to maintain normal insulin secretion in IFG that may diverge from the role of the incretin hormones to facilitate insulin secretion in IGT.


OTHER DISTINGUISHING AND NON-DISTINGUISHING FEATURES OF IFG


Despite the implication of different roles for the incretin hormones in conferring IFG vs. IGT, existing data are conflicting (51,58). Likewise, plasma glucagon concentrations (51), adipose tissue mass and function (59) do not appear different, and other pathogenic features such as intramuscular lipids have not been compared between the subtypes of prediabetes. Of note, people with IFG tend to be male and younger – whereas those with IGT female and older - and have slight differences in their risk factors for CVD (43,60,61).


Impaired Glucose Tolerance (IGT)


THE ROLE OF SKELETAL MUSCLE


Despite reports of greater hepatic fat in people with IGT vs. IFG (62), skeletal muscle, rather than liver, has been implicated as the site of insulin resistance in isolated IGT. Glucose rate of disappearance (Rd; a measure of muscle insulin sensitivity) has been shown to be 42-48% lower in IGT vs. NGT (48,55) with only minimal impairments seen in IFG (54).  Because of the larger contribution of muscle (vs. liver) to whole-body insulin sensitivity, people with isolated IGT demonstrate on average 15-30% lower whole body insulin sensitivity compared to those with isolated IFG(51,52,57).


THE ROLE OF THE BETA CELL


In contrast to IFG, beta cell dysfunction appears to be acquired rather than intrinsic in IGT. For example, long-term population studies have not noted early defects in people destined to develop isolated IGT (56).  Nevertheless, beta cell dysfunction has been repeatedly observed in people with established IGT, particularly when significant whole body and skeletal muscle insulin resistance co-exists (51,56,63,64).  The exact manner of beta cell dysfunction in IGT appears specific to 2nd vs. 1st phase insulin secretion (55,57) and is observed whether or not the incretin-axis is invoked during the assessment. 


A1c-Defined Prediabetes


Recent trends in medical practice have seen the 2-hour OGTT fall from grace and be replaced by the A1c, even for the diagnosis and surveillance of prediabetes. Being that A1c is a composite of fasting and post-prandial glucose concentrations, it cannot delineate IFG from IGT nor any of the pathology unique to either. Alpha-hydroxybuytric acid, linoleoyl-glycerophosphocholine, and oleic acid have been shown predictive of 2-hour glucose values in three European cohort studies (65), hence may hold value if the pathophysiologic differences between IFG and IGT are to guide clinical decision-making in the future.  Currently, the strategies for diabetes prevention do not discriminate between the subtypes of prediabetes.


CLINICAL TRIALS AIMED AT PREVENTING OR DELAYING DIABETES


With the global surge in the prevalence of type 2 diabetes, focus on its prevention has intensified. Clinical trials for diabetes prevention around the globe have universally enrolled participants with untreated prediabetes (mostly IGT) due to their high risk for acquiring overt diabetes (28). Approaches for the prevention of diabetes have included intensive lifestyle modification (66-68) (Figure 2) or drug therapy using glucose-lowering medications (69-76)  (Figure 3) or anti-obesity medications (77-81) (Figure 4). Lifestyle interventions have utilized a low fat (<30% calories from fat; <10% from saturated fat) hypocaloric diet and moderate intensity exercise ~150 minutes per week for the purpose of 5-7% weight reduction. With the exception of the NAVIGATOR Trial (75), collective results demonstrate that diabetes incidence can be reduced by 20-89% over 2.4-6 years in a wide range of ethnic groups. 

Figure 2. Major trials using intensive lifestyle interventions for diabetes prevention

Figure 3. Major trials using glucose-lowering medications for diabetes prevention

Figure 4. Major trials using anti-obesity medications for diabetes prevention

Despite success amongst the various strategies employed, only intensive lifestyle modification has been universally advocated. The lifestyle curriculum designed for the U.S. Diabetes Prevention Program (DPP) serves as the foundation for the National DPP (NDPP) – the translational effort of bringing clinical trial results to the real world (www.cdc.gov/diabetes/prevention). A recent meta-analysis of 63 publications stemming from international real-world translations of clinical trial lifestyle curriculum demonstrated a 3% reduction in absolute risk and 29% reduction in relative risk for active participants, even when weight loss was modest (82). Likewise, the National Health Service Diabetes Prevention Programme (NHS DPP) began implementation across the United Kingdom in 2016 (83).  Evaluation of the program showed a consistent ~40% reduction in onset of diabetes over 13.4 months, including when the curriculum was delivered by lay volunteers (84). Initiation of metformin in people with pre-diabetes is recommended for those younger than 65 years old with a body mass index (BMI) >25 kg/m2 (85). To date, only ~0.7% of people with prediabetes in the U.S. are treated with metformin (23). It should be noted that no medication is approved by the U.S. Food and Drug Administration (FDA) for the treatment of prediabetes – not even metformin – as the FDA does not recognize prediabetes as a disease. In fact, the mere notion of a “pre” disease creates a clinical and regulatory conundrum. In 2008, the FDA issued guidance for industry developing drugs for the treatment or prevention of diabetes stating that it would consider approving pharmacotherapy for prediabetes if the drug could show “clinical benefit” (e.g. a delay or lessening in micro- or macrovascular complications) (https://www.fda.gov/downloads/Drugs/GuidanceComplianceRegulatoryInformation/Guidances/ucm071624.pdf).  Increasing evidence shows this may be possible.


COMPLICATIONS OF PREDIABETES


It is alluring to imagine an A1c threshold below which patients are fully protected from diabetic complications (86). This quest has proven less straightforward than is widely acknowledged.  People with prediabetes can suffer the same micro-, macrovascular, and non-vascular complications as people with diabetes, just at a lower incidence rate. Further, data exist and studies ongoing to show clear benefit from early intervention for people with prediabetes (www.clinicaltrials.gov/prediabetes).


Microvascular


Diabetes remains a leading cause of blindness, kidney failure, and amputations around the world. Benchmarks for diabetes care are explicitly based on the prevention of such microvascular complications (13). Nonetheless, complications of diabetes increase with increasing glycemia, even in the prediabetic glucose range. For example, nearly 10% of DPP participants had diabetic retinopathy, without diabetes, in a cross sectional analysis (19).  Moreover, data from NHANES suggests the steepest increase in risk for retinopathy occurs at an A1c of 5.5% (18), which would be considered normoglycemia by current ADA and WHO criteria. Polyneuropathy has also been reported as more prevalent in prediabetes, affecting 13% of people with IGT and 11.3% with IFG compared to 7.4% with NGT (21). Lastly, microalbuminuria doubles in prevalence with the onset of IFG or IGT, whereas its progression appears slower at the diagnostic threshold for overt diabetes (87). Recent trends reveal chronic kidney disease (defined as a glomerular filtration rate (GFR) < 60 ml/min/1.73 m2) is now as prevalent in people with prediabetes as diabetes itself (88). 


Perhaps more surprising than the incidence and prevalence of microvascular disease in people with prediabetes are data showing benefit from early interventions.  For example, the DPP Outcomes Study (DPPOS) demonstrated a 21% lower prevalence of the composite microvascular endpoint (retinopathy, nephropathy and/or neuropathy) in women who had been randomized to the intensive lifestyle intervention and followed 15 years post-randomization and a 28% lower prevalence across the treatment groups when diabetes was prevented (89).  In the roughly 600 participants with prediabetes that entered the Swedish Obesity Study (SOS), the composite microvascular endpoint was 82% lower in those who underwent bariatric surgery a median of 19 years after their procedure – an effect size that was much greater than for those who entered the study with either diabetes or normoglycemia (90).  Lastly, retinopathy was shown reduced by 40% in the 30-year follow-up of the Da Qing Study – a study that rendered a meager average of 1.8 kg weight loss during the intervention period (91).  Altogether, there is increasing evidence that people with prediabetes are at risk for classic complications of diabetes and these can be prevented with early intervention (Figure 5).

Figure 5. Trials demonstrating a reduction in microvascular disease in people with prediabetes

Macrovascular


In 2010, a meta-analysis by Ford et al. illustrated an approximate 20% increased risk of cardiovascular disease (CVD) in people with prediabetes, irrespective of type (IFG or IGT), criteria used to define it, or the development of diabetes (20). As a continuous variable, however, CVD risk appears more closely related to 2-hour than fasting glucose (92).  In 2018, serial cross sectional data from NHANES showed surprising similarity in the prevalence of myocardial infarction and stroke in people with prediabetes vs. diabetes (88) likely due to the dramatic fall in incident myocardial infarction and stroke in people with diabetes (93).  This finding implies that CVD may now be as common in people with prediabetes as with diabetes (recently reviewed by (94)). It should be recognized that whether the elevated glucose is causing the increased risk of CVD in individuals with prediabetes is uncertain as prediabetes is associated with other factors such as obesity, insulin resistance, dyslipidemia, hypertension, hypercoagulation, and inflammation that could be playing important roles in increasing the risk of CVD.


As with microvascular disease, data do exist that early intervention also prevents macrovascular disease in people with prediabetes (Figure 6).  The first study to contend that this may be the case came from a post-hoc analysis of STOP-NIDDM – a trial that used acarbose to prevent or delay diabetes in people with prediabetes.  This analysis showed a highly unexpected 49% lower probability of any CV event in the group randomized to acarbose (95).  Interestingly, the trial was repeated, powered with benefit as the a priori hypothesis and did not succeed at recapitulating the prior findings (73). Differences in medication dosage and ethnic admixture may or may not explain the discrepancy. Nevertheless, pioglitazone has been shown to reduce CV events over 4.8 years in insulin-resistant people 6 months post-stroke with an average A1c of 5.8% (96).  Likewise, the Da Qing Study revealed a 33% lower CV mortality and 26% lower all-cause mortality, whilst still preventing diabetes, 30 years into the post-randomization follow-up (91).  CV data from the DPPOS is expected shortly with great anticipation that prediabetes may finally be recognized as an earlier form of diabetes warranting intervention. While the effect of lowering glucose levels in individuals with prediabetes is uncertain given the high risk of CVD in this population aggressive treatment of dyslipidemia and hypertension is indicated given the large number of studies showing benefits.

Figure 6. Trials demonstrating a reduction in macrovascular disease in people with prediabetes

Not Necessarily Vascular


Although risk factor modification largely focuses on preventing the classic complications of diabetes, greater attention is being paid to a much larger scope of possible comorbidities.  A recent study elaborated on structural brain abnormalities in people with prediabetes that are linked to dementia, stroke, and depression and hypothesized that glucose-lowering may reverse the abnormalities (97).  Functionally, these brain changes lead to slower processing speeds and cognitive deficits (98).  Mild cognitive impairments are accelerated by the presence of prediabetes leading to frank dementia (99). Unequivocally, cognitive impairments and dementia dramatically reduce quality of life for both patients and their care-takers.  Fortunately, patient-reported outcomes are becoming increasing revered as a scientific endpoint and may provide additional rationale for treating prediabetes. The much-anticipated long term outcomes from the DPPOS (expected 2020-2025) also include examining treatment effect on cognition, aspects of aging, quality of life, health care utilization and cancer.


RESTORATION OF NORMOGLYCEMIA


In clinical trials to date, interventions were deemed successful if diabetes was prevented or delayed, yet many participants remained with prediabetes. Arguably, prevention of diabetes and its complications lies in the restoration of normoglycemia rather than in the maintenance of prediabetes.  This was confirmed by a post-hoc analysis from the Diabetes Prevention Program Outcomes Study (DPPOS) (100). This analysis demonstrated a 56% lower risk of diabetes 10 years from randomization among those who were able to achieve normoglycemia during DPP vs. those who remained with prediabetes. Additionally, restoration of normoglycemia reduced prevalence of microvascular disease (101) and CV risk factors despite less use of medication to lower lipids and blood pressure (102).  The concept that diabetes and CV risk can be significantly reduced over the long-term through the pursuit of normoglycemia represents a major shift in our current thinking and has quickly gained consensus as the goal for people with prediabetes (103,104). Clinical predictors (105) and calculators as to the likelihood of regression (106)can be used to select and activate patients. Importantly, restoration of normoglycemia – as opposed to “diabetes prevention” – is clinically actionable. 


Exactly how normoglycemia should be achieved is far less clear. Data from the DPP would contend that only lifestyle modification, not metformin, is useful in achieving normoglycemia in people with prediabetes (105) (Figure 7). Of note, lifestyle modification has been shown particularly effective in women (107) and the elderly (108). The thiazolidinediones (TZD’s) have also demonstrated their ability to restore normoglycemia in people with prediabetes (71,72,109) and may gain greater acceptance in this population now that their CV safety has been established.  An increasing number of trials are focused on the ability of medication or lifestyle to not only prevent or delay onset of diabetes, but restore normoglycemia (79,110,111).


TRANSLATING INFORMATION INTO CONVERSATION


As we follow the recommended steps for screening and diagnosis of prediabetes outlined above, the next step in beginning the conversation with a patient with prediabetes is educating them about what the diagnosis means.  An A1c of 5.7-6.0% carries up to a 25%/5-year risk, whereas an A1c 6.0-6.4% carries up to a 50%/5-year risk, and prediabetes period carries up to a 70% lifetime risk of diabetes.  Further, people with prediabetes can suffer complications of diabetes even if they never convert. Early intervention can prevent diabetes by more than 50% if normoglycemia can be attained – even if transiently. Intensive lifestyle modification and a number of glucose-lowering and anti-obesity medications have been shown as capable to achieve this.  Metformin is recommended for younger, overweight people with prediabetes even though it may not achieve normoglycemia as readily. Micro- and macrovascular risk factor modification is critical.  Plasma glucose concentrations should be followed and re-screening for diabetes done annually.


CONCLUSION


In the light of the global burden of prediabetes affecting close to one billion people, the high progression rates to type 2 diabetes, and the increased risk of both micro- and macrovascular complications and death (112), efforts focused on preventing progression to diabetes and its complications are crucial. Although both intensive lifestyle intervention and various medications have proven to be effective for prevention or delay of diabetes in people with prediabetes, their uptake has been slow. This is true even in light of emerging data showing the vast benefits of early interventions.  Our best bet to recognize prediabetes as a disease is probably by calling it what it is: early diabetes (94) and treat it as such, eradicating the term “prediabetes” for good.


REFERENCES


  1. National Diabetes Data Group.Classification and diagnosis of diabetes mellitus and other categories of glucose intolerance. Diabetes. 1979;28(12):1039-1057.
  2. World Health Organization. Report of the Expert Committee on Diabetes. WHO Technical Report Seies. Vol 646. Geneva, Switzerland 1980.
  3. Fabre J, Balant LP, Dayer PG, Fox HM, Vernet AT. The kidney in maturity onset diabetes mellitus: a clinical study of 510 patients. Kidney Int. 1982;21(5):730-738.
  4. Haffner SM, Mitchell BD, Pugh JA, Stern MP, Kozlowski MK, Hazuda HP, Patterson JK, Klein R. Proteinuria in Mexican Americans and non-Hispanic whites with NIDDM. Diabetes Care. 1989;12(8):530-536.
  5. Hamman RF, Mayer EJ, Moo-Young GA, Hildebrandt W, Marshall JA, Baxter J. Prevalence and risk factors of diabetic retinopathy in non-Hispanic whites and Hispanics with NIDDM. San Luis Valley Diabetes Study. Diabetes. 1989;38(10):1231-1237.
  6. Klein R, Klein BE, Moss SE, Davis MD, DeMets DL. The Wisconsin epidemiologic study of diabetic retinopathy. III. Prevalence and risk of diabetic retinopathy when age at diagnosis is 30 or more years. Arch Ophthalmol. 1984;102(4):527-532.
  7. Siitonen O, Uusitupa M, Pyorala K, Lansimies E, Voutilainen E. Aortic calcifications and their relationship to coronary heart disease and cardiovascular risk factors in patients with newly diagnosed non-insulin-dependent diabetes and in nondiabetic subjects. Cardiology. 1987;74(5):335-343.
  8. Uusitupa M, Siitonen O, Pyorala K, Aro A, Hersio K, Penttila I, Voutilainen E. The relationship of cardiovascular risk factors to the prevalence of coronary heart disease in newly diagnosed type 2 (non-insulin-dependent) diabetes. Diabetologia. 1985;28(9):653-659.
  9. Keen H, Jarrett RJ, McCartney P. The ten-year follow-up of the Bedford survey (1962-1972): glucose tolerance and diabetes. Diabetologia. 1982;22(2):73-78.
  10. O'Sullivan JB, Mahan CM. Prospective study of 352 young patients with chemical diabetes. N Engl J Med. 1968;278(19):1038-1041.
  11. Sayegh HA, Jarrett RJ. Oral glucose-tolerance tests and the diagnosis of diabetes: results of a prospective study based on the Whitehall survey. Lancet. 1979;2(8140):431-433.
  12. The Diabetes Control and Complications Trial Research Group.The effect of intensive treatment of diabetes on the development and progression of long-term complications in insulin-dependent diabetes mellitus. N Engl J Med. 1993;329(14):977-986.
  13. American Diabetes Association. 6. Glycemic Targets: Standards of Medical Care in Diabetes-2019. Diabetes Care. 2019;42(Suppl 1):S61-S70.
  14. American Diabetes Association: clinical practice recommendations 1997. Diabetes Care. 1997;20 Suppl 1:S1-70.
  15. American Diabetes Association. Standards of medical care in diabetes--2010. Diabetes Care. 2010;33 Suppl 1:S11-61.
  16. Lachin JM, Genuth S, Nathan DM, Zinman B, Rutledge BN, Group DER. Effect of glycemic exposure on the risk of microvascular complications in the diabetes control and complications trial--revisited. Diabetes. 2008;57(4):995-1001.
  17. American Diabetes Association. Standards of medical care in diabetes. Diabetes Care. 2004;27 Suppl 1:S15-35.
  18. Cheng YJ, Gregg EW, Geiss LS, Imperatore G, Williams DE, Zhang X, Albright AL, Cowie CC, Klein R, Saaddine JB. Association of A1C and fasting plasma glucose levels with diabetic retinopathy prevalence in the U.S. population: Implications for diabetes diagnostic thresholds. Diabetes Care. 2009;32(11):2027-2032.
  19. Diabetes Prevention Program Research Group. The prevalence of retinopathy in impaired glucose tolerance and recent-onset diabetes in the Diabetes Prevention Program. Diabet Med. 2007;24(2):137-144.
  20. Ford ES, Zhao G, Li C. Pre-diabetes and the risk for cardiovascular disease: a systematic review of the evidence. J Am Coll Cardiol. 2010;55(13):1310-1317.
  21. Ziegler D, Rathmann W, Dickhaus T, Meisinger C, Mielck A, Group KS. Prevalence of polyneuropathy in pre-diabetes and diabetes is associated with abdominal obesity and macroangiopathy: the MONICA/KORA Augsburg Surveys S2 and S3. Diabetes Care. 2008;31(3):464-469.
  22. Li Y GL, Burrows NR, Rolka DB, Albright A. Awareness of pre-diabetes – United States, 2005-2010. . MMWR. 2013;62(11):209-212.
  23. Moin T, Li J, Duru OK, Ettner S, Turk N, Keckhafer A, Ho S, Mangione CM. Metformin prescription for insured adults with prediabetes from 2010 to 2012: a retrospective cohort study. Ann Intern Med. 2015;162(8):542-548.
  24. Centers for Disease Control and Prevention.https://www.cdc.gov/diabetes/data/statistics-report/index.html. Accessed March 1, 2022.
  25. American Diabetes Association Professional Practice Committee, Draznin B, Aroda VR, Bakris G, Benson G, Brown FM, Freeman R, Green J, Huang E, Isaacs D, Kahan S, Leon J, Lyons SK, Peters AL, Prahalad P, Reusch JEB, Young-Hyman D, Das S, Kosiborod M. 3. Prevention or Delay of Type 2 Diabetes and Associated Comorbidities: Standards of Medical Care in Diabetes-2022. Diabetes Care. 2022;45(Supplement_1):S39-S45.
  26. American Diabetes Association Professional Practice Committee, Draznin B, Aroda VR, Bakris G, Benson G, Brown FM, Freeman R, Green J, Huang E, Isaacs D, Kahan S, Leon J, Lyons SK, Peters AL, Prahalad P, Reusch JEB, Young-Hyman D, Das S, Kosiborod M. 2. Classification and Diagnosis of Diabetes: Standards of Medical Care in Diabetes-2022. Diabetes Care. 2022;45(Supplement_1):S17-S38.
  27. de Vegt F, Dekker JM, Jager A, Hienkens E, Kostense PJ, Stehouwer CD, Nijpels G, Bouter LM, Heine RJ. Relation of impaired fasting and postload glucose with incident type 2 diabetes in a Dutch population: The Hoorn Study. JAMA. 2001;285(16):2109-2113.
  28. Engberg S, Vistisen D, Lau C, Glumer C, Jorgensen T, Pedersen O, Borch-Johnsen K. Progression to impaired glucose regulation and diabetes in the population-based Inter99 study. Diabetes Care. 2009;32(4):606-611.
  29. Meigs JB, Muller DC, Nathan DM, Blake DR, Andres R, Baltimore Longitudinal Study of A. The natural history of progression from normal glucose tolerance to type 2 diabetes in the Baltimore Longitudinal Study of Aging. Diabetes. 2003;52(6):1475-1484.
  30. Soderberg S, Zimmet P, Tuomilehto J, de Courten M, Dowse GK, Chitson P, Stenlund H, Gareeboo H, Alberti KG, Shaw J. High incidence of type 2 diabetes and increasing conversion rates from impaired fasting glucose and impaired glucose tolerance to diabetes in Mauritius. J Intern Med. 2004;256(1):37-47.
  31. Tirosh A, Shai I, Tekes-Manova D, Israeli E, Pereg D, Shochat T, Kochba I, Rudich A, Israeli Diabetes Research G. Normal fasting plasma glucose levels and type 2 diabetes in young men. N Engl J Med. 2005;353(14):1454-1462.
  32. Mooy JM, Grootenhuis PA, de Vries H, Kostense PJ, Popp-Snijders C, Bouter LM, Heine RJ. Intra-individual variation of glucose, specific insulin and proinsulin concentrations measured by two oral glucose tolerance tests in a general Caucasian population: the Hoorn Study. Diabetologia. 1996;39(3):298-305.
  33. Bergman M, Manco M, Sesti G, Dankner R, Pareek M, Jagannathan R, Chetrit A, Abdul-Ghani M, Buysschaert M, Olsen MH, Nilsson PM, Medina JL, Roth J, Groop L, Del Prato S, Raz I, Ceriello A. Petition to replace current OGTT criteria for diagnosing prediabetes with the 1-hour post-load plasma glucose>/=155mg/dl (8.6mmol/L). Diabetes Res Clin Pract. 2018;146:18-33.
  34. Juraschek SP, Steffes MW, Selvin E. Associations of alternative markers of glycemia with hemoglobin A(1c) and fasting glucose. Clin Chem. 2012;58(12):1648-1655.
  35. Vistisen D, Witte DR, Brunner EJ, Kivimaki M, Tabak A, Jorgensen ME, Faerch K. Risk of Cardiovascular Disease and Death in Individuals With Prediabetes Defined by Different Criteria: The Whitehall II Study. Diabetes Care. 2018;41(4):899-906.
  36. World Health Organization. Use of Glycated Haemoglobin (HbA1c) in the Diagnosis of Diabetes Mellitus. Geneva, Switzerland2011:1-25.
  37. Cowie CC, Rust KF, Ford ES, Eberhardt MS, Byrd-Holt DD, Li C, Williams DE, Gregg EW, Bainbridge KE, Saydah SH, Geiss LS. Full accounting of diabetes and pre-diabetes in the U.S. population in 1988-1994 and 2005-2006. Diabetes Care. 2009;32(2):287-294.
  38. Morris DH, Khunti K, Achana F, Srinivasan B, Gray LJ, Davies MJ, Webb D. Progression rates from HbA1c 6.0-6.4% and other prediabetes definitions to type 2 diabetes: a meta-analysis. Diabetologia. 2013;56(7):1489-1493.
  39. Zhang X, Gregg EW, Williamson DF, Barker LE, Thomas W, Bullard KM, Imperatore G, Williams DE, Albright AL. A1C level and future risk of diabetes: a systematic review. Diabetes Care. 2010;33(7):1665-1673.
  40. Rasmussen SS, Glumer C, Sandbaek A, Lauritzen T, Borch-Johnsen K. Progression from impaired fasting glucose and impaired glucose tolerance to diabetes in a high-risk screening programme in general practice: the ADDITION Study, Denmark. Diabetologia. 2007;50(2):293-297.
  41. Ferrannini E, Nannipieri M, Williams K, Gonzales C, Haffner SM, Stern MP. Mode of onset of type 2 diabetes from normal or impaired glucose tolerance. Diabetes. 2004;53(1):160-165.
  42. Rooney MR, Rawlings AM, Pankow JS, Echouffo Tcheugui JB, Coresh J, Sharrett AR, Selvin E. Risk of Progression to Diabetes Among Older Adults With Prediabetes. JAMA Intern Med. 2021;181(4):511-519.
  43. Tripathy D, Carlsson M, Almgren P, Isomaa B, Taskinen MR, Tuomi T, Groop LC. Insulin secretion and insulin sensitivity in relation to glucose tolerance: lessons from the Botnia Study. Diabetes. 2000;49(6):975-980.
  44. Faerch K, Witte DR, Tabak AG, Perreault L, Herder C, Brunner EJ, Kivimaki M, Vistisen D. Trajectories of cardiometabolic risk factors before diagnosis of three subtypes of type 2 diabetes: a post-hoc analysis of the longitudinal Whitehall II cohort study. Lancet Diabetes Endocrinol. 2013;1(1):43-51.
  45. Tabak AG, Jokela M, Akbaraly TN, Brunner EJ, Kivimaki M, Witte DR. Trajectories of glycaemia, insulin sensitivity, and insulin secretion before diagnosis of type 2 diabetes: an analysis from the Whitehall II study. Lancet. 2009;373(9682):2215-2221.
  46. Perreault L, Bergman BC, Playdon MC, Dalla Man C, Cobelli C, Eckel RH. Impaired fasting glucose with or without impaired glucose tolerance: progressive or parallel states of prediabetes? Am J Physiol Endocrinol Metab. 2008;295(2):E428-435.
  47. Clore JN, Glickman PS, Helm ST, Nestler JE, Blackard WG. Evidence for dual control mechanism regulating hepatic glucose output in nondiabetic men. Diabetes. 1991;40(8):1033-1040.
  48. Abdul-Ghani MA, Jenkinson CP, Richardson DK, Tripathy D, DeFronzo RA. Insulin secretion and action in subjects with impaired fasting glucose and impaired glucose tolerance: results from the Veterans Administration Genetic Epidemiology Study. Diabetes. 2006;55(5):1430-1435.
  49. Jani R, Molina M, Matsuda M, Balas B, Chavez A, DeFronzo RA, Abdul-Ghani M. Decreased non-insulin-dependent glucose clearance contributes to the rise in fasting plasma glucose in the nondiabetic range. Diabetes Care. 2008;31(2):311-315.
  50. Perreault L, Faerch K, Kerege AA, Bacon SD, Bergman BC. Hepatic glucose sensing is impaired, but can be normalized, in people with impaired fasting glucose. J Clin Endocrinol Metab. 2014;99(7):E1154-1162.
  51. Faerch K, Vaag A, Holst JJ, Glumer C, Pedersen O, Borch-Johnsen K. Impaired fasting glycaemia vs impaired glucose tolerance: similar impairment of pancreatic alpha and beta cell function but differential roles of incretin hormones and insulin action. Diabetologia. 2008;51(5):853-861.
  52. Meyer C, Pimenta W, Woerle HJ, Van Haeften T, Szoke E, Mitrakou A, Gerich J. Different mechanisms for impaired fasting glucose and impaired postprandial glucose tolerance in humans. Diabetes Care.2006;29(8):1909-1914.
  53. Tripathy D, Almgren P, Tuomi T, Groop L. Contribution of insulin-stimulated glucose uptake and basal hepatic insulin sensitivity to surrogate measures of insulin sensitivity. Diabetes Care. 2004;27(9):2204-2210.
  54. Weyer C, Bogardus C, Pratley RE. Metabolic characteristics of individuals with impaired fasting glucose and/or impaired glucose tolerance. Diabetes. 1999;48(11):2197-2203.
  55. Bock G, Dalla Man C, Campioni M, Chittilapilly E, Basu R, Toffolo G, Cobelli C, Rizza R. Pathogenesis of pre-diabetes: mechanisms of fasting and postprandial hyperglycemia in people with impaired fasting glucose and/or impaired glucose tolerance. Diabetes. 2006;55(12):3536-3549.
  56. Faerch K, Vaag A, Holst JJ, Hansen T, Jorgensen T, Borch-Johnsen K. Natural history of insulin sensitivity and insulin secretion in the progression from normal glucose tolerance to impaired fasting glycemia and impaired glucose tolerance: the Inter99 study. Diabetes Care. 2009;32(3):439-444.
  57. Festa A, D'Agostino R, Jr., Hanley AJ, Karter AJ, Saad MF, Haffner SM. Differences in insulin resistance in nondiabetic subjects with isolated impaired glucose tolerance or isolated impaired fasting glucose. Diabetes.2004;53(6):1549-1555.
  58. Laakso M, Zilinskaite J, Hansen T, Boesgaard TW, Vanttinen M, Stancakova A, Jansson PA, Pellme F, Holst JJ, Kuulasmaa T, Hribal ML, Sesti G, Stefan N, Fritsche A, Haring H, Pedersen O, Smith U, Consortium E. Insulin sensitivity, insulin release and glucagon-like peptide-1 levels in persons with impaired fasting glucose and/or impaired glucose tolerance in the EUGENE2 study. Diabetologia. 2008;51(3):502-511.
  59. Abdul-Ghani MA, Molina-Carrion M, Jani R, Jenkinson C, Defronzo RA. Adipocytes in subjects with impaired fasting glucose and impaired glucose tolerance are resistant to the anti-lipolytic effect of insulin. Acta Diabetol.2008;45(3):147-150.
  60. Hanefeld M, Koehler C, Henkel E, Fuecker K, Schaper F, Temelkova-Kurktschiev T. Post-challenge hyperglycaemia relates more strongly than fasting hyperglycaemia with carotid intima-media thickness: the RIAD Study. Risk Factors in Impaired Glucose Tolerance for Atherosclerosis and Diabetes. Diabet Med.2000;17(12):835-840.
  61. Williams JW, Zimmet PZ, Shaw JE, de Courten MP, Cameron AJ, Chitson P, Tuomilehto J, Alberti KG. Gender differences in the prevalence of impaired fasting glycaemia and impaired glucose tolerance in Mauritius. Does sex matter? Diabet Med. 2003;20(11):915-920.
  62. Kantartzis K, Machann J, Schick F, Fritsche A, Haring HU, Stefan N. The impact of liver fat vs visceral fat in determining categories of prediabetes. Diabetologia. 2010;53(5):882-889.
  63. Ahren B, Pacini G. Impaired adaptation of first-phase insulin secretion in postmenopausal women with glucose intolerance. Am J Physiol. 1997;273(4 Pt 1):E701-707.
  64. Festa A, Williams K, D'Agostino R, Jr., Wagenknecht LE, Haffner SM. The natural course of beta-cell function in nondiabetic and diabetic individuals: the Insulin Resistance Atherosclerosis Study. Diabetes. 2006;55(4):1114-1120.
  65. Cobb J, Eckhart A, Motsinger-Reif A, Carr B, Groop L, Ferrannini E. alpha-Hydroxybutyric Acid Is a Selective Metabolite Biomarker of Impaired Glucose Tolerance. Diabetes Care. 2016;39(6):988-995.
  66. Kosaka K, Noda M, Kuzuya T. Prevention of type 2 diabetes by lifestyle intervention: a Japanese trial in IGT males. Diabetes Res Clin Pract. 2005;67(2):152-162.
  67. Ramachandran A, Snehalatha C, Mary S, Mukesh B, Bhaskar AD, Vijay V, Indian Diabetes Prevention P. The Indian Diabetes Prevention Programme shows that lifestyle modification and metformin prevent type 2 diabetes in Asian Indian subjects with impaired glucose tolerance (IDPP-1). Diabetologia. 2006;49(2):289-297.
  68. Tuomilehto J, Lindstrom J, Eriksson JG, Valle TT, Hamalainen H, Ilanne-Parikka P, Keinanen-Kiukaanniemi S, Laakso M, Louheranta A, Rastas M, Salminen V, Uusitupa M, Finnish Diabetes Prevention Study G. Prevention of type 2 diabetes mellitus by changes in lifestyle among subjects with impaired glucose tolerance. N Engl J Med. 2001;344(18):1343-1350.
  69. Buchanan TA, Xiang AH, Peters RK, Kjos SL, Marroquin A, Goico J, Ochoa C, Tan S, Berkowitz K, Hodis HN, Azen SP. Preservation of pancreatic beta-cell function and prevention of type 2 diabetes by pharmacological treatment of insulin resistance in high-risk hispanic women. Diabetes. 2002;51(9):2796-2803.
  70. Chiasson JL, Josse RG, Gomis R, Hanefeld M, Karasik A, Laakso M, Group S-NTR. Acarbose for prevention of type 2 diabetes mellitus: the STOP-NIDDM randomised trial. Lancet. 2002;359(9323):2072-2077.
  71. DeFronzo RA, Tripathy D, Schwenke DC, Banerji M, Bray GA, Buchanan TA, Clement SC, Henry RR, Hodis HN, Kitabchi AE, Mack WJ, Mudaliar S, Ratner RE, Williams K, Stentz FB, Musi N, Reaven PD, Study AN. Pioglitazone for diabetes prevention in impaired glucose tolerance. N Engl J Med. 2011;364(12):1104-1115.
  72. Dream Trial Investigators, Gerstein HC, Yusuf S, Bosch J, Pogue J, Sheridan P, Dinccag N, Hanefeld M, Hoogwerf B, Laakso M, Mohan V, Shaw J, Zinman B, Holman RR. Effect of rosiglitazone on the frequency of diabetes in patients with impaired glucose tolerance or impaired fasting glucose: a randomised controlled trial. Lancet. 2006;368(9541):1096-1105.
  73. Holman RR, Coleman RL, Chan JCN, Chiasson JL, Feng H, Ge J, Gerstein HC, Gray R, Huo Y, Lang Z, McMurray JJ, Ryden L, Schroder S, Sun Y, Theodorakis MJ, Tendera M, Tucker L, Tuomilehto J, Wei Y, Yang W, Wang D, Hu D, Pan C, Group ACES. Effects of acarbose on cardiovascular and diabetes outcomes in patients with coronary heart disease and impaired glucose tolerance (ACE): a randomised, double-blind, placebo-controlled trial. Lancet Diabetes Endocrinol. 2017;5(11):877-886.
  74. Knowler WC, Barrett-Connor E, Fowler SE, Hamman RF, Lachin JM, Walker EA, Nathan DM, Diabetes Prevention Program Research G. Reduction in the incidence of type 2 diabetes with lifestyle intervention or metformin. N Engl J Med. 2002;346(6):393-403.
  75. Navigator Study Group, Holman RR, Haffner SM, McMurray JJ, Bethel MA, Holzhauer B, Hua TA, Belenkov Y, Boolell M, Buse JB, Buckley BM, Chacra AR, Chiang FT, Charbonnel B, Chow CC, Davies MJ, Deedwania P, Diem P, Einhorn D, Fonseca V, Fulcher GR, Gaciong Z, Gaztambide S, Giles T, Horton E, Ilkova H, Jenssen T, Kahn SE, Krum H, Laakso M, Leiter LA, Levitt NS, Mareev V, Martinez F, Masson C, Mazzone T, Meaney E, Nesto R, Pan C, Prager R, Raptis SA, Rutten GE, Sandstroem H, Schaper F, Scheen A, Schmitz O, Sinay I, Soska V, Stender S, Tamas G, Tognoni G, Tuomilehto J, Villamil AS, Vozar J, Califf RM. Effect of nateglinide on the incidence of diabetes and cardiovascular events. N Engl J Med. 2010;362(16):1463-1476.
  76. Origin Trial Investigators, Gerstein HC, Bosch J, Dagenais GR, Diaz R, Jung H, Maggioni AP, Pogue J, Probstfield J, Ramachandran A, Riddle MC, Ryden LE, Yusuf S. Basal insulin and cardiovascular and other outcomes in dysglycemia. N Engl J Med. 2012;367(4):319-328.
  77. Bohula EA, Scirica BM, Inzucchi SE, McGuire DK, Keech AC, Smith SR, Kanevsky E, Murphy SA, Leiter LA, Dwyer JP, Corbalan R, Hamm C, Kaplan L, Nicolau JC, Ophuis TO, Ray KK, Ruda M, Spinar J, Patel T, Miao W, Perdomo C, Francis B, Dhadda S, Bonaca MP, Ruff CT, Sabatine MS, Wiviott SD, Investigators C-TSC. Effect of lorcaserin on prevention and remission of type 2 diabetes in overweight and obese patients (CAMELLIA-TIMI 61): a randomised, placebo-controlled trial. Lancet. 2018;392(10161):2269-2279.
  78. Garvey WT, Ryan DH, Henry R, Bohannon NJ, Toplak H, Schwiers M, Troupin B, Day WW. Prevention of type 2 diabetes in subjects with prediabetes and metabolic syndrome treated with phentermine and topiramate extended release. Diabetes Care. 2014;37(4):912-921.
  79. le Roux CW, Astrup A, Fujioka K, Greenway F, Lau DC, Van Gaal L, Ortiz RV, Wilding JP, Skjoth TV, Manning LS, Pi-Sunyer X, Obesity S, Prediabetes NNSG. 3 years of liraglutide versus placebo for type 2 diabetes risk reduction and weight management in individuals with prediabetes: a randomised, double-blind trial. Lancet.2017.
  80. Nesto R, Fain R, Li Y, Shanahan W. Evaluation of lorcaserin on progression of prediabetes to type 2 diabetes and reversion to euglycemia. Postgrad Med. 2016;128(4):364-370.
  81. Torgerson JS, Hauptman J, Boldrin MN, Sjostrom L. XENical in the prevention of diabetes in obese subjects (XENDOS) study: a randomized study of orlistat as an adjunct to lifestyle changes for the prevention of type 2 diabetes in obese patients. Diabetes Care. 2004;27(1):155-161.
  82. Galaviz KI, Weber MB, Straus A, Haw JS, Narayan KMV, Ali MK. Global Diabetes Prevention Interventions: A Systematic Review and Network Meta-analysis of the Real-World Impact on Incidence, Weight, and Glucose. Diabetes Care. 2018;41(7):1526-1534.
  83. National Health Service. https://www.england.nhs.uk/wp-content/uploads/2016/08/dpp-faq.pdf. Accessed March 1, 2022.
  84. Sampson M, Clark A, Bachmann M, Garner N, Irvine L, Howe A, Greaves C, Auckland S, Smith J, Turner J, Rea D, Rayman G, Dhatariya K, John WG, Barton G, Usher R, Ferns C, Pascale M, Norfolk Diabetes Prevention Study G. Lifestyle Intervention With or Without Lay Volunteers to Prevent Type 2 Diabetes in People With Impaired Fasting Glucose and/or Nondiabetic Hyperglycemia: A Randomized Clinical Trial. JAMA Intern Med. 2021;181(2):168-178.
  85. American Diabetes Association. 3. Prevention or Delay of Type 2 Diabetes: Standards of Medical Care in Diabetes-2019. Diabetes Care. 2019;42(Suppl 1):S29-S33.
  86. Sattar N, Preiss D. HbA1c in type 2 diabetes diagnostic criteria: addressing the right questions to move the field forwards. Diabetologia. 2012;55(6):1564-1567.
  87. Tapp RJ, Shaw JE, Zimmet PZ, Balkau B, Chadban SJ, Tonkin AM, Welborn TA, Atkins RC. Albuminuria is evident in the early stages of diabetes onset: results from the Australian Diabetes, Obesity, and Lifestyle Study (AusDiab). Am J Kidney Dis. 2004;44(5):792-798.
  88. Ali MK, Bullard KM, Saydah S, Imperatore G, Gregg EW. Cardiovascular and renal burdens of prediabetes in the USA: analysis of data from serial cross-sectional surveys, 1988-2014. Lancet Diabetes Endocrinol.2018;6(5):392-403.
  89. Diabetes Prevention Program Research Group. Long-term effects of lifestyle intervention or metformin on diabetes development and microvascular complications over 15-year follow-up: the Diabetes Prevention Program Outcomes Study. Lancet Diabetes Endocrinol. 2015;3(11):866-875.
  90. Carlsson LM, Sjoholm K, Karlsson C, Jacobson P, Andersson-Assarsson JC, Svensson PA, Larsson I, Hjorth S, Neovius M, Taube M, Carlsson B, Peltonen M. Long-term incidence of microvascular disease after bariatric surgery or usual care in patients with obesity, stratified by baseline glycaemic status: a post-hoc analysis of participants from the Swedish Obese Subjects study. Lancet Diabetes Endocrinol. 2017;5(4):271-279.
  91. Gong Q, Zhang P, Wang J, Ma J, An Y, Chen Y, Zhang B, Feng X, Li H, Chen X, Cheng YJ, Gregg EW, Hu Y, Bennett PH, Li G, Da Qing Diabetes Prevention Study G. Morbidity and mortality after lifestyle intervention for people with impaired glucose tolerance: 30-year results of the Da Qing Diabetes Prevention Outcome Study. Lancet Diabetes Endocrinol. 2019;7(6):452-461.
  92. Qiao Q, Pyorala K, Pyorala M, Nissinen A, Lindstrom J, Tilvis R, Tuomilehto J. Two-hour glucose is a better risk predictor for incident coronary heart disease and cardiovascular mortality than fasting glucose. Eur Heart J.2002;23(16):1267-1275.
  93. Gregg EW, Li Y, Wang J, Burrows NR, Ali MK, Rolka D, Williams DE, Geiss L. Changes in diabetes-related complications in the United States, 1990-2010. N Engl J Med. 2014;370(16):1514-1523.
  94. Perreault L, Faerch K, Gregg EW. Can Cardiovascular Epidemiology and Clinical Trials Close the Risk Management Gap Between Diabetes and Prediabetes? Curr Diab Rep. 2017;17(9):77.
  95. Chiasson JL, Josse RG, Gomis R, Hanefeld M, Karasik A, Laakso M, Group S-NTR. Acarbose treatment and the risk of cardiovascular disease and hypertension in patients with impaired glucose tolerance: the STOP-NIDDM trial. JAMA. 2003;290(4):486-494.
  96. Kernan WN, Viscoli CM, Furie KL, Young LH, Inzucchi SE, Gorman M, Guarino PD, Lovejoy AM, Peduzzi PN, Conwit R, Brass LM, Schwartz GG, Adams HP, Jr., Berger L, Carolei A, Clark W, Coull B, Ford GA, Kleindorfer D, O'Leary JR, Parsons MW, Ringleb P, Sen S, Spence JD, Tanne D, Wang D, Winder TR, Investigators IT. Pioglitazone after Ischemic Stroke or Transient Ischemic Attack. N Engl J Med. 2016;374(14):1321-1331.
  97. van Agtmaal MJM, Houben A, de Wit V, Henry RMA, Schaper NC, Dagnelie PC, van der Kallen CJ, Koster A, Sep SJ, Kroon AA, Jansen JFA, Hofman PA, Backes WH, Schram MT, Stehouwer CDA. Prediabetes Is Associated With Structural Brain Abnormalities: The Maastricht Study. Diabetes Care. 2018;41(12):2535-2543.
  98. van Bussel FC, Backes WH, van Veenendaal TM, Hofman PA, van Boxtel MP, Schram MT, Sep SJ, Dagnelie PC, Schaper N, Stehouwer CD, Wildberger JE, Jansen JF. Functional Brain Networks Are Altered in Type 2 Diabetes and Prediabetes: Signs for Compensation of Cognitive Decrements? The Maastricht Study. Diabetes.2016;65(8):2404-2413.
  99. Xu W, Caracciolo B, Wang HX, Winblad B, Backman L, Qiu C, Fratiglioni L. Accelerated progression from mild cognitive impairment to dementia in people with diabetes. Diabetes. 2010;59(11):2928-2935.
  100. Perreault L, Pan Q, Mather KJ, Watson KE, Hamman RF, Kahn SE, Diabetes Prevention Program Research G. Effect of regression from prediabetes to normal glucose regulation on long-term reduction in diabetes risk: results from the Diabetes Prevention Program Outcomes Study. Lancet. 2012;379(9833):2243-2251.
  101. Perreault L, Pan Q, Schroeder EB, Kalyani RR, Bray GA, Dagogo-Jack S, White NH, Goldberg RB, Kahn SE, Knowler WC, Mathioudakis N, Dabelea D, Diabetes Prevention Program Research G. Regression From Prediabetes to Normal Glucose Regulation and Prevalence of Microvascular Disease in the Diabetes Prevention Program Outcomes Study (DPPOS). Diabetes Care. 2019;42(9):1809-1815.
  102. Perreault L, Temprosa M, Mather KJ, Horton E, Kitabchi A, Larkin M, Montez MG, Thayer D, Orchard TJ, Hamman RF, Goldberg RB, Diabetes Prevention Program Research G. Regression from prediabetes to normal glucose regulation is associated with reduction in cardiovascular risk: results from the Diabetes Prevention Program outcomes study. Diabetes Care. 2014;37(9):2622-2631.
  103. Garber AJ, Abrahamson MJ, Barzilay JI, Blonde L, Bloomgarden ZT, Bush MA, Dagogo-Jack S, DeFronzo RA, Einhorn D, Fonseca VA, Garber JR, Garvey WT, Grunberger G, Handelsman Y, Hirsch IB, Jellinger PS, McGill JB, Mechanick JI, Rosenblit PD, Umpierrez GE. Consensus Statement by the American Association of Clinical Endocrinologists and American College of Endocrinology on the Comprehensive Type 2 Diabetes Management Algorithm - 2019 Executive Summary. Endocr Pract. 2019;25(1):69-100.
  104. Phillips LS, Olson DE. Diabetes: normal glucose levels should be the goal. Nat Rev Endocrinol. 2012;8(9):510-512.
  105. Perreault L, Kahn SE, Christophi CA, Knowler WC, Hamman RF, Diabetes Prevention Program Research G. Regression from pre-diabetes to normal glucose regulation in the diabetes prevention program. Diabetes Care.2009;32(9):1583-1588.
  106. Herman WH, Pan Q, Edelstein SL, Mather KJ, Perreault L, Barrett-Connor E, Dabelea DM, Horton E, Kahn SE, Knowler WC, Lorenzo C, Pi-Sunyer X, Venditti E, Ye W, Diabetes Prevention Program Research G. Impact of Lifestyle and Metformin Interventions on the Risk of Progression to Diabetes and Regression to Normal Glucose Regulation in Overweight or Obese People With Impaired Glucose Regulation. Diabetes Care.2017;40(12):1668-1677.
  107. Perreault L, Ma Y, Dagogo-Jack S, Horton E, Marrero D, Crandall J, Barrett-Connor E, Diabetes Prevention P. Sex differences in diabetes risk and the effect of intensive lifestyle modification in the Diabetes Prevention Program. Diabetes Care. 2008;31(7):1416-1421.
  108. Diabetes Prevention Program Research Group, Crandall J, Schade D, Ma Y, Fujimoto WY, Barrett-Connor E, Fowler S, Dagogo-Jack S, Andres R. The influence of age on the effects of lifestyle modification and metformin in prevention of diabetes. J Gerontol A Biol Sci Med Sci. 2006;61(10):1075-1081.
  109. Zinman B, Harris SB, Neuman J, Gerstein HC, Retnakaran RR, Raboud J, Qi Y, Hanley AJ. Low-dose combination therapy with rosiglitazone and metformin to prevent type 2 diabetes mellitus (CANOE trial): a double-blind randomised controlled study. Lancet. 2010;376(9735):103-111.
  110. Coppell K, Freer T, Abel S, Whitehead L, Tipene-Leach D, Gray AR, Merriman T, Sullivan T, Krebs J, Perreault L. What predicts regression from pre-diabetes to normal glucose regulation following a primary care nurse-delivered dietary intervention? A study protocol for a prospective cohort study. BMJ Open. 2019;9(12):e033358.
  111. Ritchie ND, Sauder KA, Kaufmann PG, Perreault L. Patient-Centered Goal-Setting in the National Diabetes Prevention Program: A Pilot Study. Diabetes Care. 2021;44(11):2464-2469.
  112. Saydah SH, Loria CM, Eberhardt MS, Brancati FL. Subclinical states of glucose intolerance and risk of death in the U.S. Diabetes Care. 2001;24(3):447-453.


Platelets, Coagulation, and Antithrombotic Therapy in Diabetes

ABSTRACT


Diabetes mellitus is a strong, independent risk factor for the development of atherosclerotic cardiovascular disease (ASCVD) and therefore for atherothrombotic events. Compared to those without diabetes, individuals with diabetes are also at increased risk of cardioembolic stroke in the presence of atrial fibrillation (AF) and of venous thromboembolism. Activation of platelets and the coagulation cascade are the central mechanisms of thrombosis. A range of antiplatelet and anticoagulant drugs are now available. Antithrombotic therapy should be considered in all those with diabetes and established ASCVD or AF. Intensification of antithrombotic therapy is typically indicated during the acute phase of an atherothrombotic event or in those with chronic coronary syndromes who are at high ischemic risk, provided this outweighs bleeding risk. Clinical decisions regarding antithrombotic therapy should be made by assessing an individual’s ischemic and bleeding risks, in consultation with the recipient and reviewed upon any change in circumstances.


LIST OF ABBREVIATIONS


5HT

5-hydroxytryptamine

ACS

acute coronary syndrome

ADP

adenosine diphosphate

AF

atrial fibrillation

ALI

acute limb ischemia

APT

antiplatelet therapy

ASCVD

atherosclerotic cardiovascular disease

ATP

adenosine triphosphate

ATT

antithrombotic therapy

CAD

coronary artery disease

CCS

chronic coronary syndromes

CI

confidence interval

COX

cyclo-oxygenase

DAPT

dual antiplatelet therapy

DATT

dual antithrombotic therapy

DM

diabetes mellitus

DVT

deep vein thrombosis

GP

glycoprotein

HR

hazard ratio

LEAD

lower extremity artery disease

MACE

major adverse cardiovascular event

MI

myocardial infarction

miR

microribonucleic acid

NOAC

non-vitamin K antagonist oral anticoagulant

OAC

oral anticoagulant

PAD

peripheral artery disease

PAR

protease-activated receptor

PCI

percutaneous coronary intervention

PGI2

prostacyclin

RCTs

randomized controlled trials

RRR

relative risk reduction

SAPT

single antiplatelet therapy

TIMI

thrombolysis in myocardial infarction

TP

thromboprostanoid

TXA2

thromboxane A2

UA

unstable angina

VKA

vitamin K antagonist

vWF

von Willebrand factor


INTRODUCTION


Despite a century of advances in understanding and management of diabetes mellitus (DM), it continues to increase in prevalence and, furthermore, remains an independent risk factor for atherosclerotic cardiovascular disease (ASCVD), leading to a significant burden of premature mortality and morbidity (1).


ASCVD includes a spectrum of clinical syndromes. This can include acute presentations such as acute coronary syndromes (ACS, including myocardial infarction [MI] or unstable angina [UA]), thrombotic stroke, or acute limb ischemia (ALI) (Figure 1). Similarly, ASCVD can lead to chronic conditions such as chronic coronary syndromes (CCS, for example those with stable angina or a history of MI >1 year previously) or chronic lower extremity arterial disease (LEAD) (2).


Most acute events in ASCVD are caused by thrombosis. The hemostatic response has an important physiological role in the response to trauma but, if it becomes activated inappropriately, thrombosis can be triggered (3). The clinical effects of thrombosis arise primarily from its location, such as in the coronary arteries leading to acute coronary syndrome (ACS, including myocardial infarction [MI] and unstable angina [UA]), cerebral arteries leading to thrombotic stroke, peripheral arteries leading to acute limb ischemia or deep limb veins leading to deep vein thrombosis (DVT). Alternatively, a thrombus formed at a site can embolize, leading to presentations such as acute pulmonary embolism (typically embolism of a DVT to the pulmonary arteries) or embolic stroke (typically left atrial thrombus to the cerebral arteries) (2,4). In addition to atherosclerotic diseases, individuals with DM who have atrial fibrillation are at higher risk of stroke, secondary to atrial thrombosis and subsequent cardioembolic events (5).


There are clear links between pathological processes associated with DM and those responsible for atherogenesis and thrombosis, including inflammation, platelet activation, and coagulation (6,7). Alongside control of glucose levels and optimization of other risk factors, such as dyslipidemia, hypertension, and smoking cessation, antithrombotic therapy (ATT), including antiplatelet therapy (APT) and oral anticoagulation (OAC), has become a key component of the treatment and prevention of atherothrombotic and cardioembolic events. ATT has evolved greatly in the last decades, both in terms of the range of drugs available but also our understanding of how best to deploy them (8).


Whilst ATT reduces thrombotic risk, in particular reducing the composite of major adverse cardiovascular events (MACE, typically defined as cardiovascular death, stroke or MI), it also leads to an increased risk of bleeding. Balancing these risks is central to interpretation of clinical trial data and development of treatment recommendations, including in those with DM (9).


In this chapter, we will review the underlying pathophysiological mechanisms of thrombosis and the pharmacology of commonly prescribed drugs during ATT. With specific reference to individuals with DM, we will appraise evidence for ATT in a broad range of clinical settings, highlighting current treatment recommendations and particular areas in which more data are needed.

Figure 1. The spectrum of acute cardiovascular events relating to thrombosis and hemostasis in DM.

THE THROMBOTIC RESPONSE AND ITS PHARMACOLOGY


As described in Virchow’s triad, prothrombotic changes in the blood flow, constituents and/or vessel wall can trigger thrombosis (10). Broadly, thrombosis involves the activation of platelets and the coagulation cascade (Figure 2). Understanding these processes provides insights into how pharmacological modulation may improve ischemic risk and increase bleeding risk as well as how the individual components of combination ATT interact, including in those with DM.


Platelet Activation


Platelet activation typically occurs upon endothelial injury and atherosclerotic plaque rupture or erosion, resulting in exposure of blood constituents to prothrombotic substances such as collagen. Collagen exposure leads to platelets adhering to the vessel wall via the glycoprotein (GP) Ia receptor and activation via GPVI (11,12). GPIb forms a complex with clotting factors IX, V and von Willebrand Factor (vWF), strengthening adhesion (13).


Platelet activation involves several key processes. Alterations in the cytoskeleton lead to shape change with the formation of filopodia, which increase surface area to volume ratio and may facilitate mechanical adhesion to the vessel wall, other platelets and fibrin strands (14). Platelet activation also involves the release of arachidonic acid from the cell membrane, which is then locally converted to thromboxane A2 (TXA2) by cyclo-oxygenase (COX) 1 and TXA2synthase. TXA2, via the platelet TP-α receptor, contributes further to platelet activation (15). Aspirin (acetylsalicylic acid) irreversibly inhibits COX1, thereby blocking the downstream release of TXA2 for the platelet’s lifespan (around 8-10 days in healthy individuals) as, unlike nucleated cells, platelets cannot regenerate the enzyme (8). Endothelial COX1 and 2 generate the antiplatelet and vasodilatory substance prostacyclin (PGI2). The facts that aspirin is short-lived in the systemic circulation, that platelets are exposed to higher levels of aspirin than endothelium, due to travel through the portal circulation, and that aspirin has relative selectivity for COX1 over COX2 leads to aspirin’s net antiplatelet effect at low doses (16).


Platelets also undergo degranulation on activation; a granules contain procoagulant and proinflammatory factors, including platelet P-selectin (also known as CD62P), the surface expression of which is therefore increased. P-selectin mediates platelet-leukocyte aggregation and therefore contributes to an associated inflammatory response (17). Dense granules contain adenosine triphosphate (ATP), adenosine diphosphate (ADP) and 5-hydroxytryptamine (5HT, also known as serotonin). In particular, ADP stimulates platelet activation via P2Y1 and, most significantly, P2Y12 receptors (18,19).


Stimulation of the P2Y12 receptor leads to central amplification of the response to a range of agonists and contributes significantly to activation of platelet surface GPIIb/IIIa receptors, the final pathway of platelet aggregation (20). Via vWF and fibrinogen bridges, GPIIb/IIIa mediates platelet-platelet interaction (21).

Figure 2. Pathophysiology of the thrombotic response showing targets for antithrombotic drugs discussed in this chapter. 5HT, 5-hydroxytryptamine (serotonin); AA, arachidonic acid; ADP, adenosine diphosphate; ATP, adenosine triphosphate; Ca2+, calcium; COX1, cyclo-oxygenase 1; GP, glycoprotein; IXa, activated factor IX; P2X1, platelet ATP receptor; P2Y1/P2Y12, platelet ADP receptors; PAR, protease activated receptor; PLA2, phospholipase A2; PSGL1, P-selectin glycoprotein ligand 1; TF, tissue factor; TPα, thromboxane receptor α; TXA2, thromboxane A2; TXA2s, thromboxane A2 synthase; Va, activated factor V; VIIa, activated factor VII; VIIIa, activated factor VIII; VASP, vasodilator-stimulated phosphoprotein; vWF, von Willebrand factor; Xa, activated factor X; XIa, activated factor XI; XIIa, activated factor XII; XIIIa, activated factor XII. Modified from (22).

Several oral platelet P2Y12 receptor antagonists (‘P2Y12 inhibitors’) are currently available (23). Clopidogrel and prasugrel are irreversibly-binding thienopyridines (8). As pro-drugs, they require hepatic metabolism to be activated. In the case of prasugrel this pathway is reliable, whereas there is interindividual variation in the metabolism of clopidogrel meaning around one-third of recipients have poor response when assessed using aggregometry (22). Ticagrelor is a reversibly-binding cyclopentyl-triazolopyrimidine that does not require metabolism to be active. Prasugrel or ticagrelor provide more potent and reliable platelet inhibition compared with clopidogrel (24).


Parenterally administered P2Y12 inhibitors have also been developed. Cangrelor is a reversibly-binding ATP analogue that is potent and has rapid onset and offset (25). Selatogrel is a novel, parenterally-active, reversibly-binding P2Y12 inhibitor formulated for subcutaneous administration, but has not yet completed phase III trials and is yet to be marketed (26).


Activation of the Coagulation Cascade


Although likely an oversimplification of the in vivo state, the coagulation cascade can be summarized as two key pathways made up of factors that converge on a final pathway (27).


Loss of endothelium leads to exposure of subendothelial extracellular matrix and contact activation of factor XII, triggering the chain of clotting factor activation known as the intrinsic pathway (28). Tissue factor, expressed on subendothelial cells and released in microparticles from atheromatous plaques, can activate factor IX when in a complex with factor VII: this is the extrinsic pathway (29).


Initiation of either pathway can lead to activation of factor X, which associates with activated factor V, calcium (released from damaged tissue) and phospholipids to form the prothrombinase complex (30). Prothrombin (II) is thus broken down to thrombin (IIa), which completes the process through cleavage of fibrinogen to fibrin, the latter being insoluble and forming strands. Tissue factor pathway inhibitor and antithrombin limit this response, but, as recruitment of activated platelets contributes to higher levels of thrombin generation, this endogenous inhibition is quickly overwhelmed (31). Once fibrin is formed, factor XIIIa, activated by thrombin, stabilizes the structure of clot by forming crosslinks between strands and by crosslinking anti-fibrinolytic proteins into the clot (32).


Fibrin is lysed by plasmin, a proteolytic enzyme that degrades into variously termed fragments (33). Plasmin is cleaved from its precursor, plasminogen, by tissue plasminogen activator, and is endogenously inhibited by antiplasmin.


A number of drugs target the coagulation cascade. During chronic administration, vitamin K antagonists (VKA) such as warfarin reduce the biological activity of prothrombotic vitamin-K-dependent factors (II, VII, IX, X) more than antithrombotic factors (e.g., proteins C and S) (34). Non-vitamin K antagonist oral anticoagulants (NOACs) include the Xa inhibitors apixaban, edoxaban and rivaroxaban and the thrombin inhibitor dabigatran (35).


Crosstalk Between Platelets and the Coagulation Cascade


Despite the fact that platelets and coagulation are often considered separately when discussing physiology and pharmacology, there is significant crosstalk between the two. Thrombin is generated upon activation of coagulation, and is able to stimulate platelet activation via action on protease-activated receptor (PAR) 1 and, at higher concentrations, PAR4 (36). Conversely platelets can contribute to thrombin generation, increasing coagulability, via scramblase activity that leads to greater surface expression of phosphatidylserine, supporting the assembly of prothrombinase complex on the activated platelet surface, which potentiates thrombin generation (37).


SPECIAL PATHOPHYSIOLOGICAL CONSIDERATIONS IN DIABETES


DM is an independent risk factor for atherothrombosis and also thrombosis after vascular interventions (38).  Individuals with DM have greater average atherosclerotic plaque burden than those without (39), and onset is at an earlier age (40). There is also some evidence that atherosclerosis in people with DM is more likely to involve distal vessels than those without DM (41). The reasons for this are not completely understood and are likely multifactorial, but a number of relevant pathological processes such as hyperglycemia, chronic inflammation, and oxidative stress are prominent in DM. These contribute to both endothelial injury/dysfunction and increased platelet reactivity, resulting in a prothrombotic milieu (42-44).


Platelet activation markers are enhanced in people with DM (45). Effects of hyperglycemia on platelets include increased expression of GPIba, GPIIb/IIIa, and P2Y12, and reduced platelet membrane fluidity (46,47).Hyperglycemia-induced changes in intracellular magnesium and calcium signaling increase sensitivity of platelets to agonists such as ADP, epinephrine and thrombin (48). TXA2 and F2-isoprostane synthesis is increased, the latter via oxidative stress, leading to increased TPa receptor stimulation (49). Reduced sensitivity to PGI2, nitric oxide and insulin, which inhibit platelet activation, also contributes to hyper-reactivity (50,51).


Platelet turnover is accelerated in those with DM compared to those without (52). This increased activity in the creation and destruction of circulating platelets means a higher proportion of immature platelets, which are hyper-reactive, are present at any time (53). As well as increasing baseline platelet reactivity, the more frequent appearance of aspirin-naïve platelets in the circulation means more have uninhibited COX1 between doses (54).


There is also evidence that DM affects expression of platelet-associated microRNAs (miR-223, miR-26b, miR-126, miR-140), which play a role in the expression in a wide range of genes including those encoding the P2Y12 receptor and P-selectin, though the significance of this remains to be fully established (55,56).


As well as platelet activation, DM may affect coagulation and fibrinolysis (57). Changes include increased levels of tissue factor, prothrombin, factor VII and fibrinogen leading to impaired anticoagulant and fibrinolytic activity (58). Increased levels of fibrinogen and its levels of glycation and oxidation lead to more compact, densely-packed fibrin networks and reduced fibrinolysis (59). Hyperglycemia inhibits the fibrinolytic activity of plasminogen through inducing qualitative changes (60). Fibrinolysis is further impaired by elevated levels of plasminogen activator inhibitor 1 and thrombin-activatable fibrinolysis inhibitor as well as incorporation into clot of complement C3 and plasmin inhibitor (59,61).


DM also appears to enhance the crosstalk between platelets and clotting factors, leading to tendency to more externalization of phosphatidylserine in the outer platelet membrane, promoting clotting factor assembly and tissue factor activation (62).


Finally, individuals with DM frequently have other metabolic conditions such as obesity, dyslipidemia, and increased systemic inflammation. These may interact with diabetes to further enhance platelet reactivity and impair fibrinolysis (59).


CURRENT EVIDENCE AND TREATMENT RECOMMENDATIONS FOR ANTITHROMBOTIC THERAPY IN DIABETES


The Need for Therapeutic Oral Anticoagulation


Broadly, when considering the need for antithrombotic therapy (ATT), including in people with DM, it is helpful to make first a distinction between those with an indication for therapeutic anticoagulation and those without. The most common indication is for prevention of cardioembolic stroke in those with current or previous atrial fibrillation (AF). Individuals with atrial flutter are typically regarded as having similar thrombotic risk to those with AF so similar recommendations are followed (63).


DM increases the risk of developing AF by around 40% (64,65). Whilst difficult to completely exclude the effects of confounders such as obesity and hypertension, epidemiological data suggest a causal association between DM and AF, including that poor glycemic control and longer diabetes duration increase AF risk (66). A raised level of HbA1c is also associated with a higher chance of AF recurrence after catheter ablation (67). Hyperglycemia and glycemic fluctuations may contribute to the development of AF though exact mechanisms remain to be determined. Disappointingly, however, there is no clear evidence that intensive glycemic control reduces AF risk, though prospective trials are lacking (66). Treatment with metformin, thiazolidinediones, or dapagliflozin is associated with lower AF risk, suggesting that hypoglycemia avoidance may play a role but adequately designed studies to investigate this possibility are lacking (68-71). AF is often clinically silent and screening with simple pulse checking or using wearable devices should be considered in those over 65 years old (72).


Presence of DM is incorporated into the CHA2DS2VASc score used to assess stroke risk when determining whether to recommend oral anticoagulation in people with AF (Table 1 and 2) (73). Long-term oral anticoagulation is strongly recommended in those with AF/atrial flutter and a CHA2DS2VASc score of ³2 (if male) or ³3 (if female), and should be considered when the score is 1 (male) or 2 (female). Individuals with DM, technically defined for the purposes of calculating the score as treatment with oral hypoglycemic drugs and/or insulin or fasting blood glucose >7.0 mmol/L (126 mg/dL), will have a score of at least 1 (males) or 2 (females), therefore OAC should be considered in all people with DM and concurrent AF (63). Bleeding risk should also be considered when weighing the benefits and risks of OAC, but there is no concrete evidence that DM itself increases this, including in those with complications such as retinopathy (74). For people with non-valvular AF (i.e., those without at least moderate mitral valve stenosis or a mechanical valve prothesis), there is now good evidence that, unless contraindicated, a NOAC should be preferred over a VKA, offering better stroke prevention whilst leading to less bleeding, including in individuals with DM (75).


Components of the CHA2DS2VASc score are shown in Table 1 and the relation of the score with stroke risk is shown in table 2 (76-78).


Table 1. Components of the CHA2DS2VASc Score

Abbreviation

Criterion

Contribution to score

Details

C

Congestive heart failure

1

LVEF £40%

H

Hypertension

1

Includes patients receiving antihypertensive medication

A

Age ³75 years

2


D

Diabetes

1

Treatment with oral hypoglycemic drugs and/or insulin or fasting blood glucose >7.0 mmol/L (126 mg/dL)

S

Stroke/TIA/thromboembolism

2


V

Vascular disease

1

Atherosclerotic disease e.g., prior MI, PAD or aortic plaque

A

Age 65-74

1


Sc

Sex category female

1


LVEF, left ventricular ejection fraction; MI, myocardial infarction; PAD, peripheral artery disease; TIA, transient ischemic attack.


Table 2. Relation of CHA2DS2VASc Score with Stroke Risk

Total CHA2DS2VASc score

Adjusted stroke risk (% per year)

0

<1

1

1.3

2

2.2

3

3.2

4

4.0

5

6.7

6

9.8

7

9.6

8

6.7

9

15.2


When choosing between individual non-vitamin K antagonist oral anticoagulants (NOACs), beyond considering specific drug interactions, there is little evidence to support the use of one agent over another as these have never undergone head-to-head clinical outcome-driven randomized controlled trials (RCTs), although observational data have emerged to provide some insights. In a large retrospective observational study of 434,046 participants with non-valvular AF comparing treatment with apixaban, dabigatran, rivaroxaban and warfarin, apixaban led to a lower risk of stroke against both dabigatran (HR 0.72 [ 95% CI 0.60-0.85]) and rivaroxaban (0.80 [0.73-0.89]), whilst also leading to less bleeding (major bleeding: vs. dabigatran 0.78 [0.70-0.87]; vs. rivaroxaban 0.80 [0.55-0.59]) (79). These findings remain hypothesis-generating, however, and prospective trials would clarify this issue more definitively.


Although not discussed in detail in this chapter, OAC may also be indicated for the treatment and prevention of venous thromboembolism. Whilst DM is regarded as a weak risk factor for VTE, beyond this there are no particular considerations relating to DM and usual clinical guidelines as for non-DM individuals should generally be followed (4). Of specific note, however, is that people with DM who are experiencing hyperosmolar states such as ketoacidosis or hyperosmolar hyperglycemic syndrome are at particular risk of VTE. There is ongoing debate around the intensity of anticoagulation that is appropriate for thromboprophylaxis in this group. Consensus is that at least prophylactic doses of low molecular weight heparin, for example, are warranted, with others advocate therapeutic doses (80,81). A robustly-powered clinical outcomes-driven RCT would be welcome to definitively address this issue.


Where indications for both anti-platelet therapy (APT) and therapeutic levels of oral anticoagulant therapy (OAC) exist, the general principle is to prioritize continuation of OAC. Co-prescription of APT and OAC should in general be reserved for those with acute coronary syndrome (ACS), recent percutaneous coronary intervention (PCI) or indication for long-term therapy in selected individuals with chronic coronary syndromes (CCS) where ischemic risk is felt to significantly outweigh bleeding risk (22).


Treating Acute Atherothrombotic Events


ACUTE CORONARY SYNDROMES (ACS)


Current guidelines recommend 12 months of dual antiplatelet therapy (DAPT) with aspirin and a P2Y12 inhibitor, including in those with DM, as the default antithrombotic strategy for ACS (72,82-84).


There is robust evidence for aspirin therapy in ACS. For example, ISIS-2 demonstrated that aspirin led to an odds reduction in 30-day vascular mortality of 23% in those with acute MI (85). Current recommendations advise a loading dose of around 300 mg followed by maintenance therapy with 75 mg once daily, including in those with DM. However, because of higher platelet turnover in people with DM, 24-hour platelet inhibition is greater with twice-daily compared with once-daily aspirin administration (86-88). Any effects of clinical outcomes are yet to be determined, but are being studied in the ANDAMAN trial that aims to recruit 2573 participants (NCT02520921) and is estimated to finish in December 2023.


In ACS, the newer P2Y12 inhibitors prasugrel and ticagrelor are recommended in preference to clopidogrel due to their greater pharmacodynamic and clinical efficacy (83,84). Post-hoc analysis of the TRITON-TIMI trial suggested an impressive benefit of prasugrel over clopidogrel in people with DM (89). Similar findings were noted with regards to ticagrelor over clopidogrel in the PLATO trial, for which post-hoc analysis showing that the absolute benefit of was greatest in individuals with both DM and chronic kidney disease (90).


Table 3. Key Double-Blinded Randomized Controlled Trials of Dual Antiplatelet Therapy in Acute Coronary Syndrome, Including in People with Diabetes.


Trial


n

ACS group included

Group 1

Group 2

Primary efficacy endpoint – whole trial population

Number with DM

Primary efficacy endpoint – DM subgroup

CURE

(91)

12,562


NSTE-ACUTE CORONARY SYNDROME

Aspirin + Clopidogrel

Aspirin + Placebo

CV death/MI/stroke:11.4% vs. 9.3%, HR 0.80 [95% CI 0.72-0.90], p<0.001), ARR 2.1%.

2840 (23%)

CV death/MI/stroke:14.2% vs. 16.7%. RR 0.85. ARR 2.5%.


CLARITY

(92)

3491

STEMI

Aspirin + Clopidogrel

Aspirin + Placebo

Occluded infarct-related artery/death/recurrent MI: 15.0% vs. 21.7%, odds reduction 36% [95% CI 24-47], p<0.001, ARR 6.7%.

575 (16%)

NR

COMMIT

(93)

45,852


STEMI

Aspirin + Clopidogrel

Aspirin + Placebo

Death/reinfarction/stroke: 9.2% vs. 10.1%, OR 0.91 [95% CI 0.86-0.97], p=0.002, ARR 0.9%.

NR

NR

TRITON-THROMBOLYSIS IN MYOCARDIAL INFARCTION 38

(94)

13,608

ACUTE CORONARY SYNDROME with scheduled PCI

Aspirin + Prasugrel

Aspirin + Clopidogrel

CV death/MI/stroke: 9.9% vs. 12.1%, HR 0.81 [95% CI 0.73-0.90], p<0.001, ARR 2.2%.

3146 (23%)

CV death/MI/stroke: 12.2% vs. 17.0%, HR 0.70, ARR 4.8%.

TRILOGY ACUTE CORONARY SYNDROME

(95)

7243

NSTE-ACUTE CORONARY SYNDROME

with medical management

Aspirin + Prasugrel

Aspirin + Clopidogrel

CV death/MI/stroke: 13.9% vs. 16.0%, HR 0.91 [95% CI 0.79-1.05], p=0.21, ARR 2.1%.

2811 (39%)

CV death/MI/stroke: 17.8% vs. 20.4%, HR 0.90 [95% CI 0.73 to 1.09]), ARR=2.6%, interaction-p for DM status 0.71, ARR 2.6%.

PLATO

(96)

18,624

All ACUTE CORONARY SYNDROME (STEMI

patients included only if for PPCI)

Aspirin + Ticagrelor

Aspirin + Clopidogrel

CV death/MI/stroke: 9.8% vs. 11.7%, HR 0.84 [95% CI 0.77-0.92], p<0.001, ARR 1.9%.


4662 (25%)

CV death/MI/stroke: 14.1% vs. 16.2, HR 0.88 [95% CI 0.76-1.03], interaction-p for DM status 0.49, ARR 2.1%.

ACS, acute coronary syndrome; ARR, absolute risk reduction; CV, cardiovascular; DM, diabetes mellitus; HR, hazard ratio; MI, myocardial infarction; NR, not reported; NSTE-ACS, non-ST elevation ACS; OR, odds ratio; PCI, percutaneous coronary intervention; PPCI, primary PCI; PPM, permanent pacemaker; RR, relative risk; STEMI, ST elevation MI; NR, not recorded


The recent ISAR-REACT-5 study demonstrated superiority of a prasugrel-based strategy over a ticagrelor-based strategy in reducing cardiovascular events in ACS patients but was an open-label trial with limited power (97,98). Furthermore, data from the pre-specified subgroup with DM suggested there was no difference between the drugs (99).


Early de-escalation from dual antiplatelet therapy (DAPT) to ticagrelor monotherapy after PCI, including for ACS, has recently been trialed as an alternative strategy. In the TWILIGHT study, de-escalation from aspirin and ticagrelor to ticagrelor monotherapy at 3 months after PCI for ACS or stable coronary artery disease (CAD) was compared with continued DAPT in 7,119 participants (100). De-escalating to ticagrelor monotherapy led to a lower incidence at 12 months of the primary end point of Bleeding Academic Research Consortium type 2, 3, or 5 bleeding compared with DAPT (4.0% vs 7.1%, HR 0.56 [95% 0.45-0.68], p<0.001). This finding appeared similar regardless of DM status. There was no evidence of an increase in the secondary combined endpoint of death, MI or stroke. Conversely, 1 month of DAPT followed by ticagrelor alone for 23 months was not superior to 12 months of standard DAPT followed by 12 months of aspirin alone in reducing the primary endpoint of all-cause mortality or new Q-wave MI following PCI in the GLOBAL LEADERS trial, in which 47% of participants had ACS (101). Antiplatelet strategy had no significant effect on BARC type 3 or 5 bleeding in those with and without DM (102). Currently, de-escalation of DAPT may be an option for individuals with high bleeding risk and relatively low risk of vascular re-occlusion but guidelines are yet to recommend more widespread adoption.


In summary, following ACS in individuals with diabetes, DAPT for 12 months with aspirin and prasugrel or aspirin and ticagrelor is recommended by the majority of guidelines/experts and early de-escalation should be reserved to those at high bleeding risk. Longer term DAPT should be considered in those at high thrombosis/low bleeding risk, which is further detailed below. 


ACUTE ISCHEMIC STROKE


If no contraindications exist, the first-line treatment for significant acute ischemic stroke is thrombolysis with an intravenous tissue plasminogen activator, or percutaneous mechanical thrombectomy (103). Antiplatelet therapy (APT), typically aspirin monotherapy, is then administered from 24 hours later (104,105).


In those with minor stroke (National Institutes of Health Stroke Score <3), high-risk transient ischemic attack (TIA) (Age, blood pressure, clinical feature, duration and presence of diabetes score>4) or TIA not requiring thrombolysis or thrombectomy, APT can be initiated as soon as hemorrhagic stroke is excluded. The current regimen of choice may be dual antiplatelet therapy (DAPT) with aspirin 75-100 mg once daily and clopidogrel 75 mg once daily, based on findings from the CHANCE and POINT trials (106,107). After 21 days, DAPT should be de-escalated to clopidogrel monotherapy (105).


Both ticagrelor monotherapy and aspirin plus ticagrelor have also been compared to aspirin alone after acute non-severe ischemic stroke or high-risk TIA. The SOCRATES trial narrowly failed to demonstrate statistically-significant difference in the primary endpoint of stroke, MI or death (6.7% vs. 7.5%, HR 0.89 [95% CI 0.78-1.01], p=0.07) between participants receiving ticagrelor vs. aspirin (108). However, exploratory analysis suggested those who received both aspirin and ticagrelor in the peri-event period appeared to gain more benefit compared to individuals not having aspirin pre-randomization (HR 0.76 [95% CI 0.61-0.95], p=0.02; vs. 0.96 [0.82-1.12]). This was explored further in the THALES trial, which demonstrated a significant reduction in the primary composite endpoint of stroke or death at 30 days (5.5% vs. 6.6%, HR 0.83 [95% CI 0.71-0.96, p=0.02) when receiving aspirin plus ticagrelor compared to aspirin alone, but at the expense of more frequent severe bleeding (0.5% vs. 0.1%, HR 3.99 [95% CI 1.74-9.14], p=0.001), defined using the Global Utilization of Streptokinase and Tissue Plasminogen Activator for Occluded Coronary Arteries trial criteria (109). Findings from SOCRATES appeared similar in the subgroups with and without DM, whereas in THALES there was less signal of benefit of DAPT in those with DM vs. those without (HR 0.93 [95% CI 0.72-1.20] vs. 0.78 [0.64-0.94]).


In summary, following major stroke requiring thrombolysis or thrombectomy, aspirin monotherapy should be administered 24 hours later. In minor stroke or high-risk TIA, DAPT should be initiated as soon as intracerebral bleeding is ruled out and continued for 21 days with aspirin then withdrawn and individuals treated with long-term clopidogrel monotherapy.


Preventing Atherothrombotic Events in Individuals with Diabetes and Established Cardiovascular Disease


CORONARY ARTERY DISEASE


In those with established CAD, even without an ACS event in the last 12 months, the benefits of antiplatelet therapy (APT) are well-established. Robust evidence for vs. against use of APT in patients with ASCVD, including CAD comes, for example, from the Antithrombotic Trialists Collaboration, who performed a meta-analysis including 135,000 individuals (110). This demonstrated clear benefit, mainly with aspirin as single-antiplatelet therapy (SAPT), in reducing MACE by around a quarter (110).  The incidence of diabetes in these studies, many of which are now several decades old, was relatively low, however.


There is evidence from trials with both pharmacodynamic and clinical outcomes that increasing daily aspirin dose beyond 75-100 mg in patients with DM leads to neither greater platelet inhibition nor improved outcomes (111,112).


Daily doses of aspirin in the range 75-100 mg and no higher are recommended for use as APT. Recent data on clinical outcomes relating to aspirin dosing comes from the ADAPTABLE trial, in which the regimens 81 mg OD and 325 mg OD were compared in 15,076 patients with ASCVD (113). After a median of 26 months, there was no significant difference in the rates of a composite primary endpoint of all-cause death, hospitalization for myocardial infarction or hospitalization for stroke (7.28% [81 mg] vs. 7.51% [325 mg], HR 1.02, 95% CI 0.91-1.14; p=0.75). Furthermore, this finding appeared replicated in the subgroup (n=5676) with diabetes (HR 0.99 [0.84-1.17]). This is supported by pharmacodynamic data showing that, whilst individuals with DM have reduced response to aspirin 75 mg once daily compared with healthy controls, increasing the dose to 300 mg does not alter the response (111).


In the CAPRIE study, clopidogrel 75 mg once daily was compared with aspirin 325 mg once daily (114). There was a slightly lower rate of MI, ischemic stroke or CV death with clopidogrel (5.32% vs. 5.83%, RRR 8.7% [95% CI 0.3-16.5], p=0.043) as well as less gastrointestinal bleeding. A fifth of participants in CAPRIE had diabetes and a retrospective subgroup analysis suggested an amplified benefit of clopidogrel over aspirin compared to those without diabetes. Clopidogrel monotherapy is currently recommended in those people with chronic coronary syndromes (CCS) who are unable to take aspirin, or, based on pre-specified subgroup analyses of CAPRIE suggesting particular benefit, as a first-line agent in those with either concurrent CAD and cerebrovascular disease or PAD.


Beyond single antiplatelet therapy (SAPT), there is good evidence for intensification of antithrombotic therapy in select people with CAD who are at high risk of ischemic events but without high risk of bleeding. The Clopidogrel for High Atherothrombotic Risk and Ischemic Stabilization, Management, and Avoidance (CHARISMA) study randomized 19,185 stable aspirin-treated individuals with established atherothrombotic disease or multiple risk factors to receive clopidogrel 75 mg once daily or placebo (115). Though the point estimate of the hazard ratio was below 1, there was no significant reduction in the primary efficacy endpoint of MACE when receiving dual antithrombotic therapy (DAPT) vs. aspirin alone (HR 0.93, [95% CI 0.83-1.05], p=0.22). However, in the subgroup with prior MI, prior stroke or PAD, there was some evidence of benefit (0.77 [0.61-0.98], p=0.031) (116). Around 30% of the participants in CHARISMA had DM and there was in fact a trend towards less benefit of DAPT over SAPT in this group compared to those without DM.


The DAPT study similarly showed that 30 vs. 12 months of clopidogrel (65%) or prasugrel (35%) given to aspirin-treated individuals undergoing PCI significantly reduced death, MI or stroke in those with prior MI (HR 0.56 [95% CI 0.42-0.76], p<0.001), but not those without (0.83 [0.68-1.02], p=0.08) (117). Like CAPRIE, there was some evidence that those in the trial with DM gained less benefit in reduction of MACE from continued thienopyridine vs. placebo, when compared to those without DM (6.6% vs. 7.0% in those with DM, p=0.55; 3.3% vs. 5.2% in those without, p<0.001; interaction-p=0.03). Conversely, DM did not appear to be an interacting factor with regards to stent thrombosis or bleeding.


There is perhaps more convincing evidence, particularly in those with DM, for use of long-term ticagrelor-based DAPT. In the PEGASUS-TIMI 54 study, DAPT with aspirin plus ticagrelor, either 60 mg or 90 mg twice-daily, reduced MACE vs. aspirin alone (e.g. 60 mg twice-daily vs. placebo: HR 0.84 [95% CI 0.74-0.95], p=0.008) in participants with prior MI (>1 year ago) and an additional risk factor (age ≥65 years, DM, recurrent MI, multivessel CAD or non-end stage CKD) (118). Thrombolysis In Myocardial Infarction (TIMI)-major bleeding was significantly more frequent in ticagrelor-treated individuals, but serious events such as intracranial hemorrhage, hemorrhagic stroke or fatal bleeding showed no increase. In contrast to the thienopyridine trials, the 6806 participants with diabetes demonstrated a significant benefit of DAPT over SAPT in reducing MACE (HR 0.84 [95% CI 0.72-0.99], p=0.035) with a greater absolute risk reduction than in the cohort without diabetes (1.5% vs. 1.1%) (119). Patients without a history of anemia or hospitalization for bleeding, important risk factors for bleeding, appeared to derive greater benefit from long-term DAPT (120).


As well as in those with prior MI, ticagrelor-based DAPT has also been tested against aspirin alone in people with type 2 DM and chronic coronary syndromes (CCS) but without prior MI. THEMIS included 19,220 participants randomized to receive ticagrelor (90 mg twice daily, reduced to 60 mg during the trial) or placebo, on a background of aspirin treatment (121). After an average follow-up of 40 months, there was a lower incidence of MACE in those receiving ticagrelor when compared to placebo (HR 0.90 [95% CI 0.81-0.99], p=0.04).  Notably, however, there was a relatively greater increase in TIMI-major bleeding (2.32 [1.82-2.94], p<0.001). Whilst meeting its primary endpoint, the net clinical benefit has not supported adoption in European practice, although subgroup analysis has suggested this may have been more favorable in those patients with prior PCI (122). Furthermore, based on the THEMIS data, the US Food and Drug Administration has recently extended the licensed indication for ticagrelor to include the prevention of a first MI or stroke in people with CCS at high risk of MI or stroke, including in those with DM (123).


An alternative to long-term DAPT is low-dose dual antithrombotic therapy (DATT) with aspirin 75-100 mg once daily and rivaroxaban 2.5 mg twice daily.  The COMPASS trial included randomization of 27,395 participants with prior MI or multivessel CAD (38% with DM) or PAD to receive either low-dose DATT, rivaroxaban 5 mg twice daily alone or aspirin alone (124). Compared to aspirin alone, low-dose DATT led to a significantly reduced incidence of MACE [4.1% vs 5.4%, HR 0.76 [95% CI 0.66-0.86], p<0.001], people with DM gaining an even greater absolute net benefit.


Current guidelines recommend long-term DAPT or low-dose dual antithrombotic therapy (DATT) in those individuals with CCS without an indication for therapeutic oral anticoagulant (OAC) who are at high ischemic risk but not high bleeding risk (22).


In those undergoing PCI for stable CAD, including in those individuals with DM, the standard DATT regimen is DAPT with aspirin and clopidogrel for 6 months (125).


In summary, individuals with DM who have CCS should be treated with at least one antiplatelet agent, usually aspirin, although clopidogrel can be used if aspirin is contraindicated. However, more recent evidence indicates that those with a previous MI benefit from long-term DAPT (aspirin and ticagrelor) or a combination of antiplatelet and anticoagulant (DATT with aspirin and rivaroxaban) provided they have a low bleeding risk. Individuals with significant CAD but without a previous MI may also benefit from DAPT or DATT, which is best reserved for people with high vascular risk but low bleeding risk. 


CEREBROVASCULAR DISEASE  


There is good evidence for use of APT with aspirin, clopidogrel, ticlopidine or aspirin and dipyridamole in combination for secondary prevention in people with cerebrovascular disease, including those who also have DM (126). Aspirin plus dipyridamole offers better long-term protection than aspirin alone, but has a frequent adverse effect of headache that can limit its use (127). Clopidogrel monotherapy, without this side effect, offers similar levels of secondary prevention to aspirin plus dipyridamole and is the current preferred agent. In the first 3 months after an ischemic stroke, if reperfusion therapy has been given, aspirin alone is typically prescribed. In cases where reperfusion therapy has not been given, there is good evidence for using either aspirin and clopidogrel or aspirin and ticagrelor over aspirin alone (128,129).  After 3 months, typically clopidogrel monotherapy is then given long-term, though aspirin and dipyridamole or aspirin alone are used instead at some centers (127,130,131).


PERIPHERAL ARTERY DISEASE


The effectiveness of APT for secondary prevention of ASCVD, including in those with symptomatic PAD, was established by the Antithrombotic Trialists’ Collaboration as discussed above. Similarly, in the CAPRIE trial, P2Y12inhibitor monotherapy with clopidogrel was compared with aspirin, including in people with PAD (114). Whilst in the overall trial population there was only a modest reduction in MACE, there was evidence of greater efficacy in the subgroup with PAD, meaning clopidogrel may be preferred to aspirin. Current ESC guidelines recommend either aspirin or clopidogrel for patients with symptomatic PAD and/or those who have required revascularization, including in individuals with DM (132).


In those with symptomatic PAD, ticagrelor monotherapy has also been compared with clopidogrel in the EUCLID trial (133). There was no significant difference in the primary composite endpoint of MACE during a median follow-up period of 30 months and therefore ticagrelor monotherapy is not licensed for use in PAD. Prasugrel monotherapy has not been well tested in clinical-outcome studies but may offer pharmacodynamic advantages over clopidogrel, including in individuals with DM (134).


Comparison of DAPT (aspirin plus clopidogrel) with aspirin alone in people with PAD was included in CHARISMA (n=3,096 with PAD, 36.2% with DM). There was no significant difference in MACE (7.6% vs 8.9%, HR 0.85 [0.66–1.08], p=0.18) (135).


Conversely, there is good evidence for intensification of aspirin monotherapy to low-dose DATT with aspirin 75-100 mg once daily and rivaroxaban 2.5 mg twice daily in people with PAD, supported by the analysis of 7,470 participants with PAD in the COMPASS trial (136). The combination of rivaroxaban and aspirin reduced incidence of MACE over a median follow up of 21 months versus aspirin alone [5.1% vs 6.9%, HR 0.72 (0.57-0.90); p=0.0047]. Particularly important benefits observed included a lower incidence of major adverse limb events [1% vs 2%, HR 0·63 [95% CI 0.41–0.96], p=0·032], and lower incidence of major amputation [0.30 [0.11–0.80], p=0.011].


Subsequently, the evidence base for low-dose DATT in people PAD has been enhanced by the results of the VOYAGER-PAD trial, which randomized 6564 individuals with PAD treated by revascularization to receive either low-dose DATT or aspirin alone (137). After a median follow-up of 28 months (interquartile range 22-34), the primary composite endpoint of acute limb ischemia, amputation, MI, ischemic stroke or CV death occurred in 17.3% vs. 19.9% (HR 0.85 [0.76-0.96], p=0.009) without a significant increase in the incidence of TIMI major bleeding (2.65% vs. 1.87%, HR 1.43 [0.97-2.10, p=0.07). Forty percent of the trial population had DM with a similar response observed in this group.


It should be noted that DM individuals with symptomatic PAD are likely to have extensive vascular pathology and therefore DATT is likely to offer benefit in more than one vascular bed. Discussion of antithrombotic therapy for those people with DM and asymptomatic PAD is included in the next section.


Preventing First Atherothrombotic Event in Patients with Diabetes and No Symptomatic Atherosclerotic Cardiovascular Disease


It is rational to hypothesize that antithrombotic therapy (ATT) therapy may reduce the chance of a first atherothrombotic event or limit its severity by preventing thrombosis or reducing its impact.  ATT in several distinct groups with DM but without symptomatic ASCVD have been investigated in a number of trials. The largest individual-level meta-analysis was performed in 2009 and included 95,000 participants from 6 trials (138). In individuals with DM, though aspirin led to a 12% proportional reduction in the rate of serious vascular events, this did not reach statistical significance. However, the point estimate was consistent with the statistically significant benefit of aspirin in the non-DM population and the DM population showed an identical trend. Three further trials have been added to the literature since this meta-analysis was performed. Two, JPAD (n=2539) and POPADAD (n=1276) were not adequately powered to draw firm conclusions (139,140). However, most recently ASCEND provided data from 15,480 individuals with DM but without symptomatic ASCVD who were randomized to receive aspirin 100 mg once daily or placebo (141). After a mean follow up of 7.4 years, those randomized to aspirin had a significantly reduced rate of serious vascular events (MI, stroke or TIA, or vascular death excluding intracranial hemorrhage) (RR 0.88 [95 % CI 0.79-0.97], p=0.01). However, major bleeding was significantly more frequent when receiving aspirin (1.24 [1.09-1.52], p=0.003), the majority being gastrointestinal. The investigators concluded that the absolute benefits were largely counterbalanced by the risks, despite a favorable, albeit modest, risk-benefit ratio.


Antiplatelet drugs other than aspirin have not been widely studied for primary prevention in individuals with DM and this remains an area for future research.


CONCLUSIONS


DM leads to a prothrombotic milieu that increases the risk of atherothrombotic and thromboembolic events compared to the non-DM population. Changes in platelets, coagulation, and inflammation appear central to this increased risk. Antithrombotic therapy (ATT) can help treat or prevent thrombotic events but increases bleeding risk. In those with a history of symptomatic ASCVD, long-term antiplatelet therapy (APT) with aspirin or clopidogrel is indicated. Intensification to long-term dual antiplatelet therapy (DAPT) or low-dose dual antithrombotic therapy (DATT) should be considered in those with chronic coronary syndromes (CCS) who have high ischemic risk but not high bleeding risk. Low-dose DATT can also be beneficial to people with symptomatic PAD. Therapeutic levels of oral anticoagulant (OAC) should be considered in all individuals with DM who develop AF. Accurately assessing and balancing a patient’s risk of ischemic and bleeding events is key to making rational treatment recommendations for ATT in DM (Figure 3).


Looking to the future, further work to determine more precisely an individual’s thrombotic and bleeding risk would greatly enhance our ability to make the best treatment recommendations for patients with DM. Whether this is achieved by more complex statistical modelling, novel imaging techniques, and/or better appreciation of circulating biomarkers remains to be determined. This would allow a greater move towards personalized strategies in order to more appropriately balance the benefits and risks of ATT. People with DM often have complex co-morbidities meaning choosing the best regimen is difficult, but is at the same time crucial to ensure an optimal outcome.


Emerging strategies such as early de-escalation of DAPT are encouraging new tools giving more options for subtle adjustment of ATT intensity, but require definitive proof they lead to no significant ischemic penalty and ratification by guideline committees before wider adoption can be recommended. No doubt further clarity will follow in the coming years.


The lack of an ability of ATT to meaningfully improve net clinical outcomes in those with DM without established ASCVD is a source of disappointment and demands future attention. Trials have focused on aspirin but it is clear that people with DM may have a poor response (111). As well as trials exploring novel regimens of aspirin, trials testing P2Y12 inhibitor monotherapy, which may offer pharmacodynamic advantages over aspirin in this group, are warranted (134).


Finally, targeting the pathological abnormalities that cause hypofibrinolysis in diabetes, such as inhibition of PAI-1 activity, may offer an alternative management strategy to further reduce vascular occlusive disease in diabetes, while keeping the risk of bleeding to a minimum.

Figure 3. Principles to consider when deciding on the optimal regimen of antithrombotic therapy in a person with diabetes. ACS, acute coronary syndrome; AF, atrial fibrillation; ASCVD, atherosclerotic cardiovascular disease; CAD, coronary artery disease; CI, contraindication; DAPT, dual antiplatelet therapy; DATT, dual antithrombotic therapy; DM, diabetes mellitus; eGFR, estimated glomerular filtration rate; GI, gastrointestinal; OAC, oral anticoagulation; PAD, peripheral artery disease; PCI, percutaneous coronary intervention.

REFERENCES


  1. Sarwar N, Gao P, Seshasai SR, Gobin R, Kaptoge S, Di Angelantonio E, Ingelsson E, Lawlor DA, Selvin E, Stampfer M, Stehouwer CD, Lewington S, Pennells L, Thompson A, Sattar N, White IR, Ray KK, Danesh J. Diabetes mellitus, fasting blood glucose concentration, and risk of vascular disease: a collaborative meta-analysis of 102 prospective studies. Lancet. 2010;375(9733):2215-2222.
  2. Parker WAE, Gorog DA, Geisler T, Vilahur G, Sibbing D, Rocca B, Storey RF. Prevention of stroke in patients with chronic coronary syndromes or peripheral arterial disease. Eur Heart J Suppl. 2020;22(Supplement_M):M26-M34.
  3. Jackson SP. Arterial thrombosis--insidious, unpredictable and deadly. Nat Med. 2011;17(11):1423-1436.
  4. Konstantinides SV, Meyer G, Becattini C, Bueno H, Geersing G-J, Harjola V-P, Huisman MV, Humbert M, Jennings CS, Jiménez D, Kucher N, Lang IM, Lankeit M, Lorusso R, Mazzolai L, Meneveau N, Ní Áinle F, Prandoni P, Pruszczyk P, Righini M, Torbicki A, Van Belle E, Zamorano JL, ESC Scientific Document Group. 2019 ESC Guidelines for the diagnosis and management of acute pulmonary embolism developed in collaboration with the European Respiratory Society (ERS): The Task Force for the diagnosis and management of acute pulmonary embolism of the European Society of Cardiology (ESC). Eur Heart J. 2020;41(4):543-603.
  5. Gage BF, Waterman AD, Shannon W, Boechler M, Rich MW, Radford MJ. Validation of clinical classification schemes for predicting stroke: results from the National Registry of Atrial Fibrillation. JAMA. 2001;285(22):2864-2870.
  6. Libby P, Buring JE, Badimon L, Hansson GK, Deanfield J, Bittencourt MS, Tokgozoglu L, Lewis EF. Atherosclerosis. Nat Rev Dis Primers. 2019;5(1):56.
  7. Biondi-Zoccai GGL, Abbate A, Liuzzo G, Biasucci LM. Atherothrombosis, inflammation, and diabetes. J Am Coll Cardiol. 2003;41(7):1071-1077.
  8. Patrono C, Morais J, Baigent C, Collet JP, Fitzgerald D, Halvorsen S, Rocca B, Siegbahn A, Storey RF, Vilahur G. Antiplatelet agents for the treatment and prevention of coronary atherothrombosis. J Am Coll Cardiol. 2017;70(14):1760-1776.
  9. Storey RF. The long journey of individualizing antiplatelet therapy after acute coronary syndromes. Eur Heart J. 2020;41:3546-3548.
  10. Bagot CN, Arya R. Virchow and his triad: a question of attribution. Br J Haematol. 2008;143(2):180-190.
  11. Moroi M, Jung SM, Okuma M, Shinmyozu K. A patient with platelets deficient in glycoprotein VI that lack both collagen-induced aggregation and adhesion. J Clin Invest. 1989;84(5):1440-1445.
  12. Santoro SA, Rajpara SM, Staatz WD, Woods VL, Jr. Isolation and characterization of a platelet surface collagen binding complex related to VLA-2. Biochem Biophys Res Commun. 1988;153(1):217-223.
  13. Handa M, Titani K, Holland LZ, Roberts JR, Ruggeri ZM. The von Willebrand factor-binding domain of platelet membrane glycoprotein Ib. Characterization by monoclonal antibodies and partial amino acid sequence analysis of proteolytic fragments. J Biol Chem. 1986;261(27):12579-12585.
  14. Aslan JE, Itakura A, Gertz JM, McCarty OJ. Platelet shape change and spreading. Methods Mol Biol. 2012;788:91-100.
  15. Patrono C. Aspirin as an antiplatelet drug. N Engl J Med. 1994;330(18):1287-1294.
  16. Parker WAE, Orme RC, Hanson J, Stokes HM, Bridge CM, Shaw PA, Sumaya W, Thorneycroft K, Petrucci G, Porro B, Judge HM, Ajjan RA, Rocca B, Storey RF. Very-low-dose twice-daily aspirin maintains platelet inhibition and improves haemostasis during dual-antiplatelet therapy for acute coronary syndrome. Platelets. 2019;30(2):148-157.
  17. Harrison P, Cramer EM. Platelet alpha-granules. Blood Rev. 1993;7:52-62.
  18. Fagura MS, Dainty IA, McKay GD, Kirk IP, Humphries RG, Robertson MJ, Dougall IG, Leff P. P2Y1-receptors in human platelets which are pharmacologically distinct from P2Y(ADP)-receptors. Br J Pharmacol. 1998;124(1):157-164.
  19. Mahaut-Smith MP, Jones S, Evans RJ. The P2X1 receptor and platelet function. Purinergic Signal. 2011;7(3):341-356.
  20. Storey RF, Sanderson HM, White AE, May JA, Cameron KE, Heptinstall S. The central role of the P(2T) receptor in amplification of human platelet activation, aggregation, secretion and procoagulant activity. Br J Haematol. 2000;110(4):925-934.
  21. Pytela R, Pierschbacher MD, Ginsberg MH, Plow EF, Ruoslahti E. Platelet membrane glycoprotein IIb/IIIa: member of a family of Arg-Gly-Asp--specific adhesion receptors. Science. 1986;231(4745):1559-1562.
  22. Parker WAE, Storey RF. Antithrombotic therapy for patients with chronic coronary syndromes. Heart 2021;107:925-933.
  23. Parker WAE, Storey RF. Novel approaches to P2Y12 inhibition and aspirin dosing. Platelets. 2020;32(1):7-14.
  24. Joshi RR, Hossain R, Morton AC, Ecob R, Judge HM, Wales C, Walker JV, Karunakaran A, Storey RF. Evolving pattern of platelet P2Y12 inhibition in patients with acute coronary syndromes. Platelets. 2014;25(6):416-422.
  25. Parker WA, Bhatt DL, Prats J, Day JRS, Steg PG, Stone GW, Hamm CW, Mahaffey KW, Price MJ, Gibson CM, White HD, Storey RF. Characteristics of dyspnoea and associated clinical outcomes in the CHAMPION PHOENIX study. Thromb Haemost. 2017;117(6):1093-1100.
  26. Parker W, Storey R. Pharmacology and Potential Role of Selatogrel, a Subcutaneous Platelet P2Y 12 Receptor Antagonist. Expert Opin Emerg Drugs. 2020;25(1):1-6.
  27. Ajjan R, Grant PJ. Coagulation and atherothrombotic disease. Atherosclerosis. 2006;186(2):240-259.
  28. Renné T, Schmaier AH, Nickel KF, Blombäck M, Maas C. In vivo roles of factor XII. Blood. 2012;120(22):4296-4303.
  29. Mackman N, Tilley RE, Key NS. Role of the extrinsic pathway of blood coagulation in hemostasis and thrombosis. Arterioscler Thromb Vasc Biol. 2007;27(8):1687-1693.
  30. Krishnaswamy S, Jones KC, Mann KG. Prothrombinase complex assembly. Kinetic mechanism of enzyme assembly on phospholipid vesicles. J Biol Chem. 1988;263(8):3823-3834.
  31. Crawley JT, Lane DA. The haemostatic role of tissue factor pathway inhibitor. Arterioscler Thromb Vasc Biol. 2008;28(2):233-242.
  32. Ariens RA, Lai TS, Weisel JW, Greenberg CS, Grant PJ. Role of factor XIII in fibrin clot formation and effects of genetic polymorphisms. Blood. 2002;100(3):743-754.
  33. Verstraete M. The fibrinolytic system: from petri dishes to genetic engineering. Thromb Haemost. 1995;74:25-35.
  34. Hurlen M, Abdelnoor M, Smith P, Erikssen J, Arnesen H. Warfarin, aspirin, or both after myocardial infarction. N Engl J Med. 2002;347(13):969-974.
  35. Yeh CH, Hogg K, Weitz JI. Overview of the new oral anticoagulants: opportunities and challenges. Arterioscler Thromb Vasc Biol. 2015;35(5):1056-1065.
  36. Kahn ML, Nakanishi-Matsui M, Shapiro MJ, Ishihara H, Coughlin SR. Protease-activated receptors 1 and 4 mediate activation of human platelets by thrombin. J Clin Invest. 1999;103(6):879-887.
  37. Monroe DM, Hoffman M, Roberts HR. Platelets and thrombin generation. Arterioscler Thromb Vasc Biol. 2002;22(9):1381-1389.
  38. Mi Y, Yan S, Lu Y, Liang Y, Li C. Venous thromboembolism has the same risk factors as atherosclerosis: A PRISMA-compliant systemic review and meta-analysis. Medicine (Baltimore). 2016;95(32):e4495.
  39. Ibebuogu UN, Nasir K, Gopal A, Ahmadi N, Mao SS, Young E, Honoris L, Nuguri VK, Lee RS, Usman N, Rostami B, Pal R, Flores F, Budoff MJ. Comparison of atherosclerotic plaque burden and composition between diabetic and non diabetic patients by non invasive CT angiography. Int J Cardiovasc Imaging. 2009;25(7):717-723.
  40. Larsen JR, Tsunoda T, Tuzcu EM, Schoenhagen P, Brekke M, Arnesen H, Hanssen KF, Nissen SE, Dahl-Jorgensen K. Intracoronary ultrasound examinations reveal significantly more advanced coronary atherosclerosis in people with type 1 diabetes than in age- and sex-matched non-diabetic controls. Diab Vasc Dis Res. 2007;4(1):62-65.
  41. Lowry D, Saeed M, Narendran P, Tiwari A. A review of distribution of atherosclerosis in the lower limb arteries of patients with diabetes mellitus and peripheral vascular disease. Vasc Endovascular Surg. 2018;52(7):535-542.
  42. Carrizzo A, Izzo C, Oliveti M, Alfano A, Virtuoso N, Capunzo M, Di Pietro P, Calabrese M, De Simone E, Sciarretta S, Frati G, Migliarino S, Damato A, Ambrosio M, De Caro F, Vecchione C. The main determinants of diabetes mellitus vascular complications: endothelial dysfunction and platelet hyperaggregation. Int J Mol Sci. 2018;19(10).
  43. Stentz FB, Umpierrez GE, Cuervo R, Kitabchi AE. Proinflammatory cytokines, markers of cardiovascular risks, oxidative stress, and lipid peroxidation in patients with hyperglycemic crises. Diabetes. 2004;53(8):2079-2086.
  44. Chaudhuri A, Umpierrez GE. Oxidative stress and inflammation in hyperglycemic crises and resolution with insulin: implications for the acute and chronic complications of hyperglycemia. J Diabetes Complications. 2012;26(4):257-258.
  45. Patrono C, Rocca B. Measurement of thromboxane biosynthesis in health and disease. Front Pharmacol. 2019;10:1244.
  46. Soma P, Swanepoel AC, du Plooy JN, Mqoco T, Pretorius E. Flow cytometric analysis of platelets type 2 diabetes mellitus reveals 'angry' platelets. Cardiovasc Diabetol. 2016;15:52.
  47. Watala C, Boncler M, Golański J, Koziołkiewcz W, Trojanowski Z, Walkowiak B. Platelet membrane lipid fluidity and intraplatelet calcium mobilization in type 2 diabetes mellitus. Eur J Haematol. 1998;61(5):319-326.
  48. Gawaz M, Ott I, Reininger AJ, Neumann FJ. Effects of magnesium on platelet aggregation and adhesion. Magnesium modulates surface expression of glycoproteins on platelets in vitro and ex vivo. Thromb Haemost. 1994;72(6):912-918.
  49. Santilli F, Simeone P, Liani R, Davì G. Platelets and diabetes mellitus. Prostaglandins Other Lipid Mediat. 2015;120:28-39.
  50. Hunter RW, Hers I. Insulin/IGF-1 hybrid receptor expression on human platelets: consequences for the effect of insulin on platelet function. J Thromb Haemost. 2009;7(12):2123-2130.
  51. Westein E, Hoefer T, Calkin AC. Thrombosis in diabetes: a shear flow effect? Clin Sci (Lond). 2017;131(12):1245-1260.
  52. Vernstrom L, Funck KL, Grove EL, Laugesen E, Baier JM, Hvas AM, Poulsen PL. Antiplatelet effect of aspirin during 24h in patients with type 2 diabetes without cardiovascular disease. Thromb Res. 2018;161:1-6.
  53. Neergaard-Petersen S, Hvas AM, Ajjan R, Larsen SB, Würtz M, Kristensen SD, Grove EL. Platelet count, platelet turnover and fibrin clot structure in patients with coronary artery disease. Thromb Res. 2014;133(6):1161-1163.
  54. Parker WAE, Storey RF. Aspirin dosing in atherosclerotic cardiovascular disease: should we be more ADAPTABLE? Cardiovasc Res. 2021;117(10):e123-e125.
  55. Fejes Z, Poliska S, Czimmerer Z, Kaplar M, Penyige A, Gal Szabo G, Beke Debreceni I, Kunapuli SP, Kappelmayer J, Nagy B, Jr. Hyperglycaemia suppresses microRNA expression in platelets to increase P2RY12 and SELP levels in type 2 diabetes mellitus. Thromb Haemost. 2017;117(3):529-542.
  56. Pordzik J, Jakubik D, Jarosz-Popek J, Wicik Z, Eyileten C, De Rosa S, Indolfi C, Siller-Matula JM, Czajka P, Postula M. Significance of circulating microRNAs in diabetes mellitus type 2 and platelet reactivity: bioinformatic analysis and review. Cardiovasc Diabetol. 2019;18(1):113.
  57. Alzahrani SH, Ajjan RA. Coagulation and fibrinolysis in diabetes. Diab Vasc Dis Res. 2010;7:260-273.
  58. Kim HK, Kim JE, Park SH, Kim YI, Nam-Goong IS, Kim ES. High coagulation factor levels and low protein C levels contribute to enhanced thrombin generation in patients with diabetes who do not have macrovascular complications. J Diabetes Complications. 2014;28(3):365-369.
  59. Kearney K, Tomlinson D, Smith K, Ajjan R. Hypofibrinolysis in diabetes: a therapeutic target for the reduction of cardiovascular risk. Cardiovasc Diabetol. 2017;16(1):34.
  60. Ajjan RA, Gamlen T, Standeven KF, Mughal S, Hess K, Smith KA, Dunn EJ, Anwar MM, Rabbani N, Thornalley PJ, Philippou H, Grant PJ. Diabetes is associated with posttranslational modifications in plasminogen resulting in reduced plasmin generation and enzyme-specific activity. Blood. 2013;122(1):134-142.
  61. Du XL, Edelstein D, Rossetti L, Fantus IG, Goldberg H, Ziyadeh F, Wu J, Brownlee M. Hyperglycemia-induced mitochondrial superoxide overproduction activates the hexosamine pathway and induces plasminogen activator inhibitor-1 expression by increasing Sp1 glycosylation. Proc Natl Acad Sci U S A. 2000;97(22):12222-12226.
  62. Wang Y, Beck W, Deppisch R, Marshall SM, Hoenich NA, Thompson MG. Advanced glycation end products elicit externalization of phosphatidylserine in a subpopulation of platelets via 5-HT2A/2C receptors. Am J Physiol Cell Physiol. 2007;293(1):C328-336.
  63. Hindricks G, Potpara T, Dagres N, Arbelo E, Bax JJ, Blomström-Lundqvist C, Boriani G, Castella M, Dan G-A, Dilaveris PE, Fauchier L, Filippatos G, Kalman JM, La Meir M, Lane DA, Lebeau J-P, Lettino M, Lip GYH, Pinto FJ, Thomas GN, Valgimigli M, Van Gelder IC, Van Putte BP, Watkins CL, ESC Scientific Document Group. 2020 ESC Guidelines for the diagnosis and management of atrial fibrillation developed in collaboration with the European Association for Cardio-Thoracic Surgery (EACTS): The Task Force for the diagnosis and management of atrial fibrillation of the European Society of Cardiology (ESC) Developed with the special contribution of the European Heart Rhythm Association (EHRA) of the ESC. Eur Heart J. 2021;42(5):373-498.
  64. Pallisgaard JL, Schjerning AM, Lindhardt TB, Procida K, Hansen ML, Torp-Pedersen C, Gislason GH. Risk of atrial fibrillation in diabetes mellitus: A nationwide cohort study. Eur J Prev Cardiol. 2016;23(6):621-627.
  65. Overvad TF, Skjøth F, Lip GY, Lane DA, Albertsen IE, Rasmussen LH, Larsen TB. Duration of diabetes mellitus and risk of thromboembolism and bleeding in atrial fibrillation: nationwide cohort study. Stroke. 2015;46(8):2168-2174.
  66. Dublin S, Glazer NL, Smith NL, Psaty BM, Lumley T, Wiggins KL, Page RL, Heckbert SR. Diabetes mellitus, glycemic control, and risk of atrial fibrillation. J Gen Intern Med. 2010;25(8):853-858.
  67. Anselmino M, Matta M, D'Ascenzo F, Pappone C, Santinelli V, Bunch TJ, Neumann T, Schilling RJ, Hunter RJ, Noelker G, Fiala M, Frontera A, Thomas G, Katritsis D, Jais P, Weerasooriya R, Kalman JM, Gaita F. Catheter ablation of atrial fibrillation in patients with diabetes mellitus: a systematic review and meta-analysis. Europace. 2015;17(10):1518-1525.
  68. Fatemi O, Yuriditsky E, Tsioufis C, Tsachris D, Morgan T, Basile J, Bigger T, Cushman W, Goff D, Soliman EZ, Thomas A, Papademetriou V. Impact of intensive glycemic control on the incidence of atrial fibrillation and associated cardiovascular outcomes in patients with type 2 diabetes mellitus (from the Action to Control Cardiovascular Risk in Diabetes Study). Am J Cardiol. 2014;114(8):1217-1222.
  69. Chang SH, Wu LS, Chiou MJ, Liu JR, Yu KH, Kuo CF, Wen MS, Chen WJ, Yeh YH, See LC. Association of metformin with lower atrial fibrillation risk among patients with type 2 diabetes mellitus: a population-based dynamic cohort and in vitro studies. Cardiovasc Diabetol. 2014;13:123.
  70. Zhang Z, Zhang X, Korantzopoulos P, Letsas KP, Tse G, Gong M, Meng L, Li G, Liu T. Thiazolidinedione use and atrial fibrillation in diabetic patients: a meta-analysis. BMC Cardiovasc Disord. 2017;17(1):96.
  71. Zelniker TA, Bonaca MP, Furtado RHM, Mosenzon O, Kuder JF, Murphy SA, Bhatt DL, Leiter LA, McGuire DK, Wilding JPH, Budaj A, Kiss RG, Padilla F, Gause-Nilsson I, Langkilde AM, Raz I, Sabatine MS, Wiviott SD. Effect of dapagliflozin on atrial fibrillation in patients with type 2 diabetes mellitus. Circulation. 2020;141(15):1227-1234.
  72. Cosentino F, Grant PJ, Aboyans V, Bailey CJ, Ceriello A, Delgado V, Federici M, Filippatos G, Grobbee DE, Hansen TB, Huikuri HV, Johansson I, Juni P, Lettino M, Marx N, Mellbin LG, Ostgren CJ, Rocca B, Roffi M, Sattar N, Seferovic PM, Sousa-Uva M, Valensi P, Wheeler DC. 2019 ESC Guidelines on diabetes, pre-diabetes, and cardiovascular diseases developed in collaboration with the EASD. Eur Heart J. 2020;41(2):255-323.
  73. Lip GY, Nieuwlaat R, Pisters R, Lane DA, Crijns HJ. Refining clinical risk stratification for predicting stroke and thromboembolism in atrial fibrillation using a novel risk factor-based approach: the euro heart survey on atrial fibrillation. Chest. 2010;137(2):263-272.
  74. Lip GYH, Clementy N, Pierre B, Boyer M, Fauchier L. The impact of associated diabetic retinopathy on stroke and severe bleeding risk in diabetic patients with atrial fibrillation: the loire valley atrial fibrillation project. Chest. 2015;147(4):1103-1110.
  75. Patti G, Di Gioia G, Cavallari I, Nenna A. Safety and efficacy of nonvitamin K antagonist oral anticoagulants versus warfarin in diabetic patients with atrial fibrillation: A study-level meta-analysis of phase III randomized trials. Diabetes Metab Res Rev. 2017;33(3).
  76. Olesen JB, Lip GYH, Hansen ML, Hansen PR, Tolstrup JS, Lindhardsen J, Selmer C, Ahlehoff O, Olsen A-MS, Gislason GH, Torp-Pedersen C. Validation of risk stratification schemes for predicting stroke and thromboembolism in patients with atrial fibrillation: nationwide cohort study. BMJ. 2011;342:d124.
  77. January CT, Wann LS, Alpert JS, Calkins H, Cigarroa JE, Cleveland JC, Conti JB, Ellinor PT, Ezekowitz MD, Field ME, Murray KT, Sacco RL, Stevenson WG, Tchou PJ, Tracy CM, Yancy CW. 2014 AHA/ACC/HRS guideline for the management of patients with atrial fibrillation: a report of the American College of Cardiology/American Heart Association Task Force on practice guidelines and the Heart Rhythm Society. J Am Coll Cardiol. 2014;64(21):e1-e76.
  78. Olesen JB, Torp-Pedersen C, Hansen ML, Lip GY. The value of the CHA2DS2-VASc score for refining stroke risk stratification in patients with atrial fibrillation with a CHADS2 score 0-1: a nationwide cohort study. Thromb Haemost. 2012;107(6):1172-1179.
  79. Lip GYH, Keshishian A, Li X, Hamilton M, Masseria C, Gupta K, Luo X, Mardekian J, Friend K, Nadkarni A, Pan X, Baser O, Deitelzweig S. Effectiveness and Safety of Oral Anticoagulants Among Nonvalvular Atrial Fibrillation Patients. Stroke. 2018;49(12):2933-2944.
  80. Sim SY, Morrison A, Gregory R, Kong M. Anticoagulation in hyperosmolar hyperglycaemic state: a case report and review of the literature. Brit J Diabetes. 2021;21(2):250-254.
  81. Dhatariya K, Weston P. The argument against everyone with hyperosmolar hyperglycaemic syndrome being given prophylactic treatment dose anticoagulation. Brit J Diabetes. 2021;21(2):282-283.
  82. Cosentino F, Ceriello A, Baeres FMM, Fioretto P, Garber A, Stough WG, George JT, Grant PJ, Khunti K, Langkilde AM, Plutzky J, Rydén L, Scheen A, Standl E, Tuomilehto J, Zannad F. Addressing cardiovascular risk in type 2 diabetes mellitus: a report from the European Society of Cardiology Cardiovascular Roundtable. Eur Heart J. 2019;40(34):2907-2919.
  83. Collet J-P, Thiele H, Barbato E, Barthélémy O, Bauersachs J, Bhatt DL, Dendale P, Dorobantu M, Edvardsen T, Folliguet T, Gale CP, Gilard M, Jobs A, Jüni P, Lambrinou E, Lewis BS, Mehilli J, Meliga E, Merkely B, Mueller C, Roffi M, Rutten FH, Sibbing D, Siontis GCM, Group ESD. 2020 ESC Guidelines for the management of acute coronary syndromes in patients presenting without persistent ST-segment elevation: The Task Force for the management of acute coronary syndromes in patients presenting without persistent ST-segment elevation of the European Society of Cardiology (ESC). Eur Heart J. 2021;42(14):1289-1367.
  84. Ibanez B, James S, Agewall S, Antunes MJ, Bucciarelli-Ducci C, Bueno H, Caforio ALP, Crea F, Goudevenos JA, Halvorsen S, Hindricks G, Kastrati A, Lenzen MJ, Prescott E, Roffi M, Valgimigli M, Varenhorst C, Vranckx P, Widimský P, Group ESD. 2017 ESC Guidelines for the management of acute myocardial infarction in patients presenting with ST-segment elevation: The Task Force for the management of acute myocardial infarction in patients presenting with ST-segment elevation of the European Society of Cardiology (ESC). Eur Heart J. 2017;39(2):119-177.
  85. ISIS-2 Collaborative Group. Randomised trial of intravenous streptokinase, oral aspirin, both, or neither among 17,187 cases of suspected acute myocardial infarction: ISIS-2. Lancet. 1988;2(8607):349-360.
  86. Rocca B, Santilli F, Pitocco D, Mucci L, Petrucci G, Vitacolonna E, Lattanzio S, Mattoscio D, Zaccardi F, Liani R, Vazzana N, Del Ponte A, Ferrante E, Martini F, Cardillo C, Morosetti R, Mirabella M, Ghirlanda G, Davi G, Patrono C. The recovery of platelet cyclooxygenase activity explains interindividual variability in responsiveness to low-dose aspirin in patients with and without diabetes. J Thromb Haemost. 2012;10(7):1220-1230.
  87. Capodanno D, Patel A, Dharmashankar K, Ferreiro JL, Ueno M, Kodali M, Tomasello SD, Capranzano P, Seecheran N, Darlington A, Tello-Montoliu A, Desai B, Bass TA, Angiolillo DJ. Pharmacodynamic effects of different aspirin dosing regimens in type 2 diabetes mellitus patients with coronary artery disease. Circ Cardiovasc Interv. 2011;4:180-187.
  88. Spectre G, Arnetz L, Ostenson CG, Brismar K, Li N, Hjemdahl P. Twice daily dosing of aspirin improves platelet inhibition in whole blood in patients with type 2 diabetes mellitus and micro- or macrovascular complications. Thromb Haemost. 2011;106(3):491-499.
  89. Wiviott SD, Braunwald E, Angiolillo DJ, Meisel S, Dalby AJ, Verheugt FW, Goodman SG, Corbalan R, Purdy DA, Murphy SA, McCabe CH, Antman EM, for the TRITON-TIMI Investigators. Greater clinical benefit of more intensive oral antiplatelet therapy with prasugrel in patients with diabetes mellitus in the trial to assess improvement in therapeutic outcomes by optimizing platelet inhibition with prasugrel-thrombolysis in myocardial infarction 38. Circulation. 2008;118:1626-1636.
  90. Franchi F, James SK, Ghukasyan Lakic T, Budaj AJ, Cornel JH, Katus HA, Keltai M, Kontny F, Lewis BS, Storey RF, Himmelmann A, Wallentin L, Angiolillo DJ. impact of diabetes mellitus and chronic kidney disease on cardiovascular outcomes and platelet P2Y(12) receptor antagonist effects in patients with acute coronary syndromes: insights from the PLATO trial. J Am Heart Assoc. 2019;8(6):e011139.
  91. Yusuf S, Zhao F, Mehta S, Chrolavicius S, Tognoni G, Fox K. Effects of clopidogrel in addition to aspirin in patients with acute coronary syndromes without ST-segment elevation. New Eng J Med. 2001;345:494-502.
  92. Sabatine MS, Cannon CP, Gibson CM, Lopez-Sendon JL, Montalescot G, Theroux P, Claeys MJ, Cools F, Hill KA, Skene AM, McCabe CH, Braunwald E. Addition of clopidogrel to aspirin and fibrinolytic therapy for myocardial infarction with ST-segment elevation. N Engl J Med. 2005;352(12):1179-1189.
  93. Chen ZM, Jiang LX, Chen YP, Xie JX, Pan HC, Peto R, Collins R, Liu LS, COMMIT (ClOpidogrel and Metoprolol in Myocardial Infarction Trial) collaborative group. Addition of clopidogrel to aspirin in 45 852 patients with acute myocardial infarction: randomised placebo-controlled trial. Lancet. 2005;366(9497):1607-1621.
  94. Wiviott S, Braunwald E, McCabe C, Montalescot G, Ruzyllo W, Gottlieb S, Neumann F-J, Ardissino D, De Servi S, Murphy S, Riesmeyer J, Weerakkody G, Gibson C, Antman E. Prasugrel versus clopidogrel in patients with acute coronary syndromes. New Eng J Med. 2007;357:2001-2015.
  95. Roe MT, Armstrong PW, Fox KA, White HD, Prabhakaran D, Goodman SG, Cornel JH, Bhatt DL, Clemmensen P, Martinez F, Ardissino D, Nicolau JC, Boden WE, Gurbel PA, Ruzyllo W, Dalby AJ, McGuire DK, Leiva-Pons JL, Parkhomenko A, Gottlieb S, Topacio GO, Hamm C, Pavlides G, Goudev AR, Oto A, Tseng CD, Merkely B, Gasparovic V, Corbalan R, Cinteza M, McLendon RC, Winters KJ, Brown EB, Lokhnygina Y, Aylward PE, Huber K, Hochman JS, Ohman EM. Prasugrel versus clopidogrel for acute coronary syndromes without revascularization. N Engl J Med. 2012;367(14):1297-1309.
  96. Wallentin L, Becker RC, Budaj A, Cannon CP, Emanuelsson H, Held C, Horrow J, Husted S, James S, Katus H, Mahaffey KW, Scirica BM, Skene A, Steg PG, Storey RF, Harrington RA. Ticagrelor versus clopidogrel in patients with acute coronary syndromes. N Engl J Med. 2009;361(11):1045-1057.
  97. Schupke S, Neumann FJ, Menichelli M, Mayer K, Bernlochner I, Wohrle J, Richardt G, Liebetrau C, Witzenbichler B, Antoniucci D, Akin I, Bott-Flugel L, Fischer M, Landmesser U, Katus HA, Sibbing D, Seyfarth M, Janisch M, Boncompagni D, Hilz R, Rottbauer W, Okrojek R, Mollmann H, Hochholzer W, Migliorini A, Cassese S, Mollo P, Xhepa E, Kufner S, Strehle A, Leggewie S, Allali A, Ndrepepa G, Schuhlen H, Angiolillo DJ, Hamm CW, Hapfelmeier A, Tolg R, Trenk D, Schunkert H, Laugwitz KL, Kastrati A. Ticagrelor or prasugrel in patients with acute coronary syndromes. N Engl J Med. 2019;381(16):1524-1534.
  98. Storey RF. Ticagrelor versus prasugrel for PCI-managed myocardial infarction: the battle of the giants continues. Heart. 2021;107(14):1111.
  99. Ndrepepa G, Kastrati A, Menichelli M, Neumann F-J, Wöhrle J, Bernlochner I, Richardt G, Witzenbichler B, Sibbing D, Gewalt S, Angiolillo Dominick J, Hamm Christian W, Hapfelmeier A, Trenk D, Laugwitz K-L, Schunkert H, Schüpke S, Mayer K. Ticagrelor or prasugrel in patients with acute coronary syndromes and diabetes mellitus. JACC: Cardiovasc Intervent. 2020;13(19):2238-2247.
  100. Mehran R, Baber U, Sharma SK, Cohen DJ, Angiolillo DJ, Briguori C, Cha JY, Collier T, Dangas G, Dudek D, Dzavik V, Escaned J, Gil R, Gurbel P, Hamm CW, Henry T, Huber K, Kastrati A, Kaul U, Kornowski R, Krucoff M, Kunadian V, Marx SO, Mehta SR, Moliterno D, Ohman EM, Oldroyd K, Sardella G, Sartori S, Shlofmitz R, Steg PG, Weisz G, Witzenbichler B, Han YL, Pocock S, Gibson CM. Ticagrelor with or without aspirin in high-risk patients after PCI. N Engl J Med. 2019;381(21):2032-2042.
  101. Vranckx P, Valgimigli M, Juni P, Hamm C, Steg PG, Heg D, van Es GA, McFadden EP, Onuma Y, van Meijeren C, Chichareon P, Benit E, Mollmann H, Janssens L, Ferrario M, Moschovitis A, Zurakowski A, Dominici M, Van Geuns RJ, Huber K, Slagboom T, Serruys PW, Windecker S. Ticagrelor plus aspirin for 1 month, followed by ticagrelor monotherapy for 23 months vs aspirin plus clopidogrel or ticagrelor for 12 months, followed by aspirin monotherapy for 12 months after implantation of a drug-eluting stent: a multicentre, open-label, randomised superiority trial. Lancet. 2018;392(10151):940-949.
  102. Chichareon P, Modolo R, Kogame N, Takahashi K, Chang CC, Tomaniak M, Botelho R, Eeckhout E, Hofma S, Trendafilova-Lazarova D, Kőszegi Z, Iñiguez A, Wykrzykowska JJ, Piek JJ, Garg S, Hamm C, Steg PG, Jüni P, Vranckx P, Valgimigli M, Windecker S, Onuma Y, Serruys PW. Association of diabetes with outcomes in patients undergoing contemporary percutaneous coronary intervention: Pre-specified subgroup analysis from the randomized GLOBAL LEADERS study. Atherosclerosis. 2020;295:45-53.
  103. Bhalla A, Patel M, Birns J. An update on hyper-acute management of ischaemic stroke. Clin Med (Lond). 2021;21(3):215-221.
  104. Capodanno D, Alberts M, Angiolillo DJ. Antithrombotic therapy for secondary prevention of atherothrombotic events in cerebrovascular disease. Nat Rev Cardiol. 2016;13(10):609-622.
  105. Powers WJ, Rabinstein AA, Ackerson T, Adeoye OM, Bambakidis NC, Becker K, Biller J, Brown M, Demaerschalk BM, Hoh B, Jauch EC, Kidwell CS, Leslie-Mazwi TM, Ovbiagele B, Scott PA, Sheth KN, Southerland AM, Summers DV, Tirschwell DL, null n. Guidelines for the early management of patients with acute ischemic Stroke: 2019 update to the 2018 guidelines for the early management of acute ischemic stroke: a guideline for healthcare professionals from the American Heart Association/American Stroke Association. Stroke. 2019;50(12):e344-e418.
  106. Wang Y, Wang Y, Zhao X, Liu L, Wang D, Wang C, Wang C, Li H, Meng X, Cui L, Jia J, Dong Q, Xu A, Zeng J, Li Y, Wang Z, Xia H, Johnston SC. Clopidogrel with aspirin in acute minor stroke or transient ischemic attack. New Eng J Med. 2013;369(1):11-19.
  107. Johnston SC, Easton JD, Farrant M, Barsan W, Conwit RA, Elm JJ, Kim AS, Lindblad AS, Palesch YY. Clopidogrel and aspirin in acute ischemic stroke and high-risk TIA. N Engl J Med. 2018;379(3):215-225.
  108. Johnston SC, Amarenco P, Albers GW, Denison H, Easton JD, Evans SR, Held P, Jonasson J, Minematsu K, Molina CA, Wang Y, Wong KS. Ticagrelor versus aspirin in acute stroke or transient ischemic attack. N Engl J Med. 2016;375(1):35-43.
  109. Johnston SC, Amarenco P, Denison H, Evans SR, Himmelmann A, James S, Knutsson M, Ladenvall P, Molina CA, Wang Y. Ticagrelor and aspirin or aspirin alone in acute ischemic stroke or tia. New Eng J Med. 2020;383(3):207-217.
  110. Antiplatelet Trialists' Collaboration. Collaborative meta-analysis of randomised trials of antiplatelet therapy for prevention of death, myocardial infarction, and stroke in high risk patients. BMJ. 2002;324(7329):71-86.
  111. Parker WAE, Sagar R, Kurdee Z, Hawkins F, Naseem KM, Grant PJ, Storey RF, Ajjan RA. A randomised controlled trial to assess the antithrombotic effects of aspirin in type 1 diabetes: role of dosing and glycaemic control. Cardiovasc Diabetol. 2021;20(1):238.
  112. CURRENT-OASIS 7 Investigators, Mehta S, Bassand J, Chrolavicius S, Diaz R, Eikelboom J, Fox K, Granger C, Jolly S, Joyner C, Rupprecht H, Widimsky P, Afzal R, Pogue J, Yusuf S. Dose comparisons of clopidogrel and aspirin in acute coronary syndromes. New Eng J Med. 2010;363(10):930-942.
  113. Jones WS, Mulder H, Wruck LM, Pencina MJ, Kripalani S, Muñoz D, Crenshaw DL, Effron MB, Re RN, Gupta K, Anderson RD, Pepine CJ, Handberg EM, Manning BR, Jain SK, Girotra S, Riley D, DeWalt DA, Whittle J, Goldberg YH, Roger VL, Hess R, Benziger CP, Farrehi P, Zhou L, Ford DE, Haynes K, VanWormer JJ, Knowlton KU, Kraschnewski JL, Polonsky TS, Fintel DJ, Ahmad FS, McClay JC, Campbell JR, Bell DS, Fonarow GC, Bradley SM, Paranjape A, Roe MT, Robertson HR, Curtis LH, Sharlow AG, Berdan LG, Hammill BG, Harris DF, Qualls LG, Marquis-Gravel G, Modrow MF, Marcus GM, Carton TW, Nauman E, Waitman LR, Kho AM, Shenkman EA, McTigue KM, Kaushal R, Masoudi FA, Antman EM, Davidson DR, Edgley K, Merritt JG, Brown LS, Zemon DN, McCormick TE, 3rd, Alikhaani JD, Gregoire KC, Rothman RL, Harrington RA, Hernandez AF. Comparative effectiveness of aspirin dosing in cardiovascular disease. N Engl J Med. 2021;384(21):1981-1990.
  114. CAPRIE Steering Committee. A randomised, blinded, trial of clopidogrel versus aspirin in patients at risk of ischaemic events (CAPRIE). Lancet. 1996;348(9038):1329-1339.
  115. Bhatt DL, Fox KAA, Hacke W, Berger PB, Black HR, Boden WE, Cacoub P, Cohen EA, Creager MA, Easton JD, Flather MD, Haffner SM, Hamm CW, Hankey GJ, Johnston SC, Mak K-H, Mas J-L, Montalescot G, Pearson TA, Steg PG, Steinhubl SR, Weber MA, Brennan DM, Fabry-Ribaudo L, Booth J, Topol EJ, the CI. Clopidogrel and aspirin versus aspirin alone for the prevention of atherothrombotic events. New Eng J Med. 2006;354(16):1706-1717.
  116. Bhatt DL, Flather MD, Hacke W, Berger PB, Black HR, Boden WE, Cacoub P, Cohen EA, Creager MA, Easton JD, Hamm CW, Hankey GJ, Johnston SC, Mak KH, Mas JL, Montalescot G, Pearson TA, Steg PG, Steinhubl SR, Weber MA, Fabry-Ribaudo L, Hu T, Topol EJ, Fox KA. Patients with prior myocardial infarction, stroke, or symptomatic peripheral arterial disease in the CHARISMA trial. J Am Coll Cardiol. 2007;49(19):1982-1988.
  117. Mauri L, Elmariah S, Yeh RW, Cutlip DE, Steg PG, Windecker S, Wiviott SD, Cohen DJ, Massaro JM, D'Agostino RB, Sr., Braunwald E, Kereiakes DJ. Causes of late mortality with dual antiplatelet therapy after coronary stents. Eur Heart J. 2016;37(4):378-385.
  118. Bonaca MP, Bhatt DL, Cohen M, Steg PG, Storey RF, Jensen EC, Magnani G, Bansilal S, Fish MP, Im K, Bengtsson O, Ophuis TO, Budaj A, Theroux P, Ruda M, Hamm C, Goto S, Spinar J, Nicolau JC, Kiss RG, Murphy SA, Wiviott SD, Held P, Braunwald E, Sabatine MS. Long-term use of ticagrelor in patients with prior myocardial infarction. New Engl J Med. 2015;372:1791-1800.
  119. Bhatt DL, Bonaca MP, Bansilal S, Angiolillo DJ, Cohen M, Storey RF, Im K, Murphy SA, Held P, Braunwald E, Sabatine MS, Steg PG. Reduction in ischemic events with ticagrelor in diabetic patients: from the PEGASUS-TIMI 54 trial. J Am Coll Cardiol. 2016;67:2732-2740.
  120. Magnani G, Ardissino D, Im K, Budaj A, Storey RF, Steg PG, Bhatt DL, Cohen M, Oude Ophius T, Goudev A, Parkhomenko A, Kamensky G, Angiolillo DJ, López-Sendón J, Johanson P, Braunwald E, Sabatine MS, Bonaca MP. Predictors, type, and impact of bleeding on the net clinical benefit of long-term ticagrelor in stable patients with prior myocardial infarction. J Am Heart Assoc. 2021;10(4):e017008.
  121. Steg PG, Bhatt DL, Simon T, Fox K, Mehta SR, Harrington RA, Held C, Andersson M, Himmelmann A, Ridderstrale W, Leonsson-Zachrisson M, Liu Y, Opolski G, Zateyshchikov D, Ge J, Nicolau JC, Corbalan R, Cornel JH, Widimsky P, Leiter LA. Ticagrelor in Patients with Stable Coronary Disease and Diabetes. N Engl J Med. 2019;381(14):1309-1320.
  122. Bhatt DL, Steg PG, Mehta SR, Leiter LA, Simon T, Fox K, Held C, Andersson M, Himmelmann A, Ridderstrale W, Chen J, Song Y, Diaz R, Goto S, James SK, Ray KK, Parkhomenko AN, Kosiborod MN, McGuire DK, Harrington RA. Ticagrelor in patients with diabetes and stable coronary artery disease with a history of previous percutaneous coronary intervention (THEMIS-PCI): a phase 3, placebo-controlled, randomised trial. Lancet. 2019;394(10204):1169-1180.
  123. Lackey LG, Garnett CE, Senatore F. Applying decision analysis to inform the US Food and Drug Administration’s benefit–risk assessment of ticagrelor for primary prevention of myocardial infarction or stroke based on THEMIS. Circulation. 2021;144(8):655-658.
  124. Eikelboom JW, Connolly SJ, Bosch J, Dagenais GR, Hart RG, Shestakovska O, Diaz R, Alings M, Lonn EM, Anand SS, Widimsky P, Hori M, Avezum A, Piegas LS, Branch KRH, Probstfield J, Bhatt DL, Zhu J, Liang Y, Maggioni AP, Lopez-Jaramillo P, O'Donnell M, Kakkar AK, Fox KAA, Parkhomenko AN, Ertl G, Stork S, Keltai M, Ryden L, Pogosova N, Dans AL, Lanas F, Commerford PJ, Torp-Pedersen C, Guzik TJ, Verhamme PB, Vinereanu D, Kim JH, Tonkin AM, Lewis BS, Felix C, Yusoff K, Steg PG, Metsarinne KP, Cook Bruns N, Misselwitz F, Chen E, Leong D, Yusuf S. Rivaroxaban with or without aspirin in stable cardiovascular disease. N Engl J Med. 2017;377(14):1319-1330.
  125. Knuuti J, Wijns W, Saraste A, Capodanno D, Barbato E, Funck-Brentano C, Prescott E, Storey RF, Deaton C, Cuisset T, Agewall S, Dickstein K, Edvardsen T, Escaned J, Gersh BJ, Svitil P, Gilard M, Hasdai D, Hatala R, Mahfoud F, Masip J, Muneretto C, Valgimigli M, Achenbach S, Bax JJ. 2019 ESC Guidelines for the diagnosis and management of chronic coronary syndromes. Eur Heart J. 2020;41(3):407-477.
  126. Antithrombotic Trialists' Collaboration. Collaborative meta-analysis of randomised trials of antiplatelet therapy for prevention of death, myocardial infarction, and stroke in high risk patients. BMJ. 2002;324(7329):71-86.
  127. Halkes PH, van Gijn J, Kappelle LJ, Koudstaal PJ, Algra A. Aspirin plus dipyridamole versus aspirin alone after cerebral ischaemia of arterial origin (ESPRIT): randomised controlled trial. Lancet. 2006;367(9523):1665-1673.
  128. Pan Y, Elm JJ, Li H, Easton JD, Wang Y, Farrant M, Meng X, Kim AS, Zhao X, Meurer WJ, Liu L, Dietrich D, Johnston SC. Outcomes associated with clopidogrel-aspirin use in minor stroke or transient ischemic attack: a pooled analysis of Clopidogrel in High-risk patients with Acute Non-disabling Cerebrovascular Events (CHANCE) and Platelet-Oriented Inhibition in New TIA and minor ischemic stroke (POINT) trials. JAMA Neurol. 2019;76(12):1466-1473.
  129. Johnston SC, Amarenco P, Denison H, Evans SR, Himmelmann A, James S, Knutsson M, Ladenvall P, Molina CA, Wang Y. The acute stroke or transient ischemic attack treated with ticagrelor and aspirin for prevention of stroke and death (THALES) trial: rationale and design. Int J Stroke. 2019:1747493019830307.
  130. Benavente OR, Hart RG, McClure LA, Szychowski JM, Coffey CS, Pearce LA. Effects of clopidogrel added to aspirin in patients with recent lacunar stroke. N Engl J Med. 2012;367(9):817-825.
  131. Greving JP, Diener HC, Reitsma JB, Bath PM, Csiba L, Hacke W, Kappelle LJ, Koudstaal PJ, Leys D, Mas JL, Sacco RL, Algra A. Antiplatelet Therapy After Noncardioembolic Stroke. Stroke. 2019;50(7):1812-1818.
  132. Aboyans V, Ricco JB, Bartelink MEL, Bjorck M, Brodmann M, Cohnert T, Collet JP, Czerny M, De Carlo M, Debus S, Espinola-Klein C, Kahan T, Kownator S, Mazzolai L, Naylor AR, Roffi M, Rother J, Sprynger M, Tendera M, Tepe G, Venermo M, Vlachopoulos C, Desormais I. 2017 ESC Guidelines on the Diagnosis and Treatment of Peripheral Arterial Diseases, in collaboration with the European Society for Vascular Surgery (ESVS): Document covering atherosclerotic disease of extracranial carotid and vertebral, mesenteric, renal, upper and lower extremity arteriesEndorsed by: the European Stroke Organization (ESO)The Task Force for the Diagnosis and Treatment of Peripheral Arterial Diseases of the European Society of Cardiology (ESC) and of the European Society for Vascular Surgery (ESVS). Eur Heart J. 2018;39(9):763-816.
  133. Hiatt WR, Fowkes FG, Heizer G, Berger JS, Baumgartner I, Held P, Katona BG, Mahaffey KW, Norgren L, Jones WS, Blomster J, Millegård M, Reist C, Patel MR. Ticagrelor versus clopidogrel in symptomatic peripheral artery disease. N Engl J Med. 2017;376:32-40.
  134. Parker WAE, Schulte C, Barwari T, Phoenix F, Pearson SM, Mayr M, Grant PJ, Storey RF, Ajjan RA. Aspirin, clopidogrel and prasugrel monotherapy in patients with type 2 diabetes mellitus: a double-blind randomised controlled trial of the effects on thrombotic markers and microRNA levels. Cardiovasc Diabetol. 2020;19(1):3.
  135. Cacoub PP, Bhatt DL, Steg PG, Topol EJ, Creager MA. Patients with peripheral arterial disease in the CHARISMA trial. Eur Heart J. 2009;30(2):192-201.
  136. Anand SS, Bosch J, Eikelboom JW, Connolly SJ, Diaz R, Widimsky P, Aboyans V, Alings M, Kakkar AK, Keltai K, Maggioni AP, Lewis BS, Stork S, Zhu J, Lopez-Jaramillo P, O'Donnell M, Commerford PJ, Vinereanu D, Pogosova N, Ryden L, Fox KAA, Bhatt DL, Misselwitz F, Varigos JD, Vanassche T, Avezum AA, Chen E, Branch K, Leong DP, Bangdiwala SI, Hart RG, Yusuf S. Rivaroxaban with or without aspirin in patients with stable peripheral or carotid artery disease: an international, randomised, double-blind, placebo-controlled trial. Lancet. 2018;391(10117):219-229.
  137. Bonaca MP, Bauersachs RM, Anand SS, Debus ES, Nehler MR, Patel MR, Fanelli F, Capell WH, Diao L, Jaeger N, Hess CN, Pap AF, Kittelson JM, Gudz I, Mátyás L, Krievins DK, Diaz R, Brodmann M, Muehlhofer E, Haskell LP, Berkowitz SD, Hiatt WR. Rivaroxaban in peripheral artery disease after revascularization. New Eng J Med. 2020;382(21):1994-2004.
  138. Baigent C, Blackwell L, Collins R, Emberson J, Godwin J, Peto R, Buring J, Hennekens C, Kearney P, Meade T, Patrono C, Roncaglioni MC, Zanchetti A. Aspirin in the primary and secondary prevention of vascular disease: collaborative meta-analysis of individual participant data from randomised trials. Lancet. 2009;373(9678):1849-1860.
  139. Belch J, MacCuish A, Campbell I, Cobbe S, Taylor R, Prescott R, Lee R, Bancroft J, MacEwan S, Shepherd J, Macfarlane P, Morris A, Jung R, Kelly C, Connacher A, Peden N, Jamieson A, Matthews D, Leese G, McKnight J, O’Brien I, Semple C, Petrie J, Gordon D, Pringle S, MacWalter R. The prevention of progression of arterial disease and diabetes (POPADAD) trial: factorial randomised placebo controlled trial of aspirin and antioxidants in patients with diabetes and asymptomatic peripheral arterial disease. BMJ. 2008;337.
  140. Ogawa H, Nakayama M, Morimoto T, Uemura S, Kanauchi M, Doi N, Jinnouchi H, Sugiyama S, Saito Y. Low-dose aspirin for primary prevention of atherosclerotic events in patients with type 2 diabetes: a randomized controlled trial. JAMA. 2008;300(18):2134-2141.
  141. Bowman L, Mafham M, Wallendszus K, Stevens W, Buck G, Barton J, Murphy K, Aung T, Haynes R, Cox J, Murawska A, Young A, Lay M, Chen F, Sammons E, Waters E, Adler A, Bodansky J, Farmer A, McPherson R, Neil A, Simpson D, Peto R, Baigent C, Collins R, Parish S, Armitage J. Effects of aspirin for primary prevention in persons with diabetes mellitus. N Engl J Med. 2018;379(16):1529-1539.

Multiple Endocrine Neoplasia Type 4

ABSTRACT


Multiple Endocrine Neoplasia Type 4 (MEN4) (OMIM #610755) has many similarities with MEN1, but is caused by germline mutations in CDKN1B. MEN4 is less common than MEN1. Clinical manifestations of MEN4 encompass: primary hyperparathyroidism, pituitary adenomas. and gastroenteropancreatic neuroendocrine neoplasms. In line with MEN1 other neoplasms may occur.


INTRODUCTION


Multiple Endocrine Neoplasia Type 4 (MEN4) (OMIM #610755) was initially named MENX and was first described in rats (1-3). MEN4 is caused by germline mutations in CDKN1B (Cdkn1b in rats), a tumor suppression gene encoding for the protein p27Kip1 (commonly referred to as p27 or as KIP1). The CDKN1B gene is located on chromosome 12p13.1 (4). p27 is a member of the cyclin-dependent kinase inhibitor (CDKI) family which regulates the cell cycle (5, 6). Germline mutations in CDKN1B lead to reduced expression of p27, thereby resulting in uncontrolled cell cycle progression. To date, most of the reported human mutations were missense. These mutations were deemed pathogenic due to their in vivo or in vitro effects on the function of p27. In humans, two CDKI families were identified: the INK4a/ARF and Cip/Kip family (7). Natalia Pellegata and colleagues reported in 2006 a three-generation family with apparently MEN1-related tumors, but turned out to become the first reported cases of MEN4 in humans (2). The incidence of CDKN1B mutations in patients with a MEN1-related phenotype is likely to be in the range of 1-4% (8-10). MEN4 screening is recommended for all patients with a MEN1-related phenotype without the presence of a MEN1 gene mutation. All first-degree relatives of patients with MEN4 should be offered genetic testing (11-13).


CLINICAL FEATURES OF MEN4


Primary Hyperparathyroidism


Primary hyperparathyroidism has been reported in up to 80%-90% of cases with MEN4 (3). The indications for parathyroid surgery in MEN4 are the same as for MEN1 and the approach in MEN4-related primary hyperparathyroidism may be similar to that in MEN1 (14, 15). It is suggested that screening for hyperparathyroidism with serum calcium measurements (and parathyroid hormone levels (PTH) if indicated) should start at the age of 15 years in MEN4 mutation carriers (16, 17).


Pituitary Adenomas


Pituitary involvement in MEN4 is the second most common manifestation of the disease, affecting approximately 1/3 of the reported cases to date. The types of pituitary disorders in MEN4 include: nonfunctional pituitary adenoma, acromegaly and gigantism, prolactinoma, or Cushing’s disease (13, 18-27). Pituitary tumors in MEN4 generally present with less aggressiveness and smaller size compared to those in MEN1 (21). The management of pituitary tumors in MEN4 is similar to other sporadic or familial cases (14). Routine surveillance for the development of pituitary tumors in patients with MEN4 should be performed on a case-by-case basis and following the current guidelines for MEN1 (14, 17).


Gastroenteropancreatic Neuroendocrine Neoplasms (GEP NENs)


The prevalence of GEP NENs in MEN4 is approximately 25%. These include gastroduodenal or pancreatic NENs (panNENs), which are either nonfunctioning or secreting several peptides and hormones, including gastrin, insulin, adrenocorticotropic hormone (ACTH), or vasoactive intestinal polypeptide (VIP) (10, 15, 18, 28, 29). It appears that there is a decreased penetrance of gastroduodenal NENs or panNENs in MEN4 as compared to MEN1. The clinical syndromes associated with these hormonal overproductions can be found elsewhere (30-33). The diagnosis and management of panNENs in MEN4 is similar to that in MEN1 (14). Screening for gastroduodenal NENs and panNENs should be initiated according to MEN1 screening protocols (14).


Other Neoplasms


Cervical neuroendocrine carcinoma (NEC), secreting and non-secreting adrenal tumors, testicular cancer, breast cancer, papillary thyroid cancer, colon cancer, carcinoid, and meningioma have been reported in MEN4 cases (2, 8, 10, 12, 16, 27).


REFERENCES


  1. Fritz A, Walch A, Piotrowska K, Rosemann M, Schäffer E, Weber K, et al. Recessive transmission of a multiple endocrine neoplasia syndrome in the rat. Cancer Res. 2002;62(11):3048-51.
  2. Pellegata NS, Quintanilla-Martinez L, Siggelkow H, Samson E, Bink K, Höfler H, et al. Germ-line mutations in p27Kip1 cause a multiple endocrine neoplasia syndrome in rats and humans. Proc Natl Acad Sci U S A. 2006;103(42):15558-63.
  3. Lee M, Pellegata NS. Multiple endocrine neoplasia type 4. Front Horm Res. 2013;41:63-78.
  4. Philipp-Staheli J, Payne SR, Kemp CJ. p27(Kip1): regulation and function of a haploinsufficient tumor suppressor and its misregulation in cancer. Exp Cell Res. 2001;264(1):148-68.
  5. Hengst L, Reed SI. Translational control of p27Kip1 accumulation during the cell cycle. Science. 1996;271(5257):1861-4.
  6. Polyak K, Lee MH, Erdjument-Bromage H, Koff A, Roberts JM, Tempst P, et al. Cloning of p27Kip1, a cyclin-dependent kinase inhibitor and a potential mediator of extracellular antimitogenic signals. Cell. 1994;78(1):59-66.
  7. Sherr CJ, Roberts JM. CDK inhibitors: positive and negative regulators of G1-phase progression. Genes Dev. 1999;13(12):1501-12.
  8. Georgitsi M, Raitila A, Karhu A, van der Luijt RB, Aalfs CM, Sane T, et al. Germline CDKN1B/p27Kip1 mutation in multiple endocrine neoplasia. J Clin Endocrinol Metab. 2007;92(8):3321-5.
  9. Molatore S, Marinoni I, Lee M, Pulz E, Ambrosio MR, degli Uberti EC, et al. A novel germline CDKN1B mutation causing multiple endocrine tumors: clinical, genetic and functional characterization. Hum Mutat. 2010;31(11):E1825-35.
  10. Agarwal SK, Mateo CM, Marx SJ. Rare germline mutations in cyclin-dependent kinase inhibitor genes in multiple endocrine neoplasia type 1 and related states. J Clin Endocrinol Metab. 2009;94(5):1826-34.
  11. de Laat JM, van der Luijt RB, Pieterman CR, Oostveen MP, Hermus AR, Dekkers OM, et al. MEN1 redefined, a clinical comparison of mutation-positive and mutation-negative patients. BMC Med. 2016;14(1):182.
  12. Alrezk R, Hannah-Shmouni F, Stratakis CA. MEN4 and CDKN1B mutations: the latest of the MEN syndromes. Endocr Relat Cancer. 2017;24(10):T195-t208.
  13. Schernthaner-Reiter MH, Trivellin G, Stratakis CA. MEN1, MEN4, and Carney Complex: Pathology and Molecular Genetics. Neuroendocrinology. 2016;103(1):18-31.
  14. Pieterman CRC, van Leeuwaarde RS, van den Broek MFM, van Nesselrooij BPM, Valk GD. Multiple Endocrine Neoplasia Type 1. In: Feingold KR, Anawalt B, Boyce A, Chrousos G, de Herder WW, Dhatariya K, et al., editors. Endotext. South Dartmouth (MA): MDText.com, Inc. Copyright © 2000-2022, MDText.com, Inc.; 2021.
  15. Tonelli F, Giudici F, Giusti F, Marini F, Cianferotti L, Nesi G, et al. A heterozygous frameshift mutation in exon 1 of CDKN1B gene in a patient affected by MEN4 syndrome. Eur J Endocrinol. 2014;171(2):K7-k17.
  16. Frederiksen A, Rossing M, Hermann P, Ejersted C, Thakker RV, Frost M. Clinical Features of Multiple Endocrine Neoplasia Type 4: Novel Pathogenic Variant and Review of Published Cases. J Clin Endocrinol Metab. 2019;104(9):3637-46.
  17. Thakker RV. Multiple endocrine neoplasia type 1 (MEN1) and type 4 (MEN4). Mol Cell Endocrinol. 2014;386(1-2):2-15.
  18. Occhi G, Regazzo D, Trivellin G, Boaretto F, Ciato D, Bobisse S, et al. A novel mutation in the upstream open reading frame of the CDKN1B gene causes a MEN4 phenotype. PLoS Genet. 2013;9(3):e1003350.
  19. Crona J, Gustavsson T, Norlén O, Edfeldt K, Åkerström T, Westin G, et al. Somatic Mutations and Genetic Heterogeneity at the CDKN1B Locus in Small Intestinal Neuroendocrine Tumors. Ann Surg Oncol. 2015;22 Suppl 3:S1428-35.
  20. Sambugaro S, Di Ruvo M, Ambrosio MR, Pellegata NS, Bellio M, Guerra A, et al. Early onset acromegaly associated with a novel deletion in CDKN1B 5'UTR region. Endocrine. 2015;49(1):58-64.
  21. Stratakis CA, Tichomirowa MA, Boikos S, Azevedo MF, Lodish M, Martari M, et al. The role of germline AIP, MEN1, PRKAR1A, CDKN1B and CDKN2C mutations in causing pituitary adenomas in a large cohort of children, adolescents, and patients with genetic syndromes. Clin Genet. 2010;78(5):457-63.
  22. Ikeda H, Yoshimoto T, Shida N. Molecular analysis of p21 and p27 genes in human pituitary adenomas. Br J Cancer. 1997;76(9):1119-23.
  23. Dahia PL, Aguiar RC, Honegger J, Fahlbush R, Jordan S, Lowe DG, et al. Mutation and expression analysis of the p27/kip1 gene in corticotrophin-secreting tumours. Oncogene. 1998;16(1):69-76.
  24. Lindberg D, Akerström G, Westin G. Mutational analysis of p27 (CDKN1B) and p18 (CDKN2C) in sporadic pancreatic endocrine tumors argues against tumor-suppressor function. Neoplasia. 2007;9(7):533-5.
  25. Takeuchi S, Koeffler HP, Hinton DR, Miyoshi I, Melmed S, Shimon I. Mutation and expression analysis of the cyclin-dependent kinase inhibitor gene p27/Kip1 in pituitary tumors. J Endocrinol. 1998;157(2):337-41.
  26. Chasseloup F, Pankratz N, Lane J, Faucz FR, Keil MF, Chittiboina P, et al. Germline CDKN1B Loss-of-Function Variants Cause Pediatric Cushing's Disease With or Without an MEN4 Phenotype. J Clin Endocrinol Metab. 2020;105(6):1983-2005.
  27. Tichomirowa MA, Lee M, Barlier A, Daly AF, Marinoni I, Jaffrain-Rea ML, et al. Cyclin-dependent kinase inhibitor 1B (CDKN1B) gene variants in AIP mutation-negative familial isolated pituitary adenoma kindreds. Endocr Relat Cancer. 2012;19(3):233-41.
  28. Malanga D, De Gisi S, Riccardi M, Scrima M, De Marco C, Robledo M, et al. Functional characterization of a rare germline mutation in the gene encoding the cyclin-dependent kinase inhibitor p27Kip1 (CDKN1B) in a Spanish patient with multiple endocrine neoplasia-like phenotype. Eur J Endocrinol. 2012;166(3):551-60.
  29. Belar O, De La Hoz C, Pérez-Nanclares G, Castaño L, Gaztambide S. Novel mutations in MEN1, CDKN1B and AIP genes in patients with multiple endocrine neoplasia type 1 syndrome in Spain. Clin Endocrinol (Oxf). 2012;76(5):719-24.
  30. Jensen RT, Ito T. Gastrinoma. In: Feingold KR, Anawalt B, Boyce A, Chrousos G, de Herder WW, Dhatariya K, et al., editors. Endotext. South Dartmouth (MA): MDText.com, Inc. Copyright © 2000-2021, MDText.com, Inc.; 2020.
  31. de Herder WW, Zandee WT, Hofland J. Insulinoma. In: Feingold KR, Anawalt B, Boyce A, Chrousos G, de Herder WW, Dhatariya K, et al., editors. Endotext. South Dartmouth (MA): MDText.com, Inc. Copyright © 2000-2022, MDText.com, Inc.; 2020.
  32. Zandee WT, Hofland J, de Herder WW. Vasoactive Intestinal Peptide Tumor (VIPoma). In: Feingold KR, Anawalt B, Boyce A, Chrousos G, de Herder WW, Dhatariya K, et al., editors. Endotext. South Dartmouth (MA): MDText.com, Inc. Copyright © 2000-2022, MDText.com, Inc.; 2021.
  33. Tsoli M, Dimitriadis GK, Androulakis, II, Kaltsas G, Grossman A. Paraneoplastic Syndromes Related to Neuroendocrine Tumors. In: Feingold KR, Anawalt B, Boyce A, Chrousos G, de Herder WW, Dhatariya K, et al., editors. Endotext. South Dartmouth (MA): MDText.com, Inc. Copyright © 2000-2022, MDText.com, Inc.; 2020.


Craniopharyngiomas

ABSTRACT


Craniopharyngiomas are rare intracranial tumors that mainly arise in the sellar/parasellar (particularly suprasellar) region. They present in both children and adults with a wide range of clinical manifestations. Histologically, they are benign tumors with distinct adamantinomatous and papillary subtypes. Beta-catenin gene mutations have been identified in the adamantinomatous subtype and activating mutations in BRAF (V600E) in the papillary variant, opening further avenues in our understanding of their pathogenesis. Despite their benign classification, management is challenging due to unpredictable growth and the involvement of adjacent critical structures particularly for vision and hypothalamo-pituitary function. Surgery with or without external irradiation currently represents the mainstay of therapy for most patients; however, the optimal protocol for the management of these tumors has not yet been established. Further management options include intracystic irradiation or bleomycin, stereotactic radiosurgery, systemic chemotherapy, or targeted BRAF inhibitors (for the papillary subtype); however, the outcomes of these approaches have not yet been validated with large scale clinical trials. Following treatment, patients face a high burden of morbidity due to visual, endocrine, hypothalamic, and neuropsychological dysfunction, and long-term mortality rates are substantially elevated compared with the general population.


EPIDEMIOLOGY


Craniopharyngiomas account for 2–5% of all primary intracranial neoplasms and for up to 15% of intracranial tumors in children (1). Their annual incidence is reported as around 0.18 cases per 100,000 people (2), and genetic susceptibility seems unlikely. Craniopharyngiomas may be detected at any age, even in the prenatal and neonatal periods (3) and a bimodal age distribution with peak incidence rates at ages 5–14 and 50–74 years has been proposed (2,4). In population-based studies from the USA and Finland, no gender differences have been found (4,5).


PATHOLOGY AND PATHOGENESIS


Craniopharyngiomas are epithelial tumors arising along the path of the craniopharyngeal duct (the canal connecting the stomodeal ectoderm with the evaginated Rathke’s pouch). Based on the WHO classification, they are assigned grade I. Rare cases of malignant transformation (possibly triggered by previous irradiation) have been described (1). Two main pathological subtypes have been reported: the adamantinomatous variant and the papillary variant (1,6).


The adamantinomatous variant is the most common subtype and may occur at any age (Figure 1). Macroscopically, adamantinomatous craniopharyngiomas have cystic and/or solid components, necrotic debris, fibrous tissue and calcification. The cysts may be multiloculated and contain liquid ranging from “machinery oil” to shimmering cholesterol-laden fluid consisting of desquamated squamous epithelial cells, rich in membrane lipids and cytoskeleton keratin. They tend to have sharp and irregular margins, often merging into a peripheral zone of dense reactive gliosis, with abundant Rosenthal fiber formation (consisting of irregular masses of granular deposits within astrocytic processes) in the surrounding brain tissue and vascular structures. The epithelium of the adamantinomatous type is composed of three layers of cells: a distinct palisaded basal layer of small cells with darkly staining nuclei and little cytoplasm (somewhat resembling the basal cells of the epidermis of the skin); an intermediate layer of variable thickness composed of loose aggregates of stellate cells (termed stellate reticulum), with processes traversing empty intercellular spaces; and a top layer facing into the cyst lumen with abruptly enlarged, flattened and keratinized to flat plate-like squamous cells. The flat squames are desquamated singly or in distinctive stacked clusters and form nodules of “wet” keratin, which are often heavily calcified and appear grossly as white flecks. The keratinous debris may elicit an inflammatory and foreign body giant cell reaction. The presence of the typical adamantinomatous epithelium or of the “wet” keratin alone are diagnostic, whereas features only suggestive of the diagnosis in small or non-representative specimens include fibrohistiocytic reaction, necrotic debris, calcification and cholesterol clefts (1).

Figure 1A. Histology of adamantinomatous craniopharyngioma. Islands of tumor with finger-like protrusions into surrounding brain tissue with central accumulation of keratin nodules; HE x40 magnification.

Figure 1B. Histology of adamantinomatous craniopharyngioma. Well-differentiated epithelium with peripheral palisading, nodular whorls, and pale, microcystic areas termed ‘stellate reticulum’, as well as pale eosinophilic ‘wet keratin’ nodule (right bottom); HE x200 magnification.

Figure 1C. Histology of adamantinomatous craniopharyngioma. Beta-catenin immunohistochemistry of area shown in A, highlighting dark staining nodular whorls; x40 magnification

Figure 1D. Histology of adamantinomatous craniopharyngioma. Basal epithelium demonstrating the aberrant nuclear accumulation of beta-catenin in nodular whorls (arrowheads) due to beta-catenin mutation; Anti-beta-catenin, x400 magnification.

The papillary variant has been almost exclusively described in adult populations (accounting for 14-50% of adult cases but only around 2% of pediatric cases) (Figure 2). It consists of mature squamous epithelium forming pseudopapillae and of an anastomosing fibrovascular stroma without the presence of peripheral palisading of cells or stellate reticulin, and with membranous beta-catenin immunoreactivity only. The differential diagnosis between a papillary craniopharyngioma and a Rathke’s cleft cyst may be difficult, particularly in small biopsy specimens, as the epithelial lining of the Rathke’s cysts may undergo squamous differentiation; however, the lack of a solid component and the presence of extensive ciliation and/or mucin production are suggestive of Rathke’s (1,6).

Figure 2A. Histology of papillary craniopharyngioma. Papillae lined by non-keratinizing squamous epithelium and containing loosely structured connective tissue; HE x20 magnification.

Figure 2B. Histology of papillary craniopharyngioma. Connective tissue harbors a patchy lymphocytic infiltrate (asterix); HE x100 magnification.

Figure 2C. Histology of papillary craniopharyngioma. Non-keratinizing squamous epithelium highlighted by beta-catenin immunostain, x20 magnification.

Figure 2D. Histology of papillary craniopharyngioma. Squamous epithelium showing membranous immunoreactivity of beta-catenin, lacking clusters with aberrant nuclear accumulation, x400 magnification.

Although the pathogenesis of craniopharyngiomas has not been fully elucidated, our understanding in this field has increased significantly in recent years. Beta-catenin gene (CTNNB1) mutations have been identified in the adamantinomatous subtype affecting exon 3 which encodes the degradation targeting box of beta-catenin; the mutant form is resistant to degradation leading to accumulation of nuclear beta-catenin protein (a transcriptional activator of the Wnt signaling pathway) (Figure 1D). Furthermore, strong beta-catenin expression has been shown in the adamantinomatous subtype indicating re-activation of the Wnt signaling pathway and subsequent de-regulation of several downstream pathways (7-10). Molecular analysis also implicates the immune response in the pathogenesis of adamantinomatous craniopharyngiomas. Cells within this subtype show signs of inflammation (in both cystic and solid components), and increased levels of cytokines including Interleukin-6 (IL-6), IL-8 and IL-10 have been identified(10-12). Furthermore, the expression of immune related genes is increased, and the immune check point proteins Programmed Death Ligand 1 (PD-L1), and Programmed Cell Death Protein 1 (PD-1) are expressed in both subtypes of craniopharyngioma(10,13).  For papillary craniopharyngiomas specifically, a number of studies using whole exome sequencing, next-generation panel sequencing, pyrosequencing and Sanger sequencing have shown the presence of activating mutations in the BRAF (V600E) gene;  the prevalence of which varies according to the sequencing method, generally being between 81 and 100% (8). BRAF mutations can lead to activation of the MAPK/ERK (Mitogen Activated Protein Kinase / Extracellular signal Regulated Kinases) pathway, which ultimately results to increased cell growth, proliferation, and cell survival(10). Whilst BRAF mutations are found in numerous cells within papillary craniopharyngiomas, only a small cluster of progenitor cells expressing the SOX2/SOX9 (Sex Region Y Box 2 and 9) transcription factors are believed to be involved in their tumorigenesis(14). It has also been suggested that the two pathological subtypes have different epigenomic and transcriptomic signatures, and that the cell clusters in the adamantinomatous subtype may have a functional role in the promotion of tumor invasion (8).


DIAGNOSIS


Location/Imaging


Most craniopharyngiomas are located in the sellar/parasellar region and the majority (94-95%) have a suprasellar component. Other rare locations include the nasopharynx, the paranasal area, the sphenoid bone, the ethmoid sinus, the intrachiasmatic area, the temporal lobe, the pineal gland, the posterior cranial fossa, the cerebellopontine angle, the midportion of the midbrain or, mainly relating to the papillary variant, within the 3rd ventricle(1). Plain skull X-rays, although seldom used nowadays, may show calcification and an abnormal sella. CT is helpful for evaluation of the bony anatomy, the identification of calcification and the discrimination of the solid and cystic components. They are usually of mixed attenuation; the cyst fluid has low density and the contrast medium enhances any solid portion, including the cyst capsule (1). MRI is particularly useful for the topographic and structural analysis of the tumor. The radiological appearance depends on the proportion of the solid and cystic components, the content of the cyst(s) (cholesterol, keratin, hemorrhage), and the amount of calcification present. A solid lesion appears as iso- or hypointense relative to the brain. On pre-contrast T1-weighted images, it shows enhancement following gadolinium administration, and is usually of mixed hypo- or hyperintensity on T2-weighted images. Large amounts of calcification may be visualized as areas of low signal on both T1- and T2-weighted images. A cystic element is usually hypointense on T1- and hyperintense on T2-weighted sequences, and a thin peripheral contrast-enhancing rim of the cyst can be shown on T1-weighted images. Protein, cholesterol, and methemoglobin may cause high signal on T1-weighted images, while very concentrated protein and various blood products may be associated with low T2-weighted signal (1). Imaging examples from cystic, solid, and mixed solid-cystic craniopharyngiomas are shown in Figure 3.

Figure 3A. MRI images of craniopharyngiomas. Coronal section showing cystic craniopharyngioma on post-contrast T1-weighted MRI. The cyst contents are isointense and the cyst rim enhances following contrast.

Figure 3B. MRI images of craniopharyngiomas. Sagittal section of 3A.

Figure 3C. MRI images of craniopharyngiomas. Sagittal section showing a solid craniopharyngioma on T1-weighted imaging which enhances after contrast.

Figure 3D. MRI images of craniopharyngiomas. Coronal section showing a solid craniopharyngioma on T1-weighted imaging which enhances after contrast.

Figure 3E. MRI images of craniopharyngiomas. Sagittal section showing a craniopharyngioma with mixed solid and cystic components on post-contrast T1-weighted imaging.

Figure 3F. MRI images of craniopharyngiomas. Coronal section showing a mixed solid and cystic craniopharyngioma with mixed signal intensities on T2-weighted imaging.

The consistency of craniopharyngiomas can be purely or predominantly cystic, purely or predominantly solid, and mixed. When present, the calcification patterns vary from solid lumps to popcorn-like foci or, less commonly, to an eggshell pattern lining the cyst wall. Hydrocephalus has been reported in 20-38% and is probably more frequent in childhood-diagnosed disease (41-54%).


The differential diagnosis includes a number of sellar or parasellar lesions, including Rathke’s cleft cyst, dermoid cyst, epidermoid cyst, pituitary adenoma, germinoma, hamartoma, suprasellar aneurysm, arachnoid cyst, suprasellar abscess, glioma, meningioma, sarcoidosis, tuberculosis and Langerhans cell histiocytosis. Differentiation from a Rathke’s cleft cyst (typically small, round, purely cystic lesions lacking calcification), or from a pituitary adenoma (in the rare case of a homogeneously enhancing solid craniopharyngioma), may be particularly difficult (1,15).


Clinical and Hormonal Manifestations at Presentation


Patients with craniopharyngioma may present with a variety of clinical manifestations attributed to pressure effects on vital structures of the brain (visual pathways, brain parenchyma, ventricular system, major blood vessels and hypothalamo-pituitary system) (15-17). Their severity depends on the location, size, and growth potential of the tumor. The duration of the symptoms until diagnosis ranges between 1 week to 372 months(1). The presenting clinical manifestations (neurological, visual, hypothalamo-pituitary) are shown in Table 1. Headaches, nausea/vomiting, visual disturbances, growth failure (in children) and hypogonadism (in adults) are the most frequently reported. Other less common or rare features include motor disorders, such as hemi- or monoparesis, seizures, psychiatric symptoms such as emotional lability, hallucinations and paranoid delusions, autonomic disturbances, precocious puberty, the syndrome of inappropriate secretion of antidiuretic hormone, chemical meningitis due to spontaneous cyst rupture, hearing loss, anosmia, nasal obstruction, epistaxis, photophobia, emaciation, Weber’s syndrome (ipsilateral III cranial nerve palsy with contralateral hemiplegia due to midbrain infarction), and Wallenberg’s syndrome (signs due to occlusion of the posterior inferior cerebellar artery) (1). It has been proposed that in cases of craniopharyngioma diagnosed in childhood, compromised growth rate is already evident in early infancy, whereas an increase in weight tends to present later and is a predictor of obesity (18). 


The hypothalamo-pituitary function at presentation may be severely affected; a summary of the results of various studies using different diagnostic tests and criteria shows that GH deficiency is present in 35–100% of the evaluated patients, FSH/LH deficiency in 38–91%, ACTH deficiency in 21–68%, TSH deficiency in 20–42% and diabetes insipidus in 6–38%.


Table 1. Presenting Clinical Features in Children and Adults with Craniopharyngioma (10)


Children

Adults


Total

Headaches

78%

56%

64%

Menstrual disorders


57%


Visual field defects

46%

60%

55%

Decreased visual acuity

39%

40%

39%

Nausea/vomiting

54%

26%

35%

Growth failure

32%


Poor energy

22%

32%

29%

Impaired sexual function


28%


Impaired secondary sexual characteristics

(pts aged ≥13 years)


24%

Lethargy

17%

26%

23%

Other cranial nerves palsies

27%

  9%

15%

Polyuria/polydipsia

15%

15%

15%

Papilledema

29%

  6%

14%

Cognitive impairment

(memory, concentration)

10%

17%

14%

Anorexia/weight loss

 20%

  8%

12%

Optic atrophy

  5%

14%

10%

Hyperphagia/excessive weight gain

  5%

13%

10%

Psychiatric symptoms/change in behavior

10%

  8%

  8%

Somnolence

  5%

10%

  8%

Galactorrhea


  8%


Decreased consciousness/coma

10%

  4%

  6%

Cold intolerance

  0%

  8%

  5%

Unsteadiness/ataxia

  7%

  3%

  4%

Hemiparesis

  7%

  1%

  3%

Blindness

  3%

  3%

  3%

Meningitis

   0%

   3%

 2%


MANAGEMENT


Surgery Combined or Not with External Irradiation


Surgery combined or not with adjuvant external beam irradiation is currently one of the most widely used first therapeutic approaches for craniopharyngiomas. These tumors pose challenges mainly due to their sharp, irregular borders and to their tendency to adhere to vital neurovascular structures, making surgical manipulation potentially hazardous to vital brain areas. When large cystic components are present, fluid aspiration provides relief of the obstructive manifestations and facilitates the consecutive removal of the solid portion, which should not be delayed for more than a few weeks due to the significant risk of cyst refilling (15,19). The attempted extent of excision has been a subject of significant debate and depends on the size (achieved in 0% of lesions >4 cm) and location of the tumor, the presence of hydrocephalus (particularly difficult for retrochiasmatic or within the 3rd ventricle), >10% calcification, tumor adherence to the hypothalamus, brain invasion, as well as the experience, individual judgment during the operation, and general treatment policy (aggressive or not) adopted by each neurosurgeon (1,20-22). In recent years, many tertiary centers have adopted a more conservative surgical approach, electing for partial or limited resection with radiotherapy over complete resection, when possible, with aim of hypothalamic sparing and reducing subsequent morbidity (23). In microsurgical series, post-operative mortality ranges between 0 and 5.4% (24), while in a meta- analysis including 2,955 patients early mortality of 2.6% after transsphenoidal and 3.1% after transcranial surgery were reported (25).


Interestingly, until 1937, when Carpenter et al. (26) first described the beneficial effects of radiotherapy following aspiration of cyst contents in 4 cases, craniopharyngiomas were considered radioresistant. Historically, the role of irradiation started being established almost two decades later, following the report of the favorable outcome of the combination of minimal surgery and high-dose supervoltage irradiation in a series of 10 patients by Kramer et al. (27). The irradiation of cystic craniopharyngiomas carries the risk of cyst enlargement, arising during or within 6 months after radiotherapy, reported in 10-60% of patients (28-31). Whilst urgent surgical decompression may be needed in some cases, enlargement is transient, and does not represent tumor recurrence (15,30,32).


Recurrence Following Surgery


Recurrent tumors may arise even from small islets of craniopharyngioma cells in the gliotic brain adjacent to the tumor, which can remain even after gross total removal. The mean interval for diagnosis of recurrence following various primary treatment modalities ranges between 1 and 4.3 years. Remote recurrences as late as 30 years after initial therapy have been reported; possible mechanisms include transplantation during the surgical procedures and dissemination by meningeal seeding or CSF spreading (1). Series with radiological confirmation of the radicality of resection show that recurrence rates following gross total removal range between 0 and 62% at 10 years follow-up. These are significantly lower than those reported after partial or subtotal resection (25-100% at 10 years follow-up). In cases of limited surgery, adjuvant radiotherapy significantly improves the local control rates (recurrence rates 10-63% at 10 years follow-up).  Finally, radiotherapy alone provides 10 years recurrence rates ranging between 0 and 23% (1). These results were based on the use of conventional fractionated external beam radiotherapy; tumor control rates with newer higher precision techniques, such as fractionated stereotactic conformal radiotherapy, have remained optimal with 5-year progression free survival exceeding 90% (33,34). Tumor control rates achieved by proton beam therapy in patients with craniopharyngioma are promising (35), but studies with long-term follow-up are needed. Studies with statistical comparisons of the local control rates achieved by gross total removal or the combination of surgery and radiotherapy have not provided consistent results. The interpretation of data regarding effectiveness of each therapeutic modality must be done with caution, since the published studies are retrospective, non-randomized and often specialty-biased.


The growth rate of craniopharyngiomas varies considerably and reliable clinical, radiological, and pathological criteria predicting their behavior are lacking. Thus, apart from significant impact of the treatment modality as mentioned above, attempts to identify other prognostic factors for recurrence (age, group at diagnosis, sex, imaging features, pathological subtypes) have not provided consistent results (1).


The management of recurrent tumors remains challenging, as scarring/adhesions from previous operations or irradiation make successful removal difficult. In such cases, total removal is achieved in a substantially lower rate when compared with primary surgery (0-25%). Perioperative mortality is increased following recurrence, occurring in as many as 11-24% (22). The beneficial effect of radiotherapy (proceeded or not by second surgery) in recurrent lesions has been clearly shown(15,36). Recurrent lesions with significant cystic component not amenable to total extirpation may be treated by repetitive aspirations through an indwelling Ommaya reservoir apparatus. In a small series of 11 adult patients with cystic craniopharyngiomas treated with Ommaya reservoirs, local control was achieved in 8 patients (72.7%) without the need for additional treatment over a follow up period of 41.4 months (37).


Intracystic Irradiation


Intracavitary irradiation (brachytherapy) involves stereotactically guided instillation of beta-emitting isotopes into cystic craniopharyngiomas. It delivers a higher radiation dose to the cyst than external beam radiotherapy, resulting in damage of the secretory epithelial lining, elimination of fluid production, and cyst shrinkage. The efficacy of various beta and gamma-emitting isotopes (mainly 32phosphate, 90yttrium, 186 rhenium, 198gold) has been investigated in a number of studies, but given that none of them has the ideal physical and biological profile, there is no consensus on which is the most suitable therapeutic agent. In a systematic review which included 66 children treated with brachytherapy, a reduction in tumor size was reported in 89% of children with cystic only craniopharyngiomas, and in 58% in those with mixed cystic and solid components (38). In series with mean or median follow-up between 3.1 and 11.9 years providing intracavitary irradiation (mainly with 90yttrium or 32phosphorus) at doses of 200-270 Gy, complete or partial cyst resolution was seen in 71-88%, stabilization in 3-19%, and increases in 5-10% of cases (39-44). New cyst formation or increase in the solid component of the tumor were observed in between 6.5 and 20% of cases. Although beta emitters have short range tissue penetrance, lesions in close proximity to the optic apparatus should be approached with caution (39-44). Deterioration of vision has been reported in 10-58% of cases and has been attributed to failure of cyst collapse, formation of new cysts, increase in the solid tumor, or possibly radiation damage. The reported control rates combined with low surgical morbidity and mortality render brachytherapy an attractive option for predominantly cystic tumors, particularly those that are monocystic. 


Intracystic Bleomycin


Intracystic installation of the anti-neoplasmatic agent bleomycin has been used in the management of craniopharyngiomas. The drug is administered through an Ommaya reservoir connected to a catheter. In published reports the tumor control rates range between 0 and 100%. However, evidence supporting its efficacy is limited mostly to case reports or non-randomized retrospective studies, and a Cochrane review (45) exploring the effects of bleomycin in children could not recommend its use. Direct leakage of the drug to surrounding tissues during the installation procedure, diffusion though the cyst wall, or high drug doses have been associated with various toxic (hypothalamic damage, blindness, hearing loss, ischemic attacks, peritumoral edema) or even fatal effects (1,46,47).The value of this treatment option in tumor control or even in delaying surgery and/or radiotherapy, as well as the optimal protocol and the clear-cut criteria predicting the long-term outcome, remain to be established in large series with sufficient follow-up.


Intracystic Interferon-Alpha


Intracystic interferon-alpha is not neurotoxic and is therefore associated with a lower risk of adverse events when compared to other intracystic treatments. Despite encouraging results in a number of studies with short follow up, a large multicenter study demonstrated tumor progression in 75% of patients by a median of just 14 months (48,49).


Stereotactic Radiosurgery


Stereotactic radiosurgery delivers a single or small number of fraction(s) of high dose ionizing radiation to precisely mapped targets, keeping the exposure of adjacent structures to a minimum. Tumor volume and close attachment to critical structures (e.g., optic apparatus) are limiting factors for its application. Risk of optic neuropathy is <1% when the optic chiasm is constrained to a maximal dose of 10 Gy, 20 Gy, and 25 Gy, for single-fraction SRS, 3-fraction SRS, and 5-fraction SRS respectively (50). SRS achieves tumor control in a substantial number of patients with small volume lesions and reported 5-year progression free survival ranges between 61% and 90.3% (51-55). Rate of tumor control following SRS is negatively associated with tumor volume (56), thus it is particularly useful for well-defined residual disease following surgery or for the treatment of small, solid recurrent tumors situated at least 3-5mm away from the optic chiasm (49). Increasing margin dose and maximum dose >35Gy have been associated with increased risk of neurologic deficit following SRS (57). Studies with long-term follow-up evaluating the optimal marginal dose, its role in the prevention of tumor growth, and its effects on neurocognitive and neuroendocrine function, are needed.


Systemic Chemotherapy/Interferon-Alpha 


The potential benefit of systemic chemotherapy in craniopharyngiomas has been investigated in a very limited number of patients. Thus, Bremer et al. (58) reported a case of successful management of a recurrent cystic tumor with the combination of vincristine, carmustine (BCNU) and procarbazine. Lippens et al. (59), after administration of five courses of doxorubicin and lomustin in 4 children with multiple or very rapid recurrences, achieved local control in 75% of them after 3-12 years follow-up. Jakacki et al. (60), in a series of 12 patients aged <21 years with progressive or recurrent craniopharyngiomas, showed that after 12 months of treatment with interferon-alpha, tumor reduction of at least 25% was observed in 3 cases. However, during the first weeks of therapy 6 patients experienced an increase in the size of the cystic component, which was finally considered as progressive disease in half of them. Interestingly, 67% of patients that completed one year of therapy without progressive disease had an increase in the size of their tumor at a median period of 11 months after discontinuation of the drug. The cytotoxicity (predominantly hepatic, neurological and cutaneous), requiring temporary discontinuation and/or dose reduction within the first 8 weeks of therapy, was significant (in up to 60% of the cases). In 2012, the same group explored the use of pegylated interferon (a derivative of interferon-alpha with a longer half-life) in five patients; all demonstrated a radiological response to treatment and two of them had a complete response (61). A subsequent phase two multi-center study gave disappointing results. Of 18 adults and children with recurrent craniopharyngiomas who were given systemic pegylated interferon, only one attained a sustained response beyond 3 months (62).


Targeted Therapy


The finding that most papillary craniopharyngiomas harbor a BRAF (V600E) mutation has opened avenues for use of pharmacological agents specifically targeting and inhibiting mutant BRAF in cases resistant to other treatments. A number of case reports and small case series have demonstrated a significant reduction in tumor size (used alone or in combination with MEK inhibitors), applied neoadjuvantly or after surgery, with or without prior radiotherapy (8,49,63-73). Common side effects associated with BRAF and MEK inhibitors seen from their use in other diseases (such as metastatic melanoma and papillary thyroid cancer) include rash, fever, diarrhea, arthralgia, and liver dysfunction (74). Cases of adamantinomatous craniopharyngiomas responding to MEK inhibitors (75), or controlled with IL-6 inhibitors used alone or in conjunction with VEGR inhibitors (12), have also been reported. The pros and cons of these new treatment modalities, particularly for aggressive tumors, warrant further assessment by trials with large number of patients and adequate follow-up. Two clinical trials (BRAF and MEK inhibitors for papillary craniopharyngiomas, and IL-6 inhibitors for children with adamantinomatous craniopharyngiomas) are currently ongoing (76,77). Initial results from one of these trials – a phase two study which included sixteen patients with papillary craniopharyngiomas harboring the BRAF V600E mutation – have been presented. All patients were treated with oral vemurafenib (BRAF inhibitor) and cobimetinib (MEK inhibitor) in 28-day cycles. Median age and follow up duration were 49.5 years and 1.8 years respectively. In those where volumetric imaging data was available, 14 (93.3%) had a radiological response to treatment, with a median tumor reduction of 83%. Grade 3 (severe) toxicities occurred in 12 patients, whilst grade 4 (potentially life threatening) toxicities occurred in two patients. Three patients stopped treatment due to adverse events (78).


MORBIDITY AND MORTALITY


Craniopharyngiomas are associated with significant long-term morbidity (mainly involving endocrine, visual, hypothalamic, neurobehavioral, and cognitive sequelae), which is attributed to the damage of critical structures by the primary or recurrent tumor and/or to the adverse effects of the therapeutic interventions. Notably, the severity of the radiation-induced late toxicity is affected by the total and per fraction doses, the volume of the exposed normal tissue, and the young age in childhood populations (1).


Endocrine


Long-term endocrine morbidity is significant. At last assessment, the rates of individual hormone deficits range between 88-100% for GH, 80-95% for FSH/LH, 55-88% for ACTH, 39-95% for TSH and 25-86% for ADH (1). Restoration of pre-existing hormone deficits following surgical removal is rare, and aggressive surgery leads to more frequent pituitary dysfunction (1,23,79).


The phenomenon of «growth without growth hormone» has been reported in some children with craniopharyngioma who show normal or even accelerated linear growth, despite their untreated GH deficiency. The pathophysiological mechanism has not been clarified; the obesity-associated hyperinsulinemia has been proposed as a factor stimulating growth by affecting serum concentrations of IGF-I or by binding directly to the IGF-I receptor (80,81). Review of adult patients with craniopharyngioma and severe GH deficiency but no recent GH treatment (from the KIMS database: Pfizer International Metabolic Database) has shown that those with childhood-onset disease were shorter than those with adult-onset disease, and obesity was more common in the adult-onset patients. Furthermore, quality of life, assessed by Quality of Life-Assessment of Growth Hormone Deficiency in Adults (QoL-AGHDA) and the Nottingham Health Profile, was markedly reduced with no significant differences between those with childhood-onset and those with adult-onset disease (82). A 3-year longitudinal analysis of the changes in height, weight, and body mass index (BMI) SDS in 199 GH-treated pre-pubertal children with post-surgical and/or post-irradiated craniopharyngioma showed that GH therapy induced excellent linear growth compared with children with other forms of organic GH deficiency. Still, the children with craniopharyngioma had a higher BMI; GH had no salutary effect on weight SDS and caused only a mild improvement in BMI SDS (83). A study of 351 patients with adult-onset craniopharyngioma compared with 370 patients with non-functioning pituitary adenomas matched for age and sex (all GH deficient) demonstrated that, after two years of GH replacement, there were significant similar improvements in both groups in free-fat mass, total and low-density lipoprotein and Quality of Life Assessment in the GH-deficient score compared with baseline. Results from a 12-year prospective study showed children with craniopharyngioma treated with GH had improved weight and quality of life outcomes compared to those who were not replaced, or in those who only received GH as adults (84). Observational studies have also shown that growth hormone replacement is not associated with increased risk of tumor recurrence.


Diabetes insipidus with an absent or impaired sense of thirst confers a significant risk of serious electrolyte imbalance, and is one of the most difficult complications to manage. In this group of patients, the maintenance of osmotic balance has been shown to be precarious with recurrent episodes of hyper- or hyponatremia contributing to morbidity and mortality. Careful fluid balance with close monitoring of intake/output and daily weights is crucial.


Vision


Visual outcome is adversely affected by the presence of visual symptoms at diagnosis and by daily irradiation doses >2 Gy (1). Radiation optic neuropathy occurs in 1–2% patients receiving doses to 50 Gy and this is mostly confined to those with pre-radiotherapy visual impairment, with the risk being higher with doses of 55 Gy and above (1,28).


Hypothalamic


Hypothalamic damage may result in hyperphagia and uncontrollable obesity, disorders of thirst and water/electrolyte balance, behavioral and cognitive impairment, loss of temperature control and disordered sleep pattern. Among these, obesity is the most frequent (reported in 26-61% of the patients treated by surgery combined or not with radiotherapy) and is a consequence of the disruption of the mechanisms controlling satiety, hunger, and energy balance (1,15,85-88). Possible contributing mechanisms include lack of sensitivity to endogenous leptin (89,90) and reduced energy expenditure, and is exaggerated by comorbidities including neurological defects, visual failure, somnolence (91), sleep disturbance, hypopituitarism and psychosocial disorders (92). In a study of 63 survivors of childhood craniopharyngioma, all those with marked obesity after surgery had evidence of significant alterations of the normal hypothalamic anatomy, with their MRI showing either complete deficiency or extensive destruction of the floor of the 3rd ventricle (93). Several image grading systems, used pre- or post-operatively, have been proposed to help predict hypothalamic sequalae and hypothalamic morbidity by defining hypothalamic involvement on imaging and severity of tumor adherence to the hypothalamus (94-98). Furthermore, it has been reported that the basal metabolic rate adjusted to total body weight is significantly lower in adults with craniopharyngioma compared with controls, and that the energy intake/basal metabolic rate ratio is significantly lower in subjects with tumor growth into the 3rd ventricle (99). Children with surgically-treated craniopharyngioma were found to have decreased aerobic capacity during an exercise test, which was most pronounced in those with hypothalamic involvement.  Interestingly, in this study, GH treatment was associated with significant positive effect on aerobic capacity only in the absence of hypothalamic involvement (100). Finally, high levels of the orexigenic gastric hormone ghrelin have not been found in these patients (101). Factors proposed to be associated with significant hypothalamic morbidity are young age at presentation, hypothalamic disturbance at diagnosis, hypothalamic invasion, attempts to remove adherent tumor from the region of hypothalamus, multiple operations for recurrence, and hypothalamic radiation doses >51 Gy (1,102,103). Interestingly, in a retrospective study including 45 adults with craniopharyngioma followed for a median of 26 months, a lower BMI pre-operatively was predictive of greater post-operative weight gain(104). In contrast, a higher pre-operative BMI has been found to be associated with severe post-operative obesity in children(18). Hypothalamic obesity often results in devastating metabolic and psychosocial complications, necessitating provision of dietary and behavioral modifications, encouragement of regular physical activity, psychological counselling, and anti-obesity drugs. Based on a limited number of published cases, gastric bypass surgery results in weight loss; in a systematic review and meta-analysis including 21 cases of bariatric surgery for hypothalamic obesity in patients with craniopharyngioma (6 with adjustable gastric banding, 8 with sleeve gastrectomy, 6 with Roux-en-Y gastric bypass and 1 with biliopancreatic diversion), it was shown that the maximal mean weight loss was achieved in the gastric bypass group after 12 months (105). Furthermore, Weismann et al. (106) in a series of 7 patients with morbid obesity after surgery for craniopharyngioma, who underwent laparoscopic gastric banding or laparoscopic sleeve gastrectomy, reported no significant loss of body weight. A case control study suggested that Roux-en-Y surgery, but not sleeve gastrectomy, yielded equivalent weight loss in craniopharyngioma patients to those with “common” obesity and resulted in significant reductions to BMI after one year (107). The same group subsequently conducted a larger, multi-center case control study, with a median follow up of 5.2 years (108). Obese patients with craniopharyngioma had a mean weight loss of 22% at 5 years after bariatric surgery; irrespective of type of procedure. In contrast to their original findings (107), obese controls lost more weight after Roux-en-Y gastric bypass, whereas sleeve gastrectomy led to similar results in both groups (108). Medical therapies including dextroamphetamine, the combination of diazoxide and metformin (aiming to reduce the hyperinsulinemia), octreotide (aiming to reduce hyperinsulinemia and simultaneously enhance the insulin action), glucagon-like peptide-1 analogues, and a novel methionine aminopeptidase 2 inhibitor, have all been proposed as potential approaches to this significant problem (92). However, outcomes following these therapies are variable and long-term benefits have not yet been established. Studies with large number of patients and longer follow-up are needed to establish the efficacy and safety of these surgical and medical management options.


Neuropsychological and Cognitive


The compromised neuropsychological and cognitive function in patients with craniopharyngioma after surgery and radiation therapy contributes significantly to poor academic and work performance, disrupted family and social relationships, disrupted body image, and impaired quality of life. Gross total resection, radiotherapy, pre-operative hypothalamic involvement, or intra-operative hypothalamic injury have been associated with a lower quality of life in adults and children with craniopharyngioma (109). It has also been proposed that visual, neurological, and endocrine morbidities negatively impact neuropsychological outcomes (110,111). Areas particularly affected (especially in childhood-onset disease) include memory, attention, executive function, and motivation (110,112-114), with hypothalamic involvement being a risk factor for poorer outcomes (113). In a series of 121 patients followed-up for a mean period of 10 years, Duff et al.(115) found that 40% had poor functional neuropsychiatric outcome. Karavitaki et al. (15), in a series of 121 patients, found cumulative probabilities for permanent motor deficits, epilepsy, psychological disorders necessitating treatment, and complete dependency for basal daily activities at 10-year follow-up of 11%, 12%, 15% and 9%, respectively. There is no consensus on the therapeutic option with the least unfavorable impact on the neurobehavioral outcome, necessitating prospective studies with formal neuropsychological testing and specific behavioral assessment before and after any intervention.  Such data will be particularly important for young children, as there are uncertainties including whether delaying irradiation is a reasonable policy in this age group. 


Long-Term Mortality


The mortality rates of patients with craniopharyngioma have been described to be 3-6 times higher than that of the general population and reported 10-years survival rates range between 83% and 93% (1,87). Qiao et al.(116) reported a significant fall in the SMR from 6.2 (95% CI 4.1-9.4) to 2.9 (95% CI 2.2-3.8) for studies published before 2010, and after 2010, respectively (116). Apart from the deaths directly attributed to the tumor (pressure effects to critical structures) and to the surgical interventions, the risk of cardio-/cerebrovascular and respiratory mortality is increased (1,117,118). In one study which included 244 patients with childhood onset craniopharyngioma, 11% of patients developed a cerebral infarction. Hydrocephalus and gross total resection were identified as risk factors, and none were attributable to radiotherapy (119). The increased cardiovascular mortality in this population may be driven in part by hypothalamic obesity and related metabolic complications. Long-term follow-up of adult patients with craniopharyngiomas has demonstrated increased prevalence of the metabolic syndrome compared with the general population (120), and hypothalamic involvement has been shown to have negative impact on mortality (121). It has been suggested that in childhood populations the hypoadrenalism and the associated hypoglycemia, as well as the metabolic consequences of ADH deficiency and absent thirst, may also contribute to the excessive mortality. The impact of tumor recurrence on the long-term mortality is widely accepted and the 10-year survival rates in such cases range between 29% and 70%, depending on the subsequent treatment modalities (15).


CONCLUSIONS AND FUTURE PERSPECTIVES


Craniopharyngiomas present many unique challenges for clinicians.  Whilst controversies regarding the optimal management approach for these rare tumors still exist, the need to prevent hypothalamic morbidities associated with surgical intervention in this area is essential.

Enhanced understanding of the pathogenesis of both adamantinomatous and papillary craniopharyngiomas has led to the concept of targeted medical therapy, an area at the forefront of translational research. Optimal outcomes following the use of BRAF V600 and MEK inhibitors have been described in case reports and are a promising treatment prospect, with hope that their efficacy and safety are supported by the results of large, prospective, randomized studies.

Patients face a high burden of post-treatment morbidity due to endocrine, visual, hypothalamic, and neuropsychological complications, and mortality rates are increased compared with the general population. Obesity is one of the most significant comorbidities with often devastating sequelae; its pathogenesis is multifactorial, and its management is one of the most challenging problems clinicians have to deal with. Given the complexity of these tumors, care for these patients should be provided by an experienced multidisciplinary team.


ACKNOWLEDGEMENTS


Radiology images provided courtesy of Dr. Swarupsinh Chavda, Consultant Neuroradiologist, Queen Elizabeth Hospital Birmingham, UK.


REFERENCES


  1. Karavitaki N, Cudlip S, Adams CB, Wass JA. Craniopharyngiomas. Endocrine reviews 2006; 27:371-397
  2. Nielsen EH, Feldt-Rasmussen U, Poulsgaard L, Kristensen LO, Astrup J, Jorgensen JO, Bjerre P, Andersen M, Andersen C, Jorgensen J, Lindholm J, Laurberg P. Incidence of craniopharyngioma in Denmark (n = 189) and estimated world incidence of craniopharyngioma in children and adults. Journal of neuro-oncology 2011; 104:755-763
  3. Scagliotti V, Avagliano L, Gualtieri A, Graziola F, Doi P, Chalker J, Righini A, Korbonits M, Bulfamante G, Jacques TS, Massa V, Gaston-Massuet C. Histopathology and molecular characterisation of intrauterine-diagnosed congenital craniopharyngioma. Pituitary 2016; 19:50-56
  4. Bunin GR, Surawicz TS, Witman PA, Preston-Martin S, Davis F, Bruner JM. The descriptive epidemiology of craniopharyngioma. J Neurosurg 1998; 89:547-551
  5. Sorva R, Heiskanen O. Craniopharyngioma in Finland. A study of 123 cases. Acta Neurochir (Wien) 1986; 81:85-89
  6. Crotty TB, Scheithauer BW, Young WF, Jr., Davis DH, Shaw EG, Miller GM, Burger PC. Papillary craniopharyngioma: a clinicopathological study of 48 cases. J Neurosurg 1995; 83:206-214
  7. Buslei R, Nolde M, Hofmann B, Meissner S, Eyupoglu IY, Siebzehnrübl F, Hahnen E, Kreutzer J, Fahlbusch R. Common mutations of beta-catenin in adamantinomatous craniopharyngiomas but not in other tumours originating from the sellar region. Acta neuropathologica 2005; 109:589-597
  8. Larkin S, Karavitaki N. Recent advances in molecular pathology of craniopharyngioma. F1000Res 2017; 6:1202
  9. Müller HL, Merchant TE, Puget S, Martinez-Barbera JP. New outlook on the diagnosis, treatment and follow-up of childhood-onset craniopharyngioma. Nat Rev Endocrinol 2017; 13:299-312
  10. Alexandraki KI, Kaltsas GA, Karavitaki N, Grossman AB. The Medical Therapy of Craniopharyngiomas: The Way Ahead. The Journal of clinical endocrinology and metabolism 2019; 104:5751-5764
  11. Donson AM, Apps J, Griesinger AM, Amani V, Witt DA, Anderson RCE, Niazi TN, Grant G, Souweidane M, Johnston JM, Jackson EM, Kleinschmidt-DeMasters BK, Handler MH, Tan AC, Gore L, Virasami A, Gonzalez-Meljem JM, Jacques TS, Martinez-Barbera JP, Foreman NK, Hankinson TC. Molecular Analyses Reveal Inflammatory Mediators in the Solid Component and Cyst Fluid of Human Adamantinomatous Craniopharyngioma. Journal of neuropathology and experimental neurology 2017; 76:779-788
  12. Grob S, Mirsky DM, Donson AM, Dahl N, Foreman NK, Hoffman LM, Hankinson TC, Mulcahy Levy JM. Targeting IL-6 Is a Potential Treatment for Primary Cystic Craniopharyngioma. Frontiers in Oncology 2019; 9
  13. Coy S, Rashid R, Lin JR, Du Z, Donson AM, Hankinson TC, Foreman NK, Manley PE, Kieran MW, Reardon DA, Sorger PK, Santagata S. Multiplexed immunofluorescence reveals potential PD-1/PD-L1 pathway vulnerabilities in craniopharyngioma. Neuro Oncol 2018; 20:1101-1112
  14. Martinez-Barbera JP, Andoniadou CL. Biological Behaviour of Craniopharyngiomas. Neuroendocrinology 2020; 110:797-804
  15. Karavitaki N, Brufani C, Warner JT, Adams CB, Richards P, Ansorge O, Shine B, Turner HE, Wass JA. Craniopharyngiomas in children and adults: systematic analysis of 121 cases with long-term follow-up. Clin Endocrinol (Oxf) 2005; 62:397-409
  16. Gautier A, Godbout A, Grosheny C, Tejedor I, Coudert M, Courtillot C, Jublanc C, De Kerdanet M, Poirier JY, Riffaud L, Sainte-Rose C, Van Effenterre R, Brassier G, Bonnet F, Touraine P. Markers of recurrence and long-term morbidity in craniopharyngioma: a systematic analysis of 171 patients. The Journal of clinical endocrinology and metabolism 2012; 97:1258-1267
  17. Nielsen EH, Jørgensen JO, Bjerre P, Andersen M, Andersen C, Feldt-Rasmussen U, Poulsgaard L, Kristensen L, Astrup J, Jørgensen J, Laurberg P. Acute presentation of craniopharyngioma in children and adults in a Danish national cohort. Pituitary 2013; 16:528-535
  18. Müller HL, Emser A, Faldum A, Bruhnken G, Etavard-Gorris N, Gebhardt U, Oeverink R, Kolb R, Sörensen N. Longitudinal study on growth and body mass index before and after diagnosis of childhood craniopharyngioma. The Journal of clinical endocrinology and metabolism 2004; 89:3298-3305
  19. Fahlbusch R, Honegger J, Paulus W, Huk W, Buchfelder M. Surgical treatment of craniopharyngiomas: experience with 168 patients. J Neurosurg 1999; 90:237-250
  20. De Vile CJ, Grant DB, Kendall BE, Neville BG, Stanhope R, Watkins KE, Hayward RD. Management of childhood craniopharyngioma: can the morbidity of radical surgery be predicted? J Neurosurg 1996; 85:73-81
  21. Van Effenterre R, Boch AL. Craniopharyngioma in adults and children: a study of 122 surgical cases. J Neurosurg 2002; 97:3-11
  22. Cossu G, Jouanneau E, Cavallo LM, Elbabaa SK, Giammattei L, Starnoni D, Barges-Coll J, Cappabianca P, Benes V, Baskaya MK, Bruneau M, Meling T, Schaller K, Chacko AG, Youssef AS, Mazzatenta D, Ammirati M, Dufour H, Laws E, Berhouma M, Daniel RT, Messerer M. Surgical management of craniopharyngiomas in adult patients: a systematic review and consensus statement on behalf of the EANS skull base section. Acta Neurochir (Wien) 2020; 162:1159-1177
  23. Tan TSE, Patel L, Gopal-Kothandapani JS, Ehtisham S, Ikazoboh EC, Hayward R, Aquilina K, Skae M, Thorp N, Pizer B, Didi M, Mallucci C, Blair JC, Gaze MN, Kamaly-Asl I, Spoudeas H, Clayton PE. The neuroendocrine sequelae of paediatric craniopharyngioma: a 40-year meta-data analysis of 185 cases from three UK centres. European journal of endocrinology 2017; 176:359-369
  24. Buchfelder M, Schlaffer SM, Lin F, Kleindienst A. Surgery for craniopharyngioma. Pituitary 2013; 16:18-25
  25. Elliott RE, Jane JA, Jr., Wisoff JH. Surgical management of craniopharyngiomas in children: meta-analysis and comparison of transcranial and transsphenoidal approaches. Neurosurgery 2011; 69:630-643; discussion 643
  26. Carpenter R, Chamberlin G, Frazier C. The treatment of hypophyseal stalk tumours by evacuation and irradiation. Am J Roent 1937; 38:162-167
  27. Kramer S, McKissock W, Concannon JP. Craniopharyngiomas. Treatment by combined surgery and radiation therapy. J Neurosurg 1961; 18:217-226
  28. Aggarwal A, Fersht N, Brada M. Radiotherapy for craniopharyngioma. Pituitary 2013; 16:26-33
  29. Lamiman K, Wong KK, Tamrazi B, Nosrati JD, Olch A, Chang EL, Kiehna EN. A quantitative analysis of craniopharyngioma cyst expansion during and after radiation therapy and surgical implications. Neurosurgical focus 2016; 41:E15
  30. Shi Z, Esiashvili N, Janss AJ, Mazewski CM, MacDonald TJ, Wrubel DM, Brahma B, Schwaibold FP, Marcus RB, Crocker IR, Shu HK. Transient enlargement of craniopharyngioma after radiation therapy: pattern of magnetic resonance imaging response following radiation. Journal of neuro-oncology 2012; 109:349-355
  31. Rutenberg MS, Rotondo RL, Rao D, Holtzman AL, Indelicato DJ, Huh S, Morris CG, Mendenhall WM. Clinical outcomes following proton therapy for adult craniopharyngioma: a single-institution cohort study. Journal of neuro-oncology 2020; 147:387-395
  32. Rajan B, Ashley S, Thomas DG, Marsh H, Britton J, Brada M. Craniopharyngioma: improving outcome by early recognition and treatment of acute complications. International journal of radiation oncology, biology, physics 1997; 37:517-521
  33. Minniti G, Saran F, Traish D, Soomal R, Sardell S, Gonsalves A, Ashley S, Warrington J, Burke K, Mosleh-Shirazi A, Brada M. Fractionated stereotactic conformal radiotherapy following conservative surgery in the control of craniopharyngiomas. Radiotherapy and oncology : journal of the European Society for Therapeutic Radiology and Oncology 2007; 82:90-95
  34. Combs SE, Thilmann C, Huber PE, Hoess A, Debus J, Schulz-Ertner D. Achievement of long-term local control in patients with craniopharyngiomas using high precision stereotactic radiotherapy. Cancer 2007; 109:2308-2314
  35. Luu QT, Loredo LN, Archambeau JO, Yonemoto LT, Slater JM, Slater JD. Fractionated proton radiation treatment for pediatric craniopharyngioma: preliminary report. Cancer J 2006; 12:155-159
  36. Jose CC, Rajan B, Ashley S, Marsh H, Brada M. Radiotherapy for the treatment of recurrent craniopharyngioma. Clinical oncology (Royal College of Radiologists (Great Britain)) 1992; 4:287-289
  37. Frio F, Solari D, Cavallo LM, Cappabianca P, Raverot G, Jouanneau E. Ommaya Reservoir System for the Treatment of Cystic Craniopharyngiomas: Surgical Results in a Series of 11 Adult Patients and Review of the Literature. World Neurosurg 2019; 132:e869-e877
  38. Guimarães MM, Cardeal DD, Teixeira MJ, Lucio JEDC, Sanders FH, Kuromoto RK, Matushita H. Brachytherapy in paediatric craniopharyngiomas: a systematic review and meta-analysis of recent literature. Child's Nervous System 2022; 38:253-262
  39. Pollock BE, Lunsford LD, Kondziolka D, Levine G, Flickinger JC. Phosphorus-32 intracavitary irradiation of cystic craniopharyngiomas: current technique and long-term results. International journal of radiation oncology, biology, physics 1995; 33:437-446
  40. Voges J, Sturm V, Lehrke R, Treuer H, Gauss C, Berthold F. Cystic craniopharyngioma: long-term results after intracavitary irradiation with stereotactically applied colloidal beta-emitting radioactive sources. Neurosurgery 1997; 40:263-269; discussion 269-270
  41. Van den Berge JH, Blaauw G, Breeman WA, Rahmy A, Wijngaarde R. Intracavitary brachytherapy of cystic craniopharyngiomas. J Neurosurg 1992; 77:545-550
  42. Hasegawa T, Kondziolka D, Hadjipanayis CG, Lunsford LD. Management of cystic craniopharyngiomas with phosphorus-32 intracavitary irradiation. Neurosurgery 2004; 54:813-820; discussion 820-812
  43. Julow JV. Intracystic irradiation for craniopharyngiomas. Pituitary 2013; 16:34-45
  44. Kickingereder P, Maarouf M, El Majdoub F, Fuetsch M, Lehrke R, Wirths J, Luyken K, Schomaecker K, Treuer H, Voges J, Sturm V. Intracavitary brachytherapy using stereotactically applied phosphorus-32 colloid for treatment of cystic craniopharyngiomas in 53 patients. Journal of neuro-oncology 2012; 109:365-374
  45. Zhang S, Fang Y, Cai BW, Xu JG, You C. Intracystic bleomycin for cystic craniopharyngiomas in children. Cochrane Database Syst Rev 2016; 7:Cd008890
  46. Takahashi H, Yamaguchi F, Teramoto A. Long-term outcome and reconsideration of intracystic chemotherapy with bleomycin for craniopharyngioma in children. Child's nervous system : ChNS : official journal of the International Society for Pediatric Neurosurgery 2005; 21:701-704
  47. Hukin J, Steinbok P, Lafay-Cousin L, Hendson G, Strother D, Mercier C, Samson Y, Howes W, Bouffet E. Intracystic bleomycin therapy for craniopharyngioma in children: the Canadian experience. Cancer 2007; 109:2124-2131
  48. Kilday JP, Caldarelli M, Massimi L, Chen RH, Lee YY, Liang ML, Parkes J, Naiker T, van Veelen ML, Michiels E, Mallucci C, Pettorini B, Meijer L, Dorfer C, Czech T, Diezi M, Schouten-van Meeteren AYN, Holm S, Gustavsson B, Benesch M, Müller HL, Hoffmann A, Rutkowski S, Flitsch J, Escherich G, Grotzer M, Spoudeas HA, Azquikina K, Capra M, Jiménez-Guerra R, MacDonald P, Johnston DL, Dvir R, Constantini S, Kuo MF, Yang SH, Bartels U. Intracystic interferon-alpha in pediatric craniopharyngioma patients: an international multicenter assessment on behalf of SIOPE and ISPN. Neuro Oncol 2017; 19:1398-1407
  49. Hamblin R, Tsermoulas G, Karavitaki N. Craniopharyngiomas. La Presse Médicale 2021; 50:104078
  50. Albano L, Losa M, Flickinger J, Mortini P, Minniti G. Radiotherapy of Parasellar Tumours. Neuroendocrinology 2020; 110:848-858
  51. Xu Z, Yen CP, Schlesinger D, Sheehan J. Outcomes of Gamma Knife surgery for craniopharyngiomas. Journal of neuro-oncology 2011; 104:305-313
  52. Losa M, Pieri V, Bailo M, Gagliardi F, Barzaghi LR, Gioia L, Del Vecchio A, Bolognesi A, Mortini P. Single fraction and multisession Gamma Knife radiosurgery for craniopharyngioma. Pituitary 2018; 21:499-506
  53. Tsugawa T, Kobayashi T, Hasegawa T, Iwai Y, Matsunaga S, Yamamoto M, Hayashi M, Kenai H, Kano T, Mori H, Nagano O, Hasegawa S, Inoue A, Nagatomo Y, Onoue S, Sato M, Yasuda S. Gamma Knife Surgery for Residual or Recurrent Craniopharyngioma After Surgical Resection: A Multi-institutional Retrospective Study in Japan. Cureus 2020; 12:e6973-e6973
  54. Niranjan A, Kano H, Mathieu D, Kondziolka D, Flickinger JC, Lunsford LD. Radiosurgery for craniopharyngioma. International journal of radiation oncology, biology, physics 2010; 78:64-71
  55. Kobayashi T, Kida Y, Mori Y, Hasegawa T. Long-term results of gamma knife surgery for the treatment of craniopharyngioma in 98 consecutive cases. J Neurosurg 2005; 103:482-488
  56. Lee CC, Yang HC, Chen CJ, Hung YC, Wu HM, Shiau CY, Guo WY, Pan DH, Chung WY, Liu KD. Gamma Knife surgery for craniopharyngioma: report on a 20-year experience. J Neurosurg 2014; 121 Suppl:167-178
  57. Pikis S, Mantziaris G, Lavezzo K, Dabhi N, Sheehan J. Stereotactic radiosurgery for craniopharyngiomas. Acta Neurochirurgica 2021; 163:3201-3207
  58. Bremer AM, Nguyen TQ, Balsys R. Therapeutic benefits of combination chemotherapy with vincristine, BCNU, and procarbazine on recurrent cystic craniopharyngioma. A case report. Journal of neuro-oncology 1984; 2:47-51
  59. Lippens RJ, Rotteveel JJ, Otten BJ, Merx H. Chemotherapy with Adriamycin (doxorubicin) and CCNU (lomustine) in four children with recurrent craniopharyngioma. Eur J Paediatr Neurol 1998; 2:263-268
  60. Jakacki RI, Cohen BH, Jamison C, Mathews VP, Arenson E, Longee DC, Hilden J, Cornelius A, Needle M, Heilman D, Boaz JC, Luerssen TG. Phase II evaluation of interferon-alpha-2a for progressive or recurrent craniopharyngiomas. J Neurosurg 2000; 92:255-260
  61. Yeung JT, Pollack IF, Panigrahy A, Jakacki RI. Pegylated interferon-α-2b for children with recurrent craniopharyngioma. Journal of neurosurgery Pediatrics 2012; 10:498-503
  62. Goldman S, Pollack IF, Jakacki RI, Billups CA, Poussaint TY, Adesina AM, Panigrahy A, Parsons DW, Broniscer A, Robinson GW, Robison NJ, Partap S, Kilburn LB, Onar-Thomas A, Dunkel IJ, Fouladi M. Phase II study of peginterferon alpha-2b for patients with unresectable or recurrent craniopharyngiomas: a Pediatric Brain Tumor Consortium report. Neuro Oncol 2020; 22:1696-1704
  63. Aylwin SJB, Bodi I, Beaney R. Pronounced response of papillary craniopharyngioma to treatment with vemurafenib, a BRAF inhibitor. Pituitary 2016; 19:544-546
  64. Brastianos PK, Shankar GM, Gill CM, Taylor-Weiner A, Nayyar N, Panka DJ, Sullivan RJ, Frederick DT, Abedalthagafi M, Jones PS. Dramatic response of BRAF V600E mutant papillary craniopharyngioma to targeted therapy. JNCI: Journal of the National Cancer Institute 2016; 108
  65. Rostami E, Witt Nyström P, Libard S, Wikström J, Casar-Borota O, Gudjonsson O. Recurrent papillary craniopharyngioma with BRAFV600E mutation treated with neoadjuvant-targeted therapy. Acta Neurochirurgica 2017; 159:2217-2221
  66. Roque A, Odia Y. BRAF-V600E mutant papillary craniopharyngioma dramatically responds to combination BRAF and MEK inhibitors. CNS Oncology 2017; 6:95-99
  67. Himes BT, Ruff MW, van Gompel JJ, Park SS, Galanis E, Kaufmann TJ, Uhm JH. Recurrent papillary craniopharyngioma with BRAF V600E mutation treated with dabrafenib: Case report. J Neurosurg 2018; 1:1-5
  68. Rao M, Bhattacharjee M, Shepard S, Hsu S. Newly diagnosed papillary craniopharyngioma with BRAF V600E mutation treated with single-agent selective BRAF inhibitor dabrafenib: a case report. Oncotarget 2019; 10
  69. Khaddour K, Chicoine MR, Huang J, Dahiya S, Ansstas G. Successful Use of BRAF/MEK Inhibitors as a Neoadjuvant Approach in the Definitive Treatment of Papillary Craniopharyngioma. Journal of the National Comprehensive Cancer Network J Natl Compr Canc Netw 2020; 18:1590-1595
  70. Di Stefano AL, Guyon D, Sejean K, Feuvret L, Villa C, Berzero G, Desforges Bullet V, Halimi E, Boulin A, Baussart B, Gaillard S. Medical debulking with BRAF/MEK inhibitors in aggressive BRAF-mutant craniopharyngioma. Neurooncol Adv 2020; 2:vdaa141-vdaa141
  71. Juratli TA, Jones PS, Wang N, Subramanian M, Aylwin SJB, Odia Y, Rostami E, Gudjonsson O, Shaw BL, Cahill DP, Galanis E, Barker FG, 2nd, Santagata S, Brastianos PK. Targeted treatment of papillary craniopharyngiomas harboring BRAF V600E mutations. Cancer 2019; 125:2910-2914
  72. Chik CL, van Landeghem FKH, Easaw JC, Mehta V. Aggressive Childhood-onset Papillary Craniopharyngioma Managed With Vemurafenib, a BRAF Inhibitor. Journal of the Endocrine Society 2021; 5:bvab043
  73. Bernstein A, Mrowczynski OD, Greene A, Ryan S, Chung C, Zacharia BE, Glantz M. Dual BRAF/MEK therapy in BRAF V600E-mutated primary brain tumors: a case series showing dramatic clinical and radiographic responses and a reduction in cutaneous toxicity. J Neurosurg 2019:1-6
  74. Welsh SJ, Corrie PG. Management of BRAF and MEK inhibitor toxicities in patients with metastatic melanoma. Ther Adv Med Oncol 2015; 7:122-136
  75. Patel K, Allen J, Zagzag D, Wisoff J, Radmanesh A, Gindin T, Nicolaides T. Radiologic response to MEK inhibition in a patient with a WNT-activated craniopharyngioma. Pediatr Blood Cancer 2021; 68:e28753
  76. Vemurafenib and Cobimetinib in Treating Patients With BRAF V600E Mutation Positive Craniopharyngioma. https://ClinicalTrials.gov/show/NCT03224767.
  77. Tocilizumab in Children With ACP. https://ClinicalTrials.gov/show/NCT03970226.
  78. Brastianos PK, Twohy E, Geyer SM, Gerstner ER, Kaufmann TJ, Ruff M, Bota DA, Reardon DA, Cohen AL, Fuente MIDL, Lesser GJ, Campian JL, Agarwalla P, Kumthekar P, Cahill DP, Shih HA, Brown PD, Santagata S, Barker FG, Galanis E. Alliance A071601: Phase II trial of BRAF/MEK inhibition in newly diagnosed papillary craniopharyngiomas. Journal of Clinical Oncology 2021; 39:2000-2000
  79. Cohen M, Bartels U, Branson H, Kulkarni AV, Hamilton J. Trends in treatment and outcomes of pediatric craniopharyngioma, 1975-2011. Neuro Oncol 2013; 15:767-774
  80. DeVile CJ, Grant DB, Hayward RD, Stanhope R. Growth and endocrine sequelae of craniopharyngioma. Arch Dis Child 1996; 75:108-114
  81. Schoenle EJ, Zapf J, Prader A, Torresani T, Werder EA, Zachmann M. Replacement of growth hormone (GH) in normally growing GH-deficient patients operated for craniopharyngioma. The Journal of clinical endocrinology and metabolism 1995; 80:374-378
  82. Kendall-Taylor P, Jonsson PJ, Abs R, Erfurth EM, Koltowska-Haggstrom M, Price DA, Verhelst J. The clinical, metabolic and endocrine features and the quality of life in adults with childhood-onset craniopharyngioma compared with adult-onset craniopharyngioma. European journal of endocrinology 2005; 152:557-567
  83. Geffner M, Lundberg M, Koltowska-Haggstrom M, Abs R, Verhelst J, Erfurth EM, Kendall-Taylor P, Price DA, Jonsson P, Bakker B. Changes in height, weight, and body mass index in children with craniopharyngioma after three years of growth hormone therapy: analysis of KIGS (Pfizer International Growth Database). The Journal of clinical endocrinology and metabolism 2004; 89:5435-5440
  84. Boekhoff S, Bogusz A, Sterkenburg AS, Eveslage M, Müller HL. Long-term Effects of Growth Hormone Replacement Therapy in Childhood-onset Craniopharyngioma: Results of the German Craniopharyngioma Registry (HIT-Endo). European journal of endocrinology 2018; 179:331-341
  85. Daousi C, Dunn AJ, Foy PM, MacFarlane IA, Pinkney JH. Endocrine and neuroanatomic features associated with weight gain and obesity in adult patients with hypothalamic damage. Am J Med 2005; 118:45-50
  86. Stripp DC, Maity A, Janss AJ, Belasco JB, Tochner ZA, Goldwein JW, Moshang T, Rorke LB, Phillips PC, Sutton LN, Shu HK. Surgery with or without radiation therapy in the management of craniopharyngiomas in children and young adults. International journal of radiation oncology, biology, physics 2004; 58:714-720
  87. Pereira AM, Schmid EM, Schutte PJ, Voormolen JH, Biermasz NR, van Thiel SW, Corssmit EP, Smit JW, Roelfsema F, Romijn JA. High prevalence of long-term cardiovascular, neurological and psychosocial morbidity after treatment for craniopharyngioma. Clin Endocrinol (Oxf) 2005; 62:197-204
  88. Muller HL, Bueb K, Bartels U, Roth C, Harz K, Graf N, Korinthenberg R, Bettendorf M, Kuhl J, Gutjahr P, Sorensen N, Calaminus G. Obesity after childhood craniopharyngioma--German multicenter study on pre-operative risk factors and quality of life. Klin Padiatr 2001; 213:244-249
  89. Roth C, Wilken B, Hanefeld F, Schroter W, Leonhardt U. Hyperphagia in children with craniopharyngioma is associated with hyperleptinaemia and a failure in the downregulation of appetite. European journal of endocrinology 1998; 138:89-91
  90. Pinkney J, Wilding J, Williams G, MacFarlane I. Hypothalamic obesity in humans: what do we know and what can be done? Obes Rev 2002; 3:27-34
  91. Harz KJ, Muller HL, Waldeck E, Pudel V, Roth C. Obesity in patients with craniopharyngioma: assessment of food intake and movement counts indicating physical activity. The Journal of clinical endocrinology and metabolism 2003; 88:5227-5231
  92. van Iersel L, van Santen HM, Brokke KE, Bulthuis LCM, Adan RAH, van den Akker ELT. Pathophysiology and individualized treatment of hypothalamic obesity following craniopharyngioma and other suprasellar rumors: a systematic review. Endocrine reviews 2018; 40:193-235
  93. de Vile CJ, Grant DB, Hayward RD, Kendall BE, Neville BG, Stanhope R. Obesity in childhood craniopharyngioma: relation to post-operative hypothalamic damage shown by magnetic resonance imaging. The Journal of clinical endocrinology and metabolism 1996; 81:2734-2737
  94. Prieto R, Pascual JM, Barrios L. Topographic Diagnosis of Craniopharyngiomas: The Accuracy of MRI Findings Observed on Conventional T1 and T2 Images. AJNR American journal of neuroradiology 2017; 38:2073-2080
  95. Prieto R, Pascual JM, Rosdolsky M, Barrios L. Preoperative Assessment of Craniopharyngioma Adherence: Magnetic Resonance Imaging Findings Correlated with the Severity of Tumor Attachment to the Hypothalamus. World Neurosurg 2018; 110:e404-e426
  96. Müller HL, Gebhardt U, Teske C, Faldum A, Zwiener I, Warmuth-Metz M, Pietsch T, Pohl F, Sörensen N, Calaminus G. Post-operative hypothalamic lesions and obesity in childhood craniopharyngioma: results of the multinational prospective trial KRANIOPHARYNGEOM 2000 after 3-year follow-up. European journal of endocrinology 2011; 165:17-24
  97. Müller HL, Merchant TE, Warmuth-Metz M, Martinez-Barbera J-P, Puget S. Craniopharyngioma. Nature Reviews Disease Primers 2019; 5:75
  98. Puget S, Garnett M, Wray A, Grill J, Habrand JL, Bodaert N, Zerah M, Bezerra M, Renier D, Pierre-Kahn A, Sainte-Rose C. Pediatric craniopharyngiomas: classification and treatment according to the degree of hypothalamic involvement. J Neurosurg 2007; 106:3-12
  99. Holmer H, Pozarek G, Erfurth E-M, Wirfält E, Ekman B, Björk J, Popovic V. Reduced energy expenditure and impaired feeding-related signals but not high energy intake reinforces hypothalamic obesity in adults with childhood onset craniopharyngioma. The Journal of clinical endocrinology and metabolism 2010; 95:5395-5402
  100. Piguel X, Abraham P, Bouhours-Nouet N, Gatelais F, Dufresne S, Rouleau S, Coutant R. Impaired aerobic exercise adaptation in children and adolescents with craniopharyngioma is associated with hypothalamic involvement. European journal of endocrinology 2012; 166:215-222
  101. Goldstone AP, Patterson M, Kalingag N, Ghatei MA, Brynes AE, Bloom SR, Grossman AB, Korbonits M. Fasting and postprandial hyperghrelinemia in Prader-Willi syndrome is partially explained by hypoinsulinemia, and is not due to peptide YY3-36 deficiency or seen in hypothalamic obesity due to craniopharyngioma. The Journal of clinical endocrinology and metabolism 2005; 90:2681-2690
  102. Elowe-Gruau E, Beltrand J, Brauner R, Pinto G, Samara-Boustani D, Thalassinos C, Busiah K, Laborde K, Boddaert N, Zerah M, Alapetite C, Grill J, Touraine P, Sainte-Rose C, Polak M, Puget S. Childhood craniopharyngioma: hypothalamus-sparing surgery decreases the risk of obesity. The Journal of clinical endocrinology and metabolism 2013; 98:2376-2382
  103. Mortini P, Gagliardi F, Bailo M, Spina A, Parlangeli A, Falini A, Losa M. Magnetic resonance imaging as predictor of functional outcome in craniopharyngiomas. Endocrine 2016; 51:148-162
  104. Duan D, Wehbeh L, Mukherjee D, Hamrahian AH, Rodriguez FJ, Gujar S, Khalafallah AM, Hage C, Caturegli P, Gallia GL, Ahima RS, Maruthur NM, Salvatori R. Preoperative BMI Predicts Postoperative Weight Gain in Adult-onset Craniopharyngioma. The Journal of clinical endocrinology and metabolism 2021; 106:e1603-e1617
  105. Bretault M, Boillot A, Muzard L, Poitou C, Oppert JM, Barsamian C, Gatta B, Muller H, Weismann D, Rottembourg D, Inge T, Veyrie N, Carette C, Czernichow S. Clinical review: Bariatric surgery following treatment for craniopharyngioma: a systematic review and individual-level data meta-analysis. The Journal of clinical endocrinology and metabolism 2013; 98:2239-2246
  106. Weismann D, Pelka T, Bender G, Jurowich C, Fassnacht M, Thalheimer A, Allolio B. Bariatric surgery for morbid obesity in craniopharyngioma. Clin Endocrinol (Oxf) 2013; 78:385-390
  107. Wijnen M, Olsson DS, van den Heuvel-Eibrink MM, Wallenius V, Janssen JA, Delhanty PJ, van der Lely AJ, Johannsson G, Neggers SJ. Efficacy and safety of bariatric surgery for craniopharyngioma-related hypothalamic obesity: a matched case-control study with 2 years of follow-up. Int J Obes (Lond) 2017; 41:210-216
  108. van Santen SS, Wolf P, Kremenevski N, Boguszewski CL, Beiglböck H, Fiocco M, Wijnen M, Wallenius VR, van den Heuvel-Eibrink MM, van der Lely AJ, Johannsson G, Luger A, Krebs M, Buchfelder M, Delhanty PJD, Neggers S, Olsson DS. Bariatric Surgery for Hypothalamic Obesity in Craniopharyngioma Patients: A Retrospective, Matched Case-Control Study. The Journal of clinical endocrinology and metabolism 2021; 106:e4734-e4745
  109. Eveslage M, Calaminus G, Warmuth-Metz M, Kortmann RD, Pohl F, Timmermann B, Schuhmann MU, Flitsch J, Faldum A, Müller HL. The Postopera tive Quality of Life in Children and Adolescents with Craniopharyngioma. Deutsches Arzteblatt international 2019; 116:321-328
  110. Poretti A, Grotzer MA, Ribi K, Schonle E, Boltshauser E. Outcome of craniopharyngioma in children: long-term complications and quality of life. Dev Med Child Neurol 2004; 46:220-229
  111. Muller HL, Faldum A, Etavard-Gorris N, Gebhardt U, Oeverink R, Kolb R, Sorensen N. Functional capacity, obesity and hypothalamic involvement: cross-sectional study on 212 patients with childhood craniopharyngioma. Klin Padiatr 2003; 215:310-314
  112. Ondruch A, Maryniak A, Kropiwnicki T, Roszkowski M, Daszkiewicz P. Cognitive and social functioning in children and adolescents after the removal of craniopharyngioma. Child's nervous system : ChNS : official journal of the International Society for Pediatric Neurosurgery 2011; 27:391-397
  113. Ozyurt J, Muller HL, Thiel CM. A systematic review of cognitive performance in patients with childhood craniopharyngioma. Journal of neuro-oncology 2015; 125:9-21
  114. Fjalldal S, Holmer H, Rylander L, Elfving M, Ekman B, Osterberg K, Erfurth EM. Hypothalamic involvement predicts cognitive performance and psychosocial health in long-term survivors of childhood craniopharyngioma. The Journal of clinical endocrinology and metabolism 2013; 98:3253-3262
  115. Duff J, Meyer FB, Ilstrup DM, Laws ER, Schleck CD, Scheithauer BW. Long-term outcomes for surgically resected craniopharyngiomas. Neurosurgery 2000; 46:291-302; discussion 302-295
  116. Qiao N. Excess mortality after craniopharyngioma treatment: are we making progress? Endocrine 2019; 64:31-37
  117. Erfurth EM, Holmer H, Fjalldal SB. Mortality and morbidity in adult craniopharyngioma. Pituitary 2013; 16:46-55
  118. Wijnen M, Olsson DS, van den Heuvel-Eibrink MM, Hammarstrand C, Janssen J, van der Lely AJ, Johannsson G, Neggers S. Excess morbidity and mortality in patients with craniopharyngioma: a hospital-based retrospective cohort study. European journal of endocrinology 2018; 178:93-102
  119. Boekhoff S, Bison B, Genzel D, Eveslage M, Otte A, Friedrich C, Flitsch J, Müller HL. Cerebral Infarction in Childhood-Onset Craniopharyngioma Patients: Results of KRANIOPHARYNGEOM 2007. Frontiers in Oncology 2021; 11
  120. Wijnen M, Olsson DS, van den Heuvel-Eibrink MM, Hammarstrand C, Janssen J, van der Lely AJ, Johannsson G, Neggers S. The metabolic syndrome and its components in 178 patients treated for craniopharyngioma after 16 years of follow-up. European journal of endocrinology 2018; 178:11-22
  121. Daubenbuchel AM, Hoffmann A, Gebhardt U, Warmuth-Metz M, Sterkenburg AS, Muller HL. Hydrocephalus and hypothalamic involvement in pediatric patients with craniopharyngioma or cysts of Rathke's pouch: impact on long-term prognosis. European journal of endocrinology 2015; 172:561-569


Disorders of Growth Hormone in Childhood

ABSTRACT


Growth is a fundamental process of childhood and growth disorders remain one of the commonest reasons for referral to a pediatric endocrinologist. Growth can be divided into four phases – fetal, infancy, childhood and the pubertal phase with different hormonal components influencing growth at each stage. The GH-IGF1 axis plays a major role in the childhood phase of growth with a significant role alongside sex steroids during puberty while in infancy thyroid hormone and nutrition are vital. Although an uncommon cause of short stature disorders of the GH-IGF1 axis are extremely important due to the effectiveness of recombinant human growth hormone therapy for the child with GH deficiency (GHD). Here we review the diagnosis of growth hormone deficiency through a combination of auxology, biochemistry, imaging, and genetic testing. Particular focus is given to the accuracy of IGF-1/BP3 for diagnosis as well as the known problems with GH stimulation tests and GH assays. Isolated GHD is caused by mutations in GH1, BTK, and RNPC3 while GHD seen as part of multiple pituitary hormone deficiency is known to be caused by mutations in a wide variety of genes. A variety of structural malformations of the brain can be associated with congenital GHD with the commonest being the presence of an ectopic posterior pituitary or Septo-optic dysplasia. Acquired GHD is rarer and caused by tumors, radiotherapy, hypophysitis, and traumatic brain injury.  Treatment with recombinant human GH is highly efficacious in improving height in children with GH deficiency and extremely safe. Short stature disorders are, rarely, also caused by a variety of other disorders of the GH-IGF1 axis. Resistance to growth hormone is seen in Laron syndrome and in mutations in IGF1 and IGF1R while decreased bioavailability of IGF1 is seen in ALS deficiency and PAPPA2 deficiency. Treatment with recombinant human IGF1 (rhIGF1) is available for those with IGF-I deficiency caused by either Laron syndrome or IGF1 mutations. rhIGF1 is effective in improving height but treatment is less effective than the use of GH to treat GH deficiency.  The role of IGF1 in pre-natal growth is highlighted by the phenotype of patients with IGF1R or IGF1 mutations where pre-natal growth is commonly impaired and children born small for gestational age. GH excess is much rarer than GH deficiency in childhood and can be caused by pituitary adenomas, optic nerve gliomas (seen predominantly with NF1), McCune Albright syndrome, or Carney complex. Treatment is with surgery, somatostatin analogs, or GH receptor antagonists.


CASE STUDY


 A 5-year-old girl was referred to her local community pediatrician by her health visitor with concerns about growth and poor calorie intake. Height at presentation was 91.5 cm (-4.1 SD) with weight 12.5 kg (-3.4 SD) and head circumference 48.8 cm (-2.5 SD).  Her teeth were affected by multiple caries which made chewing hard foods painful and she therefore ate only soft foods. Development was reported to be normal and she was performing well in school. Her parents had noticed loud snoring and tonsils were enlarged on examination.


She was born at term by vaginal delivery with a birth weight of 3.5kg and was the youngest of 6 children. The parents were consanguineous (first cousins) and there was a family history of short stature in distant cousins. Mother was 147 cm tall (-2.7 SD) and father 165.1 cm (-1.5 SD). There was a history of diabetes mellitus type 2, diabetic nephropathy and thalassemia in mother and the father had a history of recurrent kidney stones. 


On review in the endocrinology clinic prominent forehead, depressed nasal bridge and a high-pitched voice were noted.  General investigations (detailed below) were normal; however, IGF-I and IGFBP-3 concentrations were low with high basal GH and peak GH concentrations (the latter >40µg/L). The combination of low IGF-I with raised GH concentrations suggested a diagnosis of GH insensitivity. In view of the history of snoring the patient was referred to an ENT surgeon who noted large prolapsing tonsils with mild apneic episodes on sleep study. Due to the propensity of IGF-I therapy to induce tonsillar hypertrophy, she underwent tonsillectomy.


Treatment with recombinant human IGF-I was started at the age of 6 years and 1 month initially with 0.6 mg (38 mcg/kg/) BD, increasing after 1 week to 1.1 mg (70 mcg/kg) BD and then to 1.7 mg (108 mcg/kg) BD. There were no problems with hypoglycemia. Height velocity increased from 3.6 cm/year to 10.3 cm/year over the first year of treatment. Sequencing of the GH receptor identified a known intronic point (A>G) mutation between exons 6 and 7 in which leads to inclusion of a pseudoexon and an additional 36 amino acids in the extracellular domain of the GHR.


At the age of 9 years and 3 months she was noted to be at breast stage 3 and in order to preserve height potential she has been treated with GnRH analogue (Zoladex LA). The IGF-I dose has been increased to maintain dose in the range 100 – 120 mcg/kg/BD and at 10 years 3 months height is 125.8 cm (-2.1 SD) with weight 32 kg (-0.2 SD). There has been some lipophypertrophy around the injection sites and she required an adenoidectomy due to a recurrence of her snoring (with daytime somnolescence) caused by a large obstructing adenoidal pad.


Baseline Investigations

Serum electrolytes, urea, creatinine, liver function tests, calcium, phosphate, hemoglobin – all normal

Karyotype 46 XX

TSH 2.2 mU/L (0.3 -5.0) free T4 17 pmol/L (11 - 24)

Prolactin 174 mU/l (85 – 250)

IGF-I <25 ng/mL (55 – 280)

IGFBP-3 0.7 mg/L (1.5 – 3.4)

ALS 3.2 mg/L (2.3 – 11)

Fasting glucose 4.0 mmol/L Insulin 2.1 mIU/L (2.3 - 26)

Skeletal survey – no evidence of skeletal dysplasia

Bone Age delayed by 18 months


Arginine stimulation Test

Time (min)       Growth Hormone (µg/L)

-15                   19.3

0                      4.0

15                    4.8

30                    14

60                    >40

90                    >40

120                  15.6


Standard Synacthen Test

Time (min)       Cortisol (nmol/L)

0 min               213

30 min             624

60 min             742


GnRH Test at age 5 years

Time                LH (IU/L)         FSH (IU/L)

0                      <0.1                 1.7

30                    2.7                   14

60                    3.3                   18


INTRODUCTION


Growth is a fundamental process of childhood. It can be divided into four phases – fetal, infancy, childhood, and pubertal growth. Although growth occurs as a continuum, the endocrine control of each phase is distinct. The fetal phase includes the fastest period of growth with a crown-rump velocity of 62cm/year during the second trimester. Growth during this phase is dependent upon placental function and maternal nutrition in addition to hormonal factors especially IGF-I, IGF-II and insulin (1,2).  Although size at birth (and hence fetal growth) is profoundly affected by IGF-I deficiency during fetal life (3), the effects of congenital GH deficiency are much less marked with a mild reduction in birth size (4). 


Fetal Phase


During the first year of life, growth declines from an initial velocity of around 25cm/year to around 10cm/year. Previously it has been thought that during this period growth hormone did not have a significant influence on growth however it is now clear that children with growth hormone deficiency display reduced height velocity from birth (5). In addition to growth hormone, thyroid hormone and adequate nutrition are vital for normal growth during infancy.


Infancy Phase


During the first two years of life there is a significant period of catch-up or catch-down growth so while size at birth is not well correlated with parental height, by two years of age the correlation between parental and child heights significantly improves (6). It has been hypothesized that this catch up growth is the result of a central mechanism which detects the difference between the actual and expected size and acts to increase growth velocity (7). No experimental evidence exists for this hypothesis. The second hypothesis on the origin of this catch up/down growth is that it arises from alterations in growth plate senescence. Catch down growth is associated with a reduction in the number of stem cell divisions within the growth plate while catch up growth would be due to a compensatory increase in the number of stem cell divisions within the growth plate (8).


Childhood Phase


There is a gradual transition from the infancy phase into the childhood phase of growth from 6 months to 3 years of age. Prepubertal growth velocity is relatively constant between 4-7 cm/year with the lowest growth velocity of life occurring immediately before the onset of puberty. During childhood growth is mainly controlled by the influence of the GH-IGF-I axis along with thyroid hormone.


Pubertal Growth


The final phase of growth is puberty – the period of transition from the pre-pubertal state to the full development of secondary sexual characteristics and achievement of final height. Puberty begins with the onset of activity within the hypothalamic-pituitary-gonadal axis leading to the production of androgens (in males) and estrogen (in females). In males the first sign of pubertal development is enlargement of the testes while in females it is development of breast buds. The production of androgens and estrogen is associated with an increase in activity within the GH-IGF-I axis. Administration of testosterone to boys increased both GH and IGF-I concentrations (9) but this effect is dependent upon aromatization as co-administration of an estrogen receptor antagonist (10) or administration of dihydrotestosterone (11) (the active form of testosterone that cannot be aromatized) does not lead to an increase in GH or IGF-I concentrations. In girls there is also an increase in IGF-I levels and GH secretion during puberty but the mechanisms underlying this are less clear. Administration of oral or transdermal estrogen induces a decline in serum IGF-I concentrations and a consequent increase in GH secretion (12).  


Fusion of the epiphyseal growth plates is induced by the activity of estrogen on ERα as patients with mutations in the genes encoding Erα (13) or aromatase enzyme (14) result in failure of fusion of the epiphyses and tall stature.


This chapter will firstly discuss the physiology of the GH-IGF-I axis along with signal transduction of GH and IGF-I and then consider the diagnosis and treatment of growth hormone deficiency before discussing individual pathological conditions associated with both GH deficiency and GH excess. Disorders leading to GH deficiency have been divided into congenital and acquired. 


GH-IGF-I AXIS


Physiology of the GH-IGF-I Axis


Release of Growth Hormone Releasing Hormone (GHRH) from the hypothalamus regulates the secretion of GH from the anterior pituitary both by increasing GH1 gene transcription and by promoting the secretion of stored GH. GHRH release is pulsatile and influenced by somatostatin and Ghrelin. Ghrelin is a 28 amino acid peptide produced in the stomach (15) and acts via the GH secretagogue receptor (GHSR). The active hormone is the octanoylated form produced by Ghrelin O-acetyltransferase(16) and is cleaved from the 117 amino acid preprohormone. In addition to the role in GH secretion Ghrelin also acts as an appetite stimulant (17) and stimulates the secretion of insulin (18), ACTH (19), and prolactin (19). In vivo the action of Ghrelin requires an intact GHRH system to influence GH secretion (20) but in vitro is capable of directly stimulating GH (15). Somatostatin is a peptide derived from pre-pro-somatostatin within neurons of the anterior periventricular nucleus which project to the median eminence. There are two main forms of somatostatin – 14 and 28 amino acid variants.  It acts via the somatostatin receptors of which there are 5 subtypes (SSTR1-5). The anterior pituitary expresses SSTR1, 2, 3 and 5 (21). Somatostatin acts to decrease the secretion of GH by inhibiting GHRH secretion, directly inhibiting GH secretion in the anterior pituitary (22), antagonizing the activity of Ghrelin (20) as well as inhibiting its secretion (23). Somatostatin tone determines trough levels of GH and reductions in somatostatin tone are a major factor in determining the time of a pulse of GH.  GH secretion is also stimulated by hypoglycemia and exercise. A summary of the factors influencing GH secretion is given in Figure 1.


GH is released from the somatotrophs of the anterior pituitary in a pulsatile manner with the pulses predominantly overnight, increasing in amplitude with age (24). The pulse amplitude is maximal in the pubertal years consistent with the raised IGF-I levels and growth velocity at this time (25).  In males there is greater diurnal variation in peak amplitude, with higher peaks overnight and a lower baseline GH level compared to females. Overall GH production is higher in females. GH peak amplitude is linked to IGF-I concentrations while nadir GH is linked to waist-hip ratio (26).  


Growth Hormone and GH signal Transduction


Growth Hormone (GH) is encoded  by the GH1 gene located at chromosome 17q23.3 and is a 191 amino acid single chain polypeptide (27). There are 20 and 22kDa isoforms of GH generated by alternative splicing (the smaller isoform lacks amino acids 32-46) with the 20kDa accounting for around 10-20% of circulating GH (28).  While GH1 is expressed within the anterior pituitary a 20kDa variant of GH is encoded by the GH2 gene but this is expressed in placenta and not in the pituitary (29).

Figure 1. Physiology of the GH-IGF-I Axis. Release of GHRH from the hypothalamus is under the control of somatostatin (inhibitory) and Ghrelin (stimulatory). Alterations in GHRH tone led to pulsatile release of GH from the anterior pituitary. GH has widespread effects on muscle, fat and in the growth plate. IGF-I is produced in liver and in local tissues in response to GH stimulation. Red lines indicate feedback loops. Figure reproduced and adapted from Butcher I Molecular and Metabolomic Mechanisms Affecting Growth in Children Born Small for Gestational Age PhD thesis University of Manchester 2013.

In the circulation GH is bound to Growth Hormone Binding Protein (GHBP). GHBP is generated either by proteolysis cleavage of the extracellular domain of the growth hormone receptor (GHR) by metzincin metalloproteinase tumor necrosis factor-α converting enzyme (30) or by alternative splicing of the GHR (31). The 22kDa isoform of GH has the highest affinity for GHBP with the 20kDa and placental GH having a lower affinity (32).  GHBP has a molecular mass of 60kDa and acts to prolong the half-life of GH with an increase from 11 minutes to 80 minutes (33). GHBP also acts to maintain the circulating pool of GH within the vasculature (34), reducing the ability of the circulating pool of GH to bind to peripheral GHRs.


The actions of GH are mediated via the GHR, a 620 amino acid protein containing a 246-residue extracellular domain, a single24 amino acid transmembrane helix and a 350 amino acid intracellular domain. The GHR gene is located on chromosome 5p13 and contains 10 exons. The GHR exists in a pre-dimerized form on the cell surface. In contrast to previous models, it is now recognized that dimerization per se is insufficient to initiate signaling (35).  GH binds to the GHR via two binding sites – initial binding is via the high affinity site 1 followed by binding to the low affinity binding site 2 (36). GH binding induces a conformational change in the dimerized GHR including rotation of one of the GHR subunits (see Figure 2).  This results in locking together of the extracellular receptor-receptor interaction domain and repositioning of the box 1 motifs in the intracellular domain increasing the distance between them. In turn this leads to repositioning of tyrosine kinases, including JAK2 (37). This repositioning is crucial to JAK2 activation. In the inactive state two JAK2 molecules (each attached to one of two dimerized GHRs) are positioned so that the kinase domain of one JAK2 molecule interacts with the inhibitory pseudokinase domain of the other JAK2 molecule. After repositioning, due to the conformational change induced by GH binding, the inhibitory kinase-pseudokinase interaction is lost and the kinase domains of each JAK2 molecule interact with each other leading to JAK2 activation (38).


Activation of the GHR results in JAK2 mediated phosphorylation of the signal transducers and activator of transcription proteins (STAT), including STAT1, STAT3, STAT5A and STAT5B. STAT5A and 5B are recruited to the phosphorylated GHR where their Src homology 2 (SH2) domain is phosphorylated by JAK2. STAT5A/B then homo- or heterodimers and translocate to the nucleus (37,39) (see Figure 3). Activation of STAT1 and STAT3 is also via phosphorylation by JAK2 but this does not require recruitment to the GHR.  JAK2 also phosphorylates the Src homology domain of SHC (leading to activation of the mitogen activated protein kinase pathway) and the insulin receptor substrates (IRS-1, IRS-2 and IRS-3), which, in turn activate phosphatidylinositol-3 kinase and induces translocation of GLUT4 to the membrane. In addition to activation of JAK2, activation of the GHR also leads to direct activation of the Src family kinases, which are capable of activating the mitogen activated protein kinase pathway (40), and activation of protein kinase C via phospholipase C. Activation of protein kinase C stimulates lipogenesis, c-fos expression and increases intracellular calcium levels by activating type 1 calcium channels.

Figure 2. Growth hormone binding to the extracellular domain of the growth hormone receptor reorients the pre-existing homodimer so that one growth hormone receptor subunit rotates relative to the other. This structural reorientation is transmitted through the transmembrane domain resulting in a repositioning of tyrosine kinases bound to the cytoplasmic domain of the receptors. The distance between the box 1 motifs increases between inactive and active states and this movement is fundamental to activation of JAK2. Phosphorylation of JAK2 in turn leads to phosphorylation of STAT molecules, activation of the MAPK cascade and activation of IRS-1. STAT5a and STAT5b homo/heterodimerize and translocate to the nucleus. Figure kindly supplied by Dr Andrew Brooks, Institute for Molecular Bioscience, The University of Queensland.

GH signal transduction is regulated via several mechanisms: JAK2 is autoinhibitory with the pseudokinase domain inhibiting the catalytic domain (41), SHP1 binds to and dephosphorylates JAK2 in response to GH and GH also phosphorylates the transmembrane signal regulatory glycoprotein SIRPα1 which dephosphorylates JAK2 and the GHR.


The net result of GH signal transduction is the transcription of a set of GH dependent genes and the production of IGF-I the combination of which mediates the actions of GH including effects on cell proliferation, bone density, glucose homeostasis and serum lipids.


Insulin Like Growth Factors, Their Binding Proteins and Signal Transduction


INSULIN LIKE GROWTH FACTORS


The two insulin-like growth factors, IGF-I and IGF-II, are single chain polypeptide hormones sharing 50% homology with insulin. IGF-I is a 70 amino acid 7.5 kDa protein with four domains – A, B, C and D. The prohormone also contains a c-terminal peptide that is cleaved in the Golgi apparatus before secretion. IGF-II is a 67 amino acid peptide also with a molecular weight of 7.5 kDa. The mitogenic and, in part, the metabolic effects of GH are mediated via IGF-I rather than IGF-II.  The IGFs circulate bound to the IGF binding proteins (IGFBPs), of which there are six classical high affinity IGFBPs. The IGFs form a ternary complex with an IGFBP and the Acid Labile Subunit (ALS), an 85kDa protein secreted by the liver.  99% of serum IGF-I is bound to a ternary complex which acts to prolong the half-life of IGF-I (42). IGF-I is produced in both the liver and in peripheral tissues and thus can act in an autocrine and paracrine manner.


IGF RECEPTORS


The IGF-1R is a transmembrane heterotetramer consisting of consisting of two extracellular α chains and two membrane-spanning β chains linked by several disulphide bonds (43). Ligand binding sites are present in the α subunits while the β subunits contain the juxtamembrane domain, tyrosine kinase domain and a carboxy terminal domain (44). Ligand binding to the α subunit activates the intrinsic tyrosine kinase activity of the β subunit which leads to autophosphorylation of tyrosine kinases in the juxtamembrane, tyrosine kinase and carboxy terminal domains. This autophosphorylation provides docking sites for substrates including the insulin receptor substrates (IRS-1, -2, -3, -4) and Shc. IRS-1 and Shc recruit the growth factor receptor bound protein 2 that associates with son of sevenless to activate the MAPK pathway. IRS-1 also activates PI3K via its regulatory subunit, p85, leading to activation of AKT which phosphorylates BAD and activates mTOR leading to inhibition of apoptosis and stimulation of proliferation. A summary of IGF-I signal transduction is given in Figure 3.


Mouse studies have delineated the relative contribution to growth of the GH-IGF system – deletion of Igf1 or Igf2 results in a 40% reduction in birth weight with a reduction of 55% where Igf1r is deleted (45). Deletion of Igf1 with Igf1r or Igf2 leads to a 70% reduction in birth weight and death from respiratory distress at birth (45) whereas the Igf2r appears to negatively regulate growth as deletion of this gene results in an increase in size to 130% of wild type. IGF-I is produced in both the liver and in peripheral tissues and thus can act in an autocrine and paracrine manner. It appears that autocrine/paracrine IGF-I is more important for growth than liver derived IGF-I as a hepatic specific deletion of Igf1 in mouse resulted in no impairment of growth despite a 75% reduction in serum IGF-I concentrations (46) while a triple liver specific deletion of Igf1/Igfals/Igfbp3 resulted in a 97.5% reduction in circulating IGF-I concentrations with a 6% decrease in body length (47).

Figure 3. IGF-I Signal Transduction. Binding of IGF-I leads to phosphorylation and activation of IRS-1 which, in turn, activates the PI3K and MAPK pathways.

DIAGNOSIS OF GROWTH HORMONE DEFICIENCY IN CHILDHOOD


The diagnosis of growth hormone deficiency in childhood is multifactorial process and includes 1) auxological assessment 2) biochemical tests of the GH-IGF-I axis and 3) radiological evaluation of the hypothalamus and pituitary (normally with MR imaging). Prior to evaluation of the GH-IGF-I axis in a short child other diagnosis such as familial short stature, hypothyroidism, Turner syndrome, chronic illness such as Crohn’s disease and skeletal dysplasias should be considered and evaluated appropriately. Patients to be evaluated for growth hormone deficiency include (48,49):


  1. Severe short stature (defined height >3 SD below mean)
  2. Height more than 1.5 SD below mid parental height
  3. Height >2 SD below mean with height velocity over 1 year >1 SD below the mean for chronological age or a decrease of more than 0.5 SD in height over 1 year in children aged >2 years
  4. In the absence of short stature – a height velocity more than 2 SD below mean over 1 year or >1.5 SD below mean sustained over 2 years
  5. Signs indicative of an intracranial lesion or history of brain tumor, cranial irradiation, or other organic pituitary abnormality.
  6. Radiological evidence of a pituitary abnormality
  7. Signs and/or symptoms of neonatal GHD


Etiology


Disorders of GH can be divided into those that cause growth hormone deficiency or growth hormone excess. In childhood growth hormone deficiency is rare with an incidence of 1 in 4000 while the incidence of childhood GH excess is not known but only around 200 cases have been reported in the literature (50).  Causes of GH deficiency are listed in Table 1.


Table 1. Causes of Growth Hormone Deficiency

Cause

Examples

Idiopathic


Genetic

GHRHR mutations

GH1 mutations

Structural brain malformations

Pituitary stalk interruption syndrome

Rathke’s cyst

Agenesis of corpus callosum

Septo-optic dysplasia

Holoprosencephaly

Midline Tumors

Craniopharyngioma

Optic nerve Glioma

Germinoma

Pituitary adenoma

Cranial Irradiation


Traumatic Brain Injury

Road Traffic Accident


CNS infections


Inflammation and Auto-immunity

Sarcoidosis

Langerhans Cell Histiocytosis

Hypophysitis

Psychosocial deprivation


Clinical Presentation of GH Deficiency


GH deficiency can present either in isolation (isolated GHD - IGHD) or in combination with other pituitary hormone insufficiencies (multiple pituitary hormone deficiency - MPHD). In the neonatal period MPHD typically presents with reduced penile size, episodes of hypoglycemia, and prolonged unconjugated hyperbilirubinemia. MPHD is associated with breech delivery, adverse incidents in pregnancy, and admission to the newborn intensive care unit (51).  Children with severe growth hormone deficiency often appear young for their age and have midface hypoplasia and increased truncal adiposity (see Figure 4). The major clinical feature of GH deficiency is growth failure; typically, this occurs after the first year of life but may be apparent earlier in severe GHD. The earliest manifestations are a reduction in height velocity followed by a reduction in height standard deviation score (SDS) adjusted for mean parental height SDS. The child’s height SDS will ultimately fall below -2SD with the time taken to achieve this depending on the severity and duration of GHD.

Figure 4. Child with Laron syndrome. Short stature with typical facial appearance of GH insensitivity with midface hypoplasia, this finding is common to GH deficiency as well.

Biochemical Assessment of the GH-IGF-I Axis


Multiple assays have been developed to measure GH in serum. A consensus statement of the GH-IGF-I research society in 2000 recommended that assays used should use monoclonal antibodies to measure the 22kDa variant of human GH and that the reference preparation should be the WHO standard 88/624 (a recombinant human 22kDa GH at 3 IU = 1mg) (48,52).


Growth Hormone Stimulation Tests and GH Profiles


A number of growth hormone stimulation tests have been developed and can be divided into screening tests or definitive tests. Screening tests include exercise, fasting, levodopa, and clonidine and are characterized by low toxicity, ease of administration but low specificity. Definitive tests include the insulin tolerance test, glucagon, and arginine stimulation tests. Using the auxological criteria above a peak GH concentration below 10µg/L has traditionally been used to support the diagnosis of GHD. GHD is not a dichotomous state but exists as a continuum from severe GHD to normality and there is known to be an overlap in peak GH concentrations between normal children and those with GHD.  For this reason, and due to the advent of more sensitive monoclonal antibodies based on the recombinant human GH reference standard, some units will use a more stringent cut-off for the diagnosis of GHD e.g., 7µg/L. Where the diagnosis is isolated idiopathic GHD two pharmacological tests are required. Only one provocative test of GH secretion is required in children with one or more of the following criteria:


  1. Central nervous system pathology affecting the pituitary or hypothalamus
  2. A history of cranial irradiation
  3. An identified pathological genetic variant known to be associated with GHD
  4. Multiple pituitary hormone deficiency


INSULIN TOLERANCE TEST


The gold standard test is considered to be the Insulin Tolerance Test.  This test relies upon an intravenous dose of insulin to induce hypoglycemia with a subsequent rise in GH expected as part of the counter regulatory response to hypoglycemia (53). Cortisol secretion also rises in response to hypoglycemia and thus this test also assesses the hypothalomo- pituitary-adrenal axis. The patient is required to fast overnight and, in the morning, a reliable intravenous line is inserted following which an insulin dose of 0.1units/kg is administered. The dose is reduced to 0.05 units/kg in children under 4 and where there is known or likely multiple pituitary hormone deficiency. This test is generally not recommended for infants and in this group the dose of insulin would be reduced further to 0.01units/kg. After administration of insulin there is careful bedside monitoring of blood glucose concentration and once the blood glucose has reached <2.6 mmol/L (47 mg/dL) the patient eats a high carbohydrate meal. Administration of 10% glucose at 2ml/kg may be required in order to restore adequate blood glucose concentrations. This should be prepared in advance of the start of the test along with an appropriate dose of IV hydrocortisone (this should be given after hypoglycemia where there is known adrenal insufficiency or where hypoglycemia is more severe or prolonged than expected). 50% dextrose is recommended by some for the correction of hypoglycemia during the test but administration of such hyperosmolar solutions has been associated with adverse outcome (54) including cerebral edema. Due to the risks associated with this test it should only ever be performed in a center with appropriate experience.


GLUCAGON TEST


The glucagon test is one of a number of safer alternative GH provocation tests. Intramuscular administration of glucagon leads to an increase in GH due to a rise in insulin levels compensating for the increase in serum glucose (55). Maximum GH peak occurs 2-3 hours after injection of glucagon. Although less common than with the insulin tolerance test hypoglycemia can occur with the glucagon stimulation test where there is an excessive insulin response. There should therefore be blood glucose monitoring throughout the test and a meal consumed at the end of the test. Nausea and vomiting are other common side effects.


ARGININE STIMULATION TEST


Arginine administration stimulates the release of GH by inhibiting somatostatin release. Following an overnight fast arginine is administered intravenously at 0.5g/kg (maximum dose 30g) over 30 minutes. Unlike glucagon or insulin, arginine does not directly cause hypoglycemia and thus the arginine stimulation test may be safer, particularly for those patients with predisposition to hypoglycemia. Examples of patients where an arginine test would be suitable where the insulin or glucagon-based tests would not be suitable include patients with diabetes and a history of seizures or children with disorders of cerebral glucose uptake (GLUT2 deficiency) where the patient should be continuously ketotic. Arginine can be combined with L-dopa or GHRH. For combined tests, particularly the arginine-GHRH test it is important to have a test specific cut off for the diagnosis of GHD as with a powerful stimulus of GH secretion a higher cut off is required (a normal peak GH response for arginine-GHRH has been defined at 19-120 µg/L(56)).  GHRH can be used on its own as a provocative agent but is greatly affected by variations in somatostatin tone leading to a highly variable response. In addition, false negative tests may occur in children with hypothalamic damage.


Oral agents used in GH stimulation tests include clonidine and L-Dopa. Both clonidine and L-Dopa act by increasing adrenergic tone to increase GHRH and decrease somatostatin levels. A fast of 6 hours is required prior to the test. Since clonidine is a drug used to lower blood pressure hypotension is a potential side effect. Drowsiness is also a frequent occurrence during this test.


INTERPRETATION


Significant problems exist with GH stimulation tests – peak GH varies according to the stimulus used (57), false positive results in normal pre-pubertal children are frequent (56), the tests have poor reproducibility and there is also variability in GH level with GH assay used (58). Peak GH is also reduced in obesity and for adults BMI specific cut-offs for the diagnosis of GHD have been developed (59).


Low GH levels to provocation tests frequently occur in the immediate peripubertal period. Given the known action of the sex steroids to augment endogenous GH secretion this has led some pediatric endocrinologists to prime children of peripubertal age but without clinical signs of puberty undergoing GH stimulation testing with exogenous sex steroids (diethylstilbestrol, ethinylestradiol and testosterone can be used). Around 50% of pediatric endocrinologists routinely use priming for GH stimulation tests(60). Some endocrinologists will prime boys >9 years and girls >8 years others will prime only those with a delayed puberty >13-14 years in boys and > 11 or 12 years in girls. In one study by Marin et al(61) where 61% of healthy prepubertal children failed to demonstrate a peak GH >7µg/L to three GH provocative tests (exercise, insulin and arginine) but after administration of estrogen 95% of these children demonstrated a peak GH >7 µg/L. Multiple other studies have confirmed this result in healthy peripubertal children with growth impairment (62).  Thus, the argument in favor of priming is that it prevents false positive diagnoses of GHD in this group. The concerns about priming are that it only briefly augments the GH response which then returns to suboptimal levels which may be insufficient for normal growth. Thus priming may result in failure to treat children with transient peripubertal GH deficiency who would have benefitted from treatment (62).


24 hour or overnight 12-hour GH profiles with measurement of serum GH every 20 minutes have been proposed as an alternative assessment of GH secretion. The obvious disadvantages are the large number of samples required and costs, particularly of the overnight hospital admission. While a 24 hour GH profile has a high reproducibility there is also a large degree of inter individual variability limiting the usefulness of the procedure as a diagnostic test (63).


A diagnosis of GH neurosecretory dysfunction can be made where the patient presents with signs/symptoms of GHD with low IGF-I concentration, a normal peak GH level to pharmacological stimulation but absence of spontaneous GH peaks on 24 hour serum GH profile (64). This diagnosis has not been identified in adults and given the interindividual variability in 24-hour GH profiles caution should be made before coming to GH neurosecretory dysfunction as a diagnosis, particularly where there is no history of cranial irradiation.


Measurement of IGF-I and/or IGFBP-3


IGF-I and IGFBP-3 are, unlike GH, present at relatively constant concentrations in serum throughout the day and can therefore be measured by a simple blood test without the need for pharmacological stimulation. IGF-I is suppressed in states of poor nutrition and both IGF-I and IGFBP-3 concentrations vary with age and pubertal stage, thus normative ranges taking into account age, Tanner stage, and BMI have been recommended (52). The majority of IGF-I exists bound in the ternary IGF-I/IGFBP-3/ALS complex (thus free IGF-I is very low and difficult to measure) and assays therefore require a step to remove the IGF binding proteins before measurement of total IGF-I. Incomplete removal of IGF-I can potentially lead to false low IGF-I concentrations. Both IGF-I and IGFBP-3 have a low sensitivity (~50%) with a high specificity (97%) (65,66) and thus are of limited value in isolation. They do, however, form a vital component of the assessment of a child for GHD combined with auxological, other biochemical and radiological data.


Neuroimaging


Identifying abnormalities of the hypothalamo-pituitary axis provides powerful evidence for the diagnosis of GH deficiency in the short child. The most common abnormality identified in congenital GHD is the so-called pituitary stalk interruption syndrome consisting of a variable combination of anterior pituitary hypoplasia, ectopic posterior pituitary, and thinning or interruption of the pituitary stalk (67). Loss of the vascular pituitary stalk increases the risk of MPHD 27-fold but required gadolinium-DTPA administration to reliably distinguish presence/absence of vascular stalk (68). Other potential findings in congenital GHD include


  1. Septo-optic dysplasia – combination of absence of septum pellucidium, optic nerve hypoplasia and hypopituitarism. May be associated with an ectopic posterior pituitary and anterior pituitary hypoplasia.
  2. Abnormalities of the corpus callosum – agenesis, corpus callosum cysts
  3. Holoprosencephaly
  4. Eye abnormalities – microphthalmia or anophthalmia (GLI2 or OTX2 mutations)
  5. Absent olfactory bulbs (FGFR1, FRF8 and PROKR2 mutations)
  6. Pituitary hyperplasia (seen in patients with PROP1 mutations)
  7. Hypothalamic hamartoma (Pallister-Hall syndrome)
  8. Empty sella
  9. Absence of the internal carotid artery
  10. Arnold-Chiari malformations
  11. Arachnoid cysts
  12. Syringomyelia


In acquired GHD tumors affecting the hypothalamo-pituitary axis will frequently be identified – craniopharyngiomas, adenomas, and germinomas. Thickening of the pituitary stalk may be identified in Langerhans cell histiocytosis.


As well as a role in the diagnosis of GH deficiency MR imaging can also help predict which patients will require re-testing of growth hormone status at the end of growth. Young adults with MRI abnormalities have an increased risk of persisting GHD into adulthood (69).


GH Therapy


All children diagnosed with GH deficiency should be treated with recombinant human growth hormone as soon as possible after the diagnosis is made. The aim of treatment is to normalize height – both to within the normal range for the population and to achieve a height within the child’s target range. GH is administered as a once daily subcutaneous injection in the evening. Starting dose is usually in the range of 25-35µg/kg/day with maximum dose being 50µg/kg/day. In children with more severe GHD (evidence by a lower peak GH level, more severe presentation, MRI abnormality) the response to GH is better and often height can be normalized with lower doses of GH e.g., 17-35 µg/kg/day (70). Prediction models (discussed below) are available and in GHD have been shown to reduce variability in response but do not improve height gain (71). Children receiving GH therapy should be seen every 3-6 months and the GH dose titrated to height velocity and height gain. Monitoring of IGF-I concentrations is recommended to avoid prolonged periods of supraphysiological IGF-I levels. In general, IGF-I should be measured at least annually but can be measured more frequently particularly where there has been a recent increase in dose. A reduction in dose would normally be considered were two consecutive IGF-I levels were above +2 SD. As a guide to dose adjustment a 20% alteration in dose leads, on average, to a 1 SD change in IGF-I concentration (72).  Treatment is continued until the child is post-pubertal and growth is either completely ceased or is <2cm per year.  A growth chart from a child with congenital GHD treated with recombinant human GH therapy is shown in Figure 5.


Currently there is no single accepted definition of poor response to GH treatment with suggestions including change in height SDS <0.3 or 0.5 during the first year of treatment, change in height velocity <+3cm/year during 1st year of treatment, change in height velocity <+1SD or a height velocity <-1 SD during the first year of therapy.  Depending on the definition used 20-35% of patients display a poor response (73). It is important to discuss the possibility of a poor response with the family prior to staring therapy.

Figure 5. Growth Chart from child with GH deficiency. GH therapy is started at age 4 with height SDS -3.7 SD. There is a sustained improvement in height velocity leading to a final height of +1.5 SD.

Multiple long-acting preparations of growth hormone are at various stages of development (74). A phase three trial in adults with GHD have been completed and has demonstrated similar efficacy with a once weekly injection of a long-acting GH compared to conventional daily GH (75). Trials in children are currently ongoing.


Prediction of Response to GH Therapy and the d3-Growth Hormone Receptor Polymorphism


Initial work predicting the response to GH therapy was based on auxological and biochemical data, particularly from the Kabi International Growth Study (KIGS), a large surveillance study of over 62,000 patients treated with GH in childhood. Prediction models developed included models for idiopathic isolated GH deficiency (76) and early onset isolated GH deficiency (77).  For the idiopathic isolated GH deficiency prediction model the model explained 61% of the variability on GH response. Factors included in the prediction model were peak GH during stimulation test, age at start of GH therapy, height SDS minus mean parental height SDS, growth hormone dose and weight SDS. Other prediction models derived from alternative datasets have also been produced for GHD (78,79).


Around 50% of the European population are homo- or heterozygous for a polymorphism of the GHR that leads to deletion of exon 3 and 22 amino acid residues near the N-terminal. In 2004 it was reported that GH signaling via the GHR with the d3 was increased and that children treated with GH under the SGA license or with idiopathic short stature showed an increased first year growth velocity where they were homo- or heterozygous for the d3 polymorphism (80). Since this original report there have been many studies assessing the effect on the d3 polymorphism on response to GH therapy in GH deficiency, Turner syndrome, SGA children and in children with idiopathic short stature. A meta-analysis of these studies in 2011 indicated that, compared to children homozygous for the full-length allele, children homozygous for the d3 polymorphism have an increase in 1st year height velocity SDS of 0.14 SD and children heterozygous for the d3 polymorphism has an increase of 0.09 SD (81).  Thus, it appears that the d3 polymorphism has a modest effect mediating the response to GH therapy.


The PREDICT study was a large international observational study which assessed the contribution of single nucleotide polymorphisms in over 100 candidate genes to GH response in a cohort of children with GH deficiency or Turner syndrome (82,83). GH response was assessed by change in IGF-I concentrations over 1 month and by height velocity change over the first year of treatment. Carriage of 10 polymorphisms within 7 different genes, related in particular to cell signaling, were identified to be associated with change in IGF-I over the first month of GH treatment and height velocity over the first year of treatment. In addition to assessing association between genotype and response to GH therapy the PREDICT study also assessed the use of basal gene expression in peripheral blood mononuclear cells to predict GH response. There were 1188 genes where the expression level was associated with low response and 865 genes where expression level was associated with a high response to GH therapy (83). Network analysis of the human interactome associated with these genes indicated that glucocorticoid, estrogen, and insulin receptor signaling, and protein ubiquitination pathways were most represented by the genes where association was linked to high or low response to GH therapy.


A recent genome wide association study examining GH responsiveness did not identify any significant SNPs in their primary analysis (the primary analysis utilized all diagnostic groups for GH treatment together) (84).  They did identify 4 SNPs in a secondary analysis stratifying by diagnosis and limiting to European ancestry – the closest associate genes are UBE4B, LAPTM4B, COL1A1/NT5DC1 and CLEC7A/OLR1(84).


INHERITED DISORDERS OF THE GH-IGF-I AXIS


Genetic Disorders Causing Isolated Growth Hormone Deficiency


Initial reports suggested that only around 12% of cases of isolated growth hormone deficiency were associated with abnormalities of the hypothalamus or pituitary on MR imaging (85). More recent studies have indicated that up to 26% of cases of isolated GHD are associated with MR abnormalities (86), particularly anterior pituitary hypoplasia and ectopic posterior pituitary.  Within the remaining cohort of patients with IGHD an increasing number of genetic causes have been identified.


IGHD TYPE 1


IGHD type 1a is inherited in an autosomal recessive manner and is due to homozygous deletions and nonsense mutations in the GH1 gene leading to a complete absence of the GH protein from serum. The clinical presentation is with severe growth hormone deficiency and growth failure from 6 months of life with height SDS >4.5 SD below mean. Typically patients respond well to initial therapy with GH but then develop anti-GH antibodies leading to a loss of efficacy (87). Treatment with IGF-I is an option for such patients.


IGHD type 1b is also autosomal recessive and caused by mutations in the GH1 gene – either mis-sense, splice site or nonsense or by mutations within the GHRHR (the gene encoding the GHRH receptor). The clinical phenotype in IGHD type 1b is milder than that of IGHD 1a with the presence of low but detectable levels of GH to stimulation tests. These patients show a good response to treatment with GH without the development of anti-GH antibodies.


The GHRHR is a 423 amino acid G-coupled protein receptor. It contains seven transmembrane domains encoded for by a 13-exon gene on chromosome 7p15. While human mutations leading to isolated GH deficiency have been found in the GHRHR gene, to date no such mutations have been identified in the gene encoding the ligand, GHRH. The initial link between a GHRHR mutation and impaired growth was in the little mouse, where Lin et al identified an amino acid substitution in codon 60 of the mouse GHRHR (88). The substitution of glycine for aspartic acid (D60G) prevented the binding of GHRH to the mutant receptor. Subsequent to the identification of the mutation in mouse a nonsense mutation (p.E72X) was identified in two patients in a consanguineous family of Indian ethnic origin (89). Since this initial report multiple families have been reported and splice site mutations, missense mutations, nonsense mutations, microdeletions and one mutation in the promoter (90). The clinical phenotype of an individual with a GHRHR mutation is that of autosomal recessive inheritance of IGHD, anterior pituitary hypoplasia (defined as pituitary height more than 2 SD below mean), GH concentrations are either undetectable or very low in response to provocation tests and IGF-I/IGFBP-3 levels are low. In contrast to patients with GH1 mutations midface hypoplasia, neonatal hypoglycemia and microphallus are less common. Intelligence is normal and affected individuals are fertile.


Expression of GHRHR is upregulated by the pituitary transcription factor POU1F1 and this results in somatotroph hypertrophy. Because of this effect on somatotrophs anterior pituitary hypoplasia is commonly seen on MR imaging but there have been reports of GHRHR mutations with normal pituitary morphology (91).


IGHD TYPE 2


IGHD Type 2 is an autosomal dominant disorder caused by mutations in the GH1 gene.  The severity of GH deficiency is highly variable. While the name of the condition suggests only GH is affected, in practice loss of other pituitary hormones has been reported and patient must be followed up to identify these additional hormone deficiencies. Loss of TSH, ACTH, prolactin and gonadotrophins have all been reported (92).


IGHD type 2 is most commonly caused by mutations that affect splicing of GH1, particularly splicing of exon 3 (93).  The most frequent mutations are within the first six bp of the exon 3 donor splice site (93) but mutations in the exon 3 splice enhancers and intron splice enhancers have also been reported (90). The exon 3 splice mutations lead to the exclusion of exon 3 and the production of a 17.5kDa isoform of GH lacking amino acids 31-71, responsible for connecting helix 1 and helix 2 of the mature GH molecule. This abnormal 17.5 kDa variant GH is retained within the endoplasmic reticulum, disrupts the Golgi apparatus and reduces the stability of the 22kDa GH isoform (94). In addition to GH trafficking of other hormones including ACTH is disrupted. A mouse model overexpressing the 17.5kDa isoform demonstrated anterior pituitary hypoplasia with invasion by activated macrophages. The loss of additional pituitary hormones is likely to result from the disrupted hormone trafficking as well as the pituitary inflammation and destruction. Children with IGHD type II may display anterior pituitary hypoplasia on MR imaging. Currently there is no specific treatment in man to ameliorate the effects of the 17.5kDa isoform. A small interfering RNA based therapy has been successful in the mouse model of IGHD type 2 (95) but the delivery system used involved inserting the short hairpin RNA as a transgene. Successful implementation of such a therapy in humans will require an alternative mode of delivery capable of crossing the blood-brain barrier. As well as the classical exon 3 splice site mutations IGHD type 2 is also caused by missense mutations. These have been reported to lead to impaired GH release (96) or to alter folding of GH (97).  


IGHD TYPE 3


IGHD Type 3 is of x-linked recessive inheritance and the males described were both immunoglobulin and GH deficient. A single patient has been reported with a mutation in the BTK gene (resulting in exon skipping) with x-linked agammaglobulinemia and GH deficiency (98).


One family has been reported with isolated GHD caused by mutations in RNPC3 (99). The three affected sisters had compound heterozygous mutations in RNPC3 (p.P474T and p.R502X) and presented with classical severe isolated GHD with anterior pituitary hypoplasia on MR imaging. RNPC3 encodes a component of the minor spliceosome responsible for splicing of a small subset (<0.5%) of introns which are present in ~3% of human genes. Given that splicing is an essential basic process present in all tissues it is interesting that the phenotype seen is pituitary specific.  The patients displayed relatively minor perturbations in splicing which is hypothesized to be tolerated in most tissues, but not in the developing pituitary. Response to GH treatment is reported to be excellent (100).


Genetic Disorders Leading to Abnormal Pituitary Development and Multiple Pituitary Hormone Deficiency


Mutations in an increasing number of genes lead to loss of multiple pituitary hormones including growth hormone (summarized in Table 2).  A brief summary of each is given below – for an extensive review of pituitary development and it’s genetic control see Bancalari et al (101).


HESX1


The paired homeobox domain protein HESX1 is one of the earliest specific markers of the pituitary primordium and it acts as a transcriptional repressor. Mutations in HESX1 are associated with septo-optic dysplasia (102) and MPHD (103,104) which can be inherited in an autosomal recessive or autosomal dominant pattern. In addition to the MRI appearances associated with septo-optic dysplasia patients with HESX1 mutations can have an ectopic posterior pituitary (104).


OTX2


The OTX2 homeobox gene is a homologue of the Drosophila orthodenticle protein. It is expressed early in gastrulation and is involved in development of the central nervous system and eye. In humans OTX2 mutations have been identified in patients with anophthalmia or microphthalmia with isolated GHD or MPHD (105). On MR imaging an ectopic posterior pituitary and small anterior pituitary have been associated with OTX2 mutations. 


SOX3


SOX3 is a single exon gene located on the X chromosome, is expressed widely throughout the ventral diencephalon and is involved in the development of Rathke’s pouch (106). In humans SOX3 duplications (107) or polyalanine expansion (108,109) have been associated with X-linked hypopituitarism with or without mental retardation. The pituitary phenotype is variable from isolated GHD to MPHD. MRI findings may include anterior pituitary hypoplasia, ectopic posterior pituitary, and corpus callosum abnormalities.


PITX2


PITX2 is a homeodomain transcription factor expressed in the rostral brain and oral ectoderm during development and throughout the anterior pituitary in adult life. Axenfeld-Riegler syndrome is an autosomal dominant disorder characterized by ocular, dental and craniofacial abnormalities in addition to pituitary abnormalities. Mutations in PITX2 have been found in patients with Axenfeld-Riegler syndrome and GH deficiency (110).


LHX3 and LHX4


LHX3 and LHX4 encode LIM domain proteins expressed in Rathke’s pouch involved in transcriptional regulation. Homozygous loss of function mutations in LHX3 have been associated with hypopituitarism, sensorineural deafness and cervical abnormalities (rigid cervical spine and cervical spina bifida occulta) (111,112). The MRI appearance may be of a small or enlarged pituitary or a hypointense lesion compatible with a microadenoma.  Mutations in LHX4 lead to a range of pituitary dysfunction from GHD to MPHD (113) with a pituitary phenotype including anterior pituitary hypoplasia, ectopic posterior pituitary and in one family there was pointed cerebellar tonsils suggestive of an Arnold Chiari Malformation (114).


GLI2


GLI2 is a mediator of Sonic Hedgehog signal transduction and is expressed in the oral ectoderm and ventral diencephalon. Heterozygous mutations in GLI2 lead to a variable combination of holoprosencephaly and hypopituitarism (115,116). Other clinical findings may include a cleft lip/palate, postaxial polydactyly and anophthalmia.


FGFR1, FGF8 and PROKR2


FGFR1, FGF8 and PROKR2 were previously known to be involved in the pathogenesis of Kallmann syndrome (hypogonadotropic hypogonadism with anosmia). Screening of a cohort of 103 patients with hypopituitarism identified mutations in these Kallmann syndrome genes in eight patients (FGFR1 n=3, FGF8 n=1, PROKR2 n=4) (117).  An EPP was identified in one patient with an FGFR1 mutation and a hypoplastic anterior pituitary in one patient with a PROKR2 mutation.


PROP1


Prophet of Pit-1 (PROP1) is a homeodomain transcription factor with expression limited to the anterior pituitary. It acts as a transcriptional repressor downregulating HESX1 and as an activator of POU1F1. PROP1 mutations are associated with GH, prolactin, TSH and LH/FSH deficiency with rare cases of ACTH deficiency. PROP1 mutations are the commonest genetic cause of hereditary MPHD accounting for ~50% of familial cases (117).  MRI findings include both small and large anterior pituitary glands and even extension of the pituitary to form a large suprasellar mass which waxes and wanes before involuting (118).  Gonadotrophin deficiency in patients with PROP1 mutations is highly variable and can present with micropenis and cryptorchidism to delayed pubertal onset potentially indicating a role of PROP1 in maintenance of gonadotrophin function.


POU1F1


The first genetic cause of multiple pituitary hormone deficiency, identified in 1992, was mutations in the POU1F1transcription factor (119).  It is essential for the development of somatotrophs, lactotrophs, and thyrotrophs, consequently mutations in POU1F1 lead to deficiency of GH, TSH and prolactin. Anterior pituitary size is most often small but can be normal with normal stalk and normally sited posterior pituitary. The hormone deficiencies can present at any time from birth to adolescence.


IGSF1


Mutations in IGSF1 (immunoglobulin superfamily member 1) were identified initially as a cause of central hypothyroidism and macro-orchidism (120). IGSF1 is a membrane glycoprotein expressed in Rathke’s pouch. The identified mutations lead to aberrant protein trafficking and protein mislocalisation.  In a small number of subjects mild or transient GHD has been identified (121,122). It is clear that the immunoglobulin superfamily of proteins may have a wider role in controlling pituitary hormone secretion with mutations in immunoglobulin superfamily member 10 associated with constitutional delay in growth and puberty (123).


ARNT2


A single family with a homozygous frameshift loss of function mutation in ARNT2 has been described. The affected individuals demonstrated multiple pituitary hormone deficiency including diabetes insipidus along with post-natal microcephaly, frontal and temporal lobe hypoplasia, seizures, developmental delay, visual impairment and congenital abnormalities of the urinary tract (124). ARNT2 is a HLH transcription factor which is known to dimerize with SIM1, a known regulator of neuronal differentiation.


TCF7L1


Transcription factor 7-like 1 is a regulator of WNT/β-catenin signaling and is expressed in the developing forebrain and pituitary. Two patients with heterozygous missense variants have been reported – one diagnosed with GHD and one with low IGF-I concentrations (124). MRI findings are listed in Table 2. In both families there were unaffected family members also carrying the variant. Given functional studies confirmed the deleterious nature of the variant this is likely to represent autosomal dominant inheritance with variable penetrance.


RAX


RAX encodes a transcription factor involved in eye and forebrain development. A child with a homozygous frameshift truncating mutation in RAX has been identified with a phenotype including anophthalmia, bilateral cleft lip and palate with congenital hypopituitarism (125).


LAMB2


Laminin b2 is a basement membrane protein with autosomal recessive mutations associated with congenital nephrotic syndrome, ocular abnormalities and developmental delay. One patient has been reported with isolated growth hormone deficiency, optic nerve hypoplasia, and a small anterior pituitary in association with focal segmental glomerulosclerosis with a compound heterozygous missense mutation in LAMB2 (126).


TBC1D32


TBC1 Domain Family member 32 is thought to be a ciliary protein and a cause of oral facial digital syndrome type IX (127). Two families with biallelic mutations in TBC1D32 and hypopituitarism have been reported (128). For the first family there were two affected siblings and they had panhypopituitarism with an absent anterior pituitary, ectopic posterior pituitary and retinal dystrophy while in a third family the affected proband had anterior pituitary hypoplasia, growth hormone deficiency and developmental delay (128). Facial dysmorphism was present with prominent forehead, low set posteriorly rotated ears, hypertelorism and a flat nasal bridge.  Autosomal recessive mutations in another ciliopathy related gene IFT172 have been reported to cause GHD with an ectopic posterior pituitary (129).


MAGEL2 and L1CAM


MAGEL2 and L1CAM mutations have been identified in patients with a combination of hypopituitarism and arthrogryposis (130). MAGEL2 mutations cause Schaaf-Yang syndrome which is similar to Prader-Willi Syndrome with hypotonic, obesity, developmental delay, contractures and dysmorphism.  GHD, diabetes insipidus and ACTH deficiency have been reported in 4 patients. In one patient with L1 syndrome due to a L1CAM mutation arthrogryposis was present with GHD.


EIF2S3


EIF2S3 encodes a protein involved in the initiation of protein synthesis with mutations associated with developmental delay and microcephaly. In three patients’ mutations in EIF2S3 have been associated with GHD and central hypothyroidism (131). Inheritance is X-linked.


FOXA2


FOXA2 is a transcription factor involved in pituitary and pancreatic B-cell development and de novo heterozygous mutations cause a phenotype of congenital hypopituitarism with congenital hyperinsulinism (132).


OTHER MUTATIONS


In addition to the above mutations in CDON (133) (nonsense heterozygous), GPR161(134) (homozygous missense) and ROBO1(135) (heterozygous frameshift, nonsense and missense) have been associated with pituitary stalk interruption syndrome.


Table 2. Genetic Defects of Pituitary Development and their Phenotype

Gene

Pituitary Deficiencies

MRI phenotype

Inheritance

Other phenotypic features

ARNT2


GH, TSH, ACTH, LH, FSH, ADH

Absent PP, ectopic PP, thin stalk, thin corpus callosum, delayed myelination

AR

Hip dysplasia, hydronephrosis, vesico-ureteric reflux, neuropathic bladder, microcephaly, prominent forehead, deep set eyes, retrognathia

CDON

GH, TSH, ACTH

Small anterior pituitary, ectopic posterior pituitary, absent stalk

AD


EIF2S3

GH, TSH

Small anterior pituitary, white matter loss,

X-linked recessive

Developmental delay and microcephaly, glucose dysregulation (hyperinsulinemia hypoglycemia and post-prandial hyperglycemia)

GPR161

GH, TSH, ADH

Small anterior pituitary, ectopic posterior pituitary

AR

Congenital ptosis, alopecia, syndactyly, nail hypoplasia

FGFR1

GH, TSH, LH, FSH and ACTH

Normal or small anterior pituitary, corpus callosum agenesis

AD

ASD and VSD, brachydactyly, brachycephaly, preauricular skin tags, ocular abnormalities, seizures

FGF8

GH, TSH, ACTH, ADH

Absent corpus callosum, optic nerve hypoplasia

AD or AR

Holoprosencephaly, Moebius syndrome, craniofacial defects, high arched palate, maxillary hypoplasia, microcephaly, spastic diplegia

FOXA2

GH, TSH, ACTH

Small shallow sella turcica, anterior pituitary hypoplasia, absent stalk

AR

Congenital hyperinsulinism

GLI2

GH, TSH and ACTH with variable gonadotrophin deficiency

Anterior pituitary hypoplasia

AD

Holoprosencephaly, cleft lip and palate, anophthalmia, postaxial polydactyly, imperforate anus, laryngeal cleft, renal agenesis

GLI3

GH, TSH, LH, FSH, ACTH

Anterior pituitary hypoplasia

AD

Pallister-Hall syndrome Postaxial polydactyly, hamartoblastoma

HESX1

Isolated GHD through to panhypopituitarism with TSH, LH, FSH, ACTH, prolactin and ADH deficiency

Optic nerve hypoplasia, absence of the septum pellucidum, ectopic posterior pituitary, anterior pituitary hypoplasia

AR and AD

Developmental delay

IFT172

GHD

Ectopic posterior pituitary, anterior pituitary hypoplasia

AR

Retinopathy, metaphyseal dysplasia, and hypertension with renal failure

IGSF1


GH (transient/partial), TSH, prolactin

Normal in the majority of cases.  Frontoparietal hygroma, hypoplasia of the corpus callosum, and small stalk lesion reported.

X-linked recessive

Macro-orchidism, delay in puberty

L1CAM

GHD

Generalized white matter loss and thin corpus callosum

X-linked recessive

Arthrogryposis, hydrocephalus, VSD, developmental delay, scoliosis, astigmatism

LAMB2

GHD

Small anterior pituitary, optic nerve hypoplasia

AR

Congenital nephrotic syndrome, focal segmental glomerulosclerosis, developmental delay

LHX3

GH, TSH, LH, FSH, prolactin

Small, normal or enlarged anterior pituitary

AR

Short neck with limited rotation

LHX4

GH, TSH and ACTH deficiency

Small anterior pituitary, ectopic posterior pituitary, cerebellar abnormalities, corpus callosum hypoplasia

AD


MAGEL2

GHD, ACTH, ADH

Small posterior pituitary, thin corpus callosum and optic nerve hypoplasia

Heterozygous mutations on paternal allele

hypotonia, obesity, developmental delay, contractures and dysmorphism

OTX2

GH, TSH, LH, FSH and ACTH

Normal or small AP, pituitary stalk agenesis, ectopic posterior pituitary, Chiari I malformation

AR or AD

Microcephaly, bilateral anophthalmia, developmental delay, cleft palate

POU1F1

GH, TSH, prolactin

Small or normally sized anterior pituitary

AR and AD


PROKR2

GH, TSH, ACTH

Hypoplastic corpus callosum, normal or small anterior pituitary

AD

Club foot, syrinx spinal cord, microcephaly, epilepsy

PROP1

GH, TSH, LH, FSH, prolactin, evolving ACTH deficiency

Small, normal or enlarged anterior pituitary – may evolve over time

AR


RAX

GH, TSH, LH, FSH, ACTH, ADH

Absent sella turcica and pituitary

AR

Anophthalmia, bilateral cleft lip and palate

ROBO1

GH, TSH

Small or absent anterior pituitary, ectopic or absent posterior pituitary, interrupted or absent stalk

AD

Strabismus, ptosis

SOX3

GH, TSH, LH, FSH, ACTH.  Most commonly isolated GHD

Anterior pituitary and infundibular hypoplasia, ectopic posterior pituitary, corpus callosum abnormalities including cysts

X-linked recessive

Learning difficulties

SOX2

LH, FSH variable GH deficiency

Anterior pituitary hypoplasia, optic nerve hypoplasia, septo-optic dysplasia, hypothalamic hamartoma

AR

Microphthalmia, anophthalmia, micropenis, sensorineural deafness, gastro-intestinal tract defects.

TBC1D32

Isolated GHD to panhypopituitarism

Absent or hypoplastic anterior pituitary, ectopic posterior pituitary

AR

Retinal dystrophy, developmental delay, facial dysmorphism (prominent forehead, low set posteriorly rotated ears, hypertelorism and a flat nasal bridge). 

TCFL7


GH

Absent posterior pituitary, anterior pituitary hypoplasia, optic nerve hypoplasia, parital agenesis of corpus callosum, thin anterior commissure

AD


Bioinactive GH


Short stature associated with normal to high levels of growth hormone with low serum IGF-I concentrations “bioinactive GH” was first described in 1978 (136). This disorder is associated with a good clinical response to GH therapy and multiple subsequent cases have been reported in the literature (90). These multiple case reports contained no information on the genetic cause of the disorder.  The first demonstration of the mechanism responsible for bioinactive GH came in 1997 (137) when Takashi and co-workers described a heterozygous glycine to aspartic acid substitution at amino acid 112 of the GH molecule resulting in impaired binding of the mutant GH to GHR. Reported mutations such as the R77C mutation (138,139) have also been found in normally statured relatives and functional work has failed to identify any difference between wild type and R77C GH on GHR binding, activation of the JAK/STAT pathway, secretion studies or ability to induce cell proliferation (140,141). The clinical scenario of normal to high GH concentrations with low IGF-I levels is not uncommon and a diagnosis of bioinactive GH should not be made unless a mutation is identified where there is a demonstration that the function of the variant GH is impaired.


A homozygous missense mutation (C53S) in the GH1 gene was reported in a Serbian patient with height SDS of -3.6 at 9 years of age (142). Altered affinity for the GH receptor was demonstrated in functional studies, presumably due to alteration of the disulphide bond between Cys-53 and Cys-65 in the GH molecule.


Laron Syndrome


Laron syndrome, caused by loss of function mutations in the GHR gene(143), was first described in 1966 (144). Since then more than 250 patients have been described in the literature with over 70 missense, nonsense, indels and splice mutations within the GHR gene (145). The majority of mutations describe are inherited in an autosomal recessive manner but autosomal dominant inheritance has been described in a small number of cases (146).  Patients present with severe short stature having been born with normal birth size. The facial phenotype is similar to severe GH deficiency with frontal bossing and midface hypoplasia. Intellect, development and head circumference are normal. IGF-I, IGFBP-3 and ALS concentrations are low in serum with normal to raised baseline GH levels with raised peak stimulated GH level. Typical adult height is around -5 SD. Measurement of GHBP in serum is useful as, when markedly low, indicates absence of the extracellular component of the GHR. Since mutations can occur in the transmembrane or intracellular domains, the presence of GHBP in serum does not exclude a diagnosis of Laron syndrome.  The standard diagnostic test is an IGF-I generation test. Specificity of this test is around 77-91% and when applied to a population with low prevalence of GH insensitivity the positive predictive value of the test is likely to be low (147). In addition, there is a limited normative data for the IGF-I generation test. Buckway at al reported the results of IGF-I generation tests in normal subjects and subjects with GH deficiency, Laron syndrome and idiopathic short stature (148). Sensitivity of the IGF-I generation test in this population (who all had the same E180 splice mutation in the GHR, was 77% (the cut off for a normal result on this test was an increase in IGF-I to >15ng/mL post-GH stimulation (149)). Diagnosis of Laron syndrome therefore relies upon integration of clinical and biochemical findings and selecting patients for further genetic studies.


Recombinant human IGF-I therapy provides limited benefit in improving height. In an observational study containing 28 patients with Laron syndrome the results of treatment with 120 mg/kg/day IGF-I for a mean duration of 5 years increased height SDS from -6.1 SD to -5.1 SD (150). In the first year of treatment there was a marked increase in height velocity from 2.8 to 8.7 cm but height velocity markedly decreased after the first year of treatment. In a separate report of 21 individuals with GH insensitivity – 5 of whom had Laron syndrome there was an increase in height SDS from baseline of +1.9 SD with treatment of 120 mcg/kg/day IGF-I for a mean of 10.5 years (151). The treatment effect is markedly lower than that of GH in children with severe congenital GH deficiency (an example of a growth chart of a child with Laron syndrome treated with IGF-I is given in Figure 6). While GH therapy stimulates both hepatic and local IGF-I production, subcutaneous injections of IGF-I do not simulate this local IGF-I production. In addition, GH therapy normalizes not only IGF-I levels but levels of IGFBP-3 and ALS whereas in GH insensitive subjects treated with IGF-I there is no increase in IGFBP-3 or ALS concentrations. Thus, it would be expected that the injected IGF-I would have a much lower half life than endogenous IGF-I. A combined therapy of IGF-I with IGFBP-3 disappointingly was less effective in improving height (152).

Figure 6. Growth chart of girl with Laron syndrome treated with recombinant human IGF-I (Increlex) from age of 5.8 years when height SDS was -4.2 SD. There is an increase in height velocity over the first year of treatment which is reduced in subsequent years of therapy. Height SDS improves to -2.1 SD by 10.25 years but this has been associated with the onset of puberty at 9 years (treatment with the GnRH analogue Zoladex was introduced at 9.8 years). Current height lies within parental target range. M denotes maternal height and F denotes adjusted paternal height.

STAT5b Mutations


The signal transducers and activators of transcription (STAT) family contains seven proteins (STAT1, -2, -3, -4, -5a, -5b and -6). Mutations in STAT1(153) and STAT3 are associated with immune deficiency and a mutation in STAT5b was described in a patient with growth hormone insensitivity and immune deficiency (154).  The initial report was of a homozygous missense mutation in exon 15, encoding the critical SH2 domain leading to aberrant folding and aggregation of the protein. Six other mutations have been described including a nonsense mutation in exon 5 (155), two distinct nucleotide insertions (156,157) in exons 9 and 10 containing the DNA binding domain, a missense variant within the SH2 domain (158), a four nucleotide deletion in exon 5 (159) and a single nucleotide deletion in the Linker domain (160).


Until recently all the mutations identified were homozygous and the disorder is predominantly inherited in an autosomal recessive manner but dominant negative mutations have now been reported (161).  There is some evidence of a mild effect of the heterozygous state as height SDS in parents of affected children is consistently below mean height for the population with range from -0.3 SD to -2.8 SD. Birth weight appears to be within normal limits but postnatal height is severely impaired with height SDS range of -3 to -9.9 (158). Growth is comparable to children with Laron syndrome. Bone age and puberty is commonly delayed perhaps reflecting in part the chronic state of ill health. A prominent forehead, depressed nasal bridge and high-pitched voice are seen in some patients. The biochemical findings are compatible with growth hormone insensitivity with normal to high basal growth hormone concentrations and a raised stimulated peak GH level. Of note, 1 subject had a low stimulated peak GH concentration of 6.6 mcg/. Serum IGF-I, IGFBP-3 and ALS concentrations were consistently low in all subjects, remaining low at end of an IGF-I stimulation test.


Clinical differentiation of patients with STAT5b mutations form those with Laron syndrome can be made with the immunodeficiency. All but one of the reported cases has presented with chronic pulmonary disease, particularly lymphoid interstitial pneumonia, with the other child having severe hemorrhagic varicella. Two patients have died from their lung disease and a further patient has required lung transplantation. Patients with STAT5b mutations also have raised serum prolactin levels which can also be helpful with diagnosis.


Acid Labile Subunit Deficiency


The human IGFALS gene is located on chromosome 16p13.3 and ALS deficiency is inherited in an autosomal recessive pattern with homozygous and compound heterozygous mutations identified including missense, nonsense, deletions, duplications and insertions. The mutations are spread throughout the IGFALS gene which contains 2 exons and encodes a protein of 605 amino acids (162). The majority of the mutations are located in the 20 central leucine rich domains.  The clinical phenotype, first described in 2004 (163), is of very low serum concentrations of IGF-I, IGFBP-3 and ALS with a moderate degree of short stature (-2 to -3SD). 


Limited data is available on size at birth but weight appears to be within the lower half of the normal range (-0.2 to -1.9 SD) with only one individual reported to be SGA with a birth weight of -2.2 SD. The data on birth length is even more limited but all individuals measured were within normal range at -1.5 to +1.0 SD. Data on height during childhood is more abundant and hemorrhagic it is clear that postnatal growth is affected in the majority of individuals carrying ALS mutations.  Mean prepubertal height in 17 patients was reported as -2.61 SD (range -3.9 to -1.06 SD) with final adult height of -2.15 SD (range -0.5 to -4.2 SD). There is a preponderance of males in the literature (88% reported cases) which may represent the increased likelihood of males with short stature to present to health care providers. In male’s pubertal onset is commonly delayed (6/11 with onset puberty >14 years and 3/11 onset >15 years).  Serum IGF-I and IGFBP-3 standard deviation scores are very low (-3.3 to -11.2 SD for IGF-I and -3.6 to -18.5 for IGFBP-3), with undetectable ALS concentrations in all but one case (164). Levels of GH are increased with a mean peak GH of 46µg/L.


The relatively modest growth impairment in ALS deficiency is likely to be due to the preservation of the local production and action of IGF-I with deficiency of hepatic derived IGF-I. The diagnosis should be suggested by the presence of very low concentrations of IGF-I and, in particular, IGFBP-3 in the presence of moderate growth impairment. Although measurement of ALS is not routinely available this would also be a useful diagnostic tool.


Response to treatment with GH therapy has been poor and one child treated with recombinant human IGF-I did not improve height after 1 year of treatment.


IGF-I Gene Mutations


Deletions and mutations within the IGF1 gene are an extremely rare cause of GH insensitivity. The first patient was reported in 1996 (3) and there have been four subsequent affected families reported (165-168). The first patient described had a homozygous deletion of exons 3 and 5 of the IGF1 gene leading to frameshift and generation of a premature termination codon. He had undetectable levels of serum IGF-I with normal concentrations of IGFBP-3 and ALS with raised baseline and spontaneous GH peak levels. He was born small for gestational age at 1.4 kg at term and displayed profound post-natal growth impairment with sensorineural hearing loss, microcephaly and developmental delay. 


One subsequent report identified a similar phenotype of growth impairment, developmental delay, microcephaly and hearing impairment with a homozygous missense variant in exon 6 of IGF-1(167). The patient also had low IGF-I concentrations and high GH levels. Subsequent studies have identified this variant in individuals with normal height and there may be an alternative cause for this child’s growth impairment.


There have been two cases reported with similar phenotype of growth impairment, microcephaly and hearing impairment in individuals associated with homozygous mutations within the IGF1 gene (166,168). These mutations (V44M and R36Q) reduce the binding affinity of IGF-I for IGF1R. A large family with short stature and a heterozygous IGF1 mutation (c.402+1G>C) inducing splicing out of exon 4 with subsequent frameshift and truncated peptide (165)has also been reported.  This family included 5 short individuals with the heterozygous IGF1 mutation and an additional 5 individuals who are short but do not have the IGF1 variant. The phenotype of the proband was less severe than other IGF1 mutation patients with normal birth size (3.0kg) but significant post-natal growth impairment (presenting height -4.0 SD), normal hearing, normal development except for attention deficit hyperactivity disorder and mildly reduced serum concentrations of IGF-I (-2.2 SD) with normal IGFBP-3 serum levels (-1.25 SD).


For all patients reported to date, treatment with GH has been ineffective. Treatment with recombinant human IGF-1 may be more effective but may be complicated by the development of antibodies in those patients with IGF1deletions. It should however be effective for patients with bioinactive IGF-I.


Chromosome 15 Abnormalities and Mutations Affecting the IGF-I Receptor


The phenotype of patients with mutations in the IGF1R gene is similar, if slightly milder, to patients with IGF1 gene defects. They are born SGA and continue to grow poorly with microcephaly and variable developmental delay. Reported birth weights are from -1.5 to -3.5 SD with head circumference of -2.0 to -3.2 SD. Birth length SDS is highly variable at -1.0 to -5.0 SD while childhood height ranges from -2.1 to -4.8 SD (169). The initial patient described had a compound heterozygous mutation (170) within IGF1R while all other patients to date have heterozygous mutations. These mutations are dispersed throughout the gene (169). Missense (171,172), nonsense (170), small deletions (173)and duplications (174) have already been identified leading to a variety of deleterious effects on the IGF1R including loss via nonsense mediated decay (174), production of a truncated protein (170), altered trafficking(171), reduced ligand binding (175) and altered tyrosine kinase activity (172). Serum IGF-I concentrations can be normal or raised but are generally > +1 SD.


Response to treatment with GH therapy is variable – of 5 patients reported no response was seen in two patients, an equivocal response seen in another two patients and only one patient responded well to therapy (169). GH dose ranged from 0.025 to 0.07 mg/kg/day with the best responder treated with the lowest dose of GH. The rationale behind GH therapy is that it increases hepatic and local production of IGF-I to improve growth. Where there is resistance to IGF-I it is not surprising that GH therapy is less effective. For most disorders clinicians the aim of GH therapy is to improve growth without generating IGF-I concentrations above the normal rage. For IGF1R mutations, given the IGF-I resistance, it may not be possible to achieve adequate growth without using high dose GH therapy with subsequent IGF-I concentrations above the normal reference range.  The long-term effects of such therapy in this patient group are unknown and before embarking on such a strategy a careful discussion about the risks and benefits should be undertaken with the child/parents


Prior to the identification of mutations within the IGF1R gene there were reports of patients with abnormalities of chromosome 15 including monosomy, ring chromosome and unbalanced translocations. Allelic loss of chromosome 15 was described to result in growth impairment (176) while trisomy of chromosome 15 results in overgrowth (177), given the location of IGF1R at chromosome 15q26 it was hypothesized that the growth alterations were due to a dosage effect on IGF1R. The clinical phenotype is highly variable depending on the chromosomal aberration e.g., 15q26 deletion is associated with congenital diaphragmatic hernia as well as growth impairment (178). Response to GH therapy appears better for patients with chromosome 15 abnormalities with a first-year increase in height SDS of 0.8-1.5 (179).  


Pregnancy-Associated Plasma Protein A2 Deficiency


Pregnancy-associated plasma protein A2 is a metalloproteinase responsible for the cleavage of IGFBP-3 and IGFBP-5, an essential step in releasing IGF-I from the ternary complex and allowing it to bind to the IGF1R. Two families have been reported with loss of function mutations in PAPPA2 leading to growth impairment with increased concentrations of IGF-I, ALS, IGFBP-3 and IGFBP-5 and a resultant reduction in free IGF-I (180). GH concentrations are raised due to the reduced free IGF-I. Birth size is moderately reduced in some subjects and the degree of postnatal growth impairment is highly variable ranging from -3.8 SD to -1.0 SD. Other clinical features include mild microcephaly, small chins and long thin fingers. Treatment with rhIGF-I in one family demonstrated an increase in height SDS of +0.4 SD over 1 year of treatment (181) while in the second family treatment was discontinued due to headache in one of two siblings (182).


ACQUIRED GH DEFICIENCY


Tumors of the Hypothalamus or Pituitary


CRANIOPHARYNGIOMA


Craniopharyngiomas are non-glial intracranial tumors derived from malformed embryonal tissue thought to originate from ectodermal remnants of Rathke’s pouch or residual embryonal epithelium of the anterior pituitary (183). More than 70% of adamantinomatous craniopharyngiomas contain a mutation of the β-catenin gene (184). Although rare, craniopharyngiomas are the commonest childhood tumor affecting the hypothalamo-pituitary axis accounting for 55-90% of sellar and parasellar lesions in childhood (185). The incidence is 0.5-2 per million per year (186) with 30-50% of cases diagnosed in childhood. In contrast to adulthood where the commonest histological type of craniopharyngioma is papillary, in excess of 70% of childhood craniopharyngiomas are adamantinomatous and associated with cyst formation. Survival rates with craniopharyngiomas are excellent exceeding 90% at 10 years (187)after diagnosis but morbidity with visual defects, hypothalamic obesity, and pituitary hormone deficiency is high.


Presentation is with a combination of symptoms of raised intracranial pressure, visual impairment, and endocrine deficits. Up to 87% of cases present with a least one pituitary hormone deficiency – the commonest being GH deficiency present in up to 75% of cases at diagnosis (188). The prevalence of GH deficiency rises after treatment to >90% of patients – with both surgical intervention and radiotherapy implicated in this increase in GH deficiency.  Additional pituitary hormone deficits are common including diabetes insipidus which is present in 92% of cases (189).


Therapy for craniopharyngiomas can include a combination of surgery, radiotherapy and intra-lesional chemotherapy. Surgery can be via the transcranial or transsphenoidal route.  Where it is possible to remove the entire tumor without causing damage to the hypothalamus or optic nerves this is the treatment of choice. For larger tumors involving these structures controversy exists on whether the benefits of a complete resection, namely a reduction in the risk of recurrence/progression, are outweighed by the surgical morbidity particularly hypothalamic obesity, visual impairment, and adipsic diabetes insipidus (190,191).  The alternative strategy is a limited surgical resection followed by adjuvant treatment with either conventional radiotherapy or proton beam therapy.  Recurrence rates for complete resection are 15-46% (192), 70-90% for patients treated with surgical partial resection alone and 21% for patients treated with surgical resection and radiotherapy (193).


There is good evidence to suggest that replacement GH therapy does not increase the risk of recurrence in craniopharyngioma (194,195) and that the gain in height is similar to that seen in congenital isolated GH deficiency. In one report the mean time between diagnosis and initiation of GH therapy was 2.3 years (194). A period of time after diagnosis, prior to the introduction of GH therapy, allows the completion of surgery and radiotherapy and a period of observation. Despite the reports on the overall safety of GH in craniopharyngioma rapid regrowth of the tumor after the initiation of GH therapy has been reported (196).


PITUITARY ADENOMAS


Pituitary adenomas are rare in childhood comprising only 3% of supratentorial tumors of childhood (197). Functioning adenomas are more common than non-functioning adenomas with the commonest being prolactinomas, followed by ACTH secreting adenomas then GH secreting adenomas. In one series of 41 patients with childhood onset adenomas, 29 (70%) were prolactinomas, 5 (12%) were ACTH secreting adenomas, one patient (2%) presented with a GH secreting adenoma and the remaining 6 patients (15%) presented with non-functioning adenomas (198).  GH deficiency was present in four out of the 41 patients during childhood and 13 patients during follow up into adulthood. All patients who developed GH deficiency had a macroadenoma. In approximately 5% of cases pituitary adenomas are familial and this is known to be caused by mutations in the genes encoding MENIN (199) and Aryl Hydrocarbon Receptor Interacting Protein (200).


OPTIC PATHWAY GLIOMA


Optic pathway gliomas are tumors of the pre-cortical visual pathway which may also involve the hypothalamus. In around 1 in 3 cases they are associated with neurofibromatosis type 1 (201). They commonly present with ophthalmological signs and symptoms with the main endocrine presentation being precocious puberty. In the majority of cases there is limited or no progression of the tumor and only monitoring is required. Surgery not recommended for most cases due to the possibility of post-operative visual impairment. Where required initial treatment is with chemotherapy with radiotherapy reserved for teenagers and younger children who have not responded to chemotherapy. Although effective with a 90% 10-year progression free survival radiotherapy is associated with an increased risk of worsening visual impairment, endocrine deficits, cerebrovascular disease, and neurocognitive deficits.


GH deficiency in optic pathway gliomas can be present prior to radiotherapy but is much more common post radiotherapy. In one study of 68 children with optic pathway gliomas 19 developed GH deficiency, 15 of whom had received radiotherapy (202). In another study of 21 patients with optic pathway gliomas treated with radiotherapy only one patient had GH deficiency pre-radiotherapy while all patients had GH deficiency post radiotherapy (203).  GH therapy is highly effective and restores adult height to within normal range (204). Optic pathway gliomas can be associated with GH excess, especially in NF1 syndrome related cases.


LANGERHANS CELL HISTIOCYTOSIS


Langerhans cell histiocytosis (LCH) is a rare disorder with a prevalence of ~4 per million children (205). It is a condition in which there is proliferation and accumulation of clonal dendritic cells (LCH cells) bearing an immunophenotype very close to that of the normal epidermal Langerhans cells of the skin (205). LCH cells can spread to nearly any site in the body, proliferate and lead to local inflammation and tissue destruction. The commonest pituitary hormone deficit in Langerhans cell histiocytosis is diabetes insipidus which develops in around 25% of childhood patients with LCH while GH deficiency is the second commonest endocrinopathy present in 9-12% of childhood LCH patients.


Radiation


Neuroendocrine abnormalities of the hypothalamo-pituitary axis evolve with time after radiation induced damage. The first, and sometimes only, hormone deficiency following radiation exposure of the HPA axis is growth hormone deficiency. The risk of GH deficiency is related to the total radiation dose, fraction size and time between fractions. Almost all children exposed to >30 Gy cranial irradiation will develop GH deficiency around 65% of those receiving <30 Gy develop GH deficiency by 5 years post radiotherapy (206). Isolated GH deficiency has also been reported in children exposed to 18-24 Gy as used prophylactically in acute lymphoblastic leukemia (207) and in children exposed to as little as 10 Gy as part of total body irradiation (208).  


The hypothalamus is thought to be the site of radiation induced damage to the HPA as when exposed to radiation <50 Gy hormone deficiencies remain common ~90% after 10 years (209)  but in contrast delivery of radiation doses 500-1500 Gy to the pituitary alone result in lower rates of endocrinopathy – 40% 14 years after exposure (210).  Additional evidence of the susceptibility of the hypothalamus to radiation induced damage comes from the high prevalence rates of hypothalamic dysfunction on dynamic endocrine tests observed after radiation exposure (211)  and the presence of impaired GH secretion to stimuli acting through the hypothalamus with normal GH secretion to stimuli acting directly on the pituitary (212). Within the hypothalamic-pituitary axis there is differential sensitivity to radiation induced damage with the somatotrophic axis being the most vulnerable to damage, followed by GnRH-FSH/LH and then the CRH-ACTH and TRH-TSH axes which are the least sensitive to radiation induced damage (213).  This sequence of loss of pituitary hormones in radiation induced damage is seen in both animal models (213,214) and in humans where lower doses of radiation (e.g. 18-30 Gy used in treatment of childhood leukemia and brain tumors) leads to isolated GHD(215) whereas higher doses of radiation >60 Gy, used in the treatment of skull base tumors and nasopharyngeal carcinomas, leads to multiple pituitary hormone deficiency (216,217). Risk of pituitary hormone deficiency increases with time elapsed after radiation exposure in addition to the radiation dose – in one study around 50% of children treated with 27-32 Gy for a brain tumor were GHD after one year of treatment, with 85% GHD by 5 years post treatment and almost all GHD by 9 years post treatment (206).


GH NEUROSECRETORY DYSFUNCTION


One form of GHD particularly well described following radiation injury to the hypothalamic-pituitary axis is GH neurosecretory dysfunction (218-220). Neurosecretory dysfunction is characterized by normal responses to pharmacological stimuli of GH secretion but reduced spontaneous physiological GH secretion.  GH neurosecretory function in seen most frequently with lower radiation doses of <24 Gy (220) and it appears that doses >27 Gy both spontaneous and pharmacologically stimulated GH responses are reduced (221).  The possibility of GH neurosecretory dysfunction makes the diagnosis of GHD in children exposed to cranial irradiation challenging. The presence of normal IGF-I and IGFBP-3 concentrations in many children with radiation induced GH deficiency (222-225) (proven with multiple pharmacological stimulation tests) compounds these difficulties.


For children with brain tumors that can exfoliate cells into the cerebrospinal fluid (e.g., ependymoma or medulloblastoma) radiotherapy is delivered to the spine in addition to cranial irradiation. Spinal irradiation has a profound effect on growth and leads to reduced height and disproportionate growth with decreased upper to lower segment ratio (226).   Brauner et al compared children treated with craniospinal irradiation to those receiving cranial irradiation alone with height SDS being significantly lower in the craniospinal group at 1.46 SD compared to the cranial irradiation only group with a height SDS of -0.15 (221). Final height in adults who received craniospinal irradiation is also significantly lower than adults receiving cranial irradiation alone (-2.37 v -1.14 SD) (227). Lower age at radiation exposure is associated with a lower adult height SDS (227) with height loss from spinal irradiation estimated at 9 cm when exposed at 1 year, 7cm when exposed at 5 years and 5.5 cm when exposed at 10 years.


Response to treatment with GH therapy is poorer in children with radiation induced GH deficiency than in children with congenital GHD. For most patients with congenital GHD, GH therapy will lead to significant catch-up growth but in patients with radiation induced GH deficiency catch up growth is rare (228,229). However, while GH treatment does not appear to induce catch up growth it prevents a further decline in height SDS (228,230).  The cause of the poorer response seen in patients with radiation induced GH deficiency are likely to be multifactorial including early puberty, delayed GH therapy, use of lower doses of GH and the direct effect of spinal irradiation. GH therapy in children who have previously received craniospinal radiotherapy does prevent further height loss but does so at the expense of further exaggerating the skeletal disproportion seen in these patients.


There is extensive evidence linking the GH-IGF-I system to risk of cancer via several sources:


  1. Up-regulating the activity of the GH-IGF-I axis in leads to increased development of tumors in animal models (for review see Yaker et al (231)).
  2. In vitro evidence of expression of GH, GHR and IGF-I/II by tumors and the ability GH and IGF-I to induce cancer cell proliferation and metastases (for review see Clayton et al (232))
  3. Epidemiological evidence has linked higher serum IGF-I concentrations to cancer risk (233-236)
  4. Increased risk colorectal and thyroid cancers in patients with acromegaly (a condition of chronic GH excess) (237-239)


This evidence did lead to concerns about the risk of administration of GH therapy to patients with GH deficiency and a history of cancer. The majority of studies examining risk of recurrence in children with cancers treated with GH indicate that there is no increased risk of recurrence (240-244).  One notable exception is the Childhood Cancer Survivor Study based in centers in North America where the standardized incidence ratio of second malignancy was elevated (2.1 at average follow up of 18 years) in the 361 individuals treated with GH (245).  The majority of brain tumor recurrences occur during the first two years after completion of primary treatment and this has led to the recommendation that treatment with GH should be considered after this time point. This strategy prevents the association between early tumor recurrence and GH therapy by families but potentially denies children with tumor or radiation induced GH deficiency treatment for a considerable length of time. Children with brain tumors require monitoring of growth and consideration should be given to testing for GH deficiency in children with growth failure who have completed primary treatment. GH therapy should be carefully discussed with the family and oncologist where it is considered before 2 years post primary treatment.


Trauma


Traumatic brain injury is relatively common in childhood with ~180 children per 100,000 population sustaining a closed head injury each year. The proposed mechanism for traumatic brain injury induced hypopituitarism is that injury to the hypophyseal vessels which transverse the stalk leads to anterior pituitary ischemia and infarction. Postmortem studies of fatal closed head injuries identified hypothalamic lesions suggestive of infarction and ischemia in 43% of cases and pituitary lesions in 28% of cases (246). Although there have been multiple published case reports of anterior pituitary dysfunction in traumatic brain injury for many years (247) there has been a large increase in the number of systematic studies of pituitary function in survivors of traumatic brain injury since 2000. Several moderately sized studies of adult traumatic brain injury survivors have demonstrated risk of post-injury hypopituitarism. Deficiency of GH and gonadotrophins was more common than TSH or ACTH deficiency with 10-28% of patients being GH deficient and 8-30% of patients being gonadotrophin deficient (248-253). In the majority of these studies there has been no relationship between time post injury or injury severity and risk of pituitary dysfunction.


Until 2006 the literature on childhood traumatic brain injury and hypopituitarism was limited to case reports (for review of the case reports see Acerini et al (254)). The first report of pituitary function in children with traumatic brain injury studies a cohort of 55 patients (22 studied retrospectively and 30 studied prospectively) and identified 2 patients with low peak GH concentrations (255). Khadr et al reported a 39% rate of abnormalities of pituitary function tests in 33 childhood traumatic brain injury patients (256). None of these were felt to be clinically significant.  In this study 7 patients had a low peak GH concentration but 6 out of the 7 were thought to have peri-pubertal blunting of the GH response with one borderline post-pubertal GHD patient who declined further examination (256).  Poomthavorn et al (257) described a cohort of 54 patients with childhood brain injury 4 of whom had known multiple pituitary hormone deficiency prior to the start of the study, in the 50 patients screened however, there were no patients identified with GH deficiency.


The largest study of childhood traumatic brain injury and pituitary function is by Heather et al (258). It examined the pituitary function of 198 survivors of childhood traumatic brain injury. Importantly they used an integrated assessment of GH stimulation tests (including 2nd test with priming where required), auxology and IGF-I concentrations in order to reach a diagnosis of GHD. While a low peak GH concentration (<5µg/L, used as the cut off for diagnosis of GHD in New Zealand at the time of the study) was identified in 16 patients, height SDS ranged from -0.9 SD to +3.6 SD and IGF-I concentrations were within normal limits for all subjects. For this study population had the diagnosis of GHD been based solely on a GH stimulation test and a cut off of 10µg/L for the diagnosis of GHD, 33% of patients would have been incorrectly diagnosed as GHD.


The risk of hypopituitarism in childhood traumatic brain injury appears to be low and currently routine screening of pituitary function in this group is not justified outside the context of on-going research studies.


Hypophysitis


Hypophysitis is characterized by cellular infiltration and inflammation and can be classified as lymphocytic, xanthomatous, granulomatous, necrotizing, IgG4-related and mixed forms.  Lymphocytic hypophysitis is the commonest type but overall the disease is extremely rare with an estimated incidence of 1 per 9 million population (259). Presentation is often with visual disturbance, headache and vomiting. MRI may identify a homogeneous enhancing sellar mass. In adults’ deficiency of TSH and ACTH are particularly common and diabetes insipidus is said to be rare (260). The limited pediatric case reports include several children with diabetes insipidus and it may be that the pattern of hormone insufficiency is influenced by age at presentation.  Hypophysitis is more common in pregnant women but can also occur in non-pregnant women, men and in children (261,262).  Definitive diagnosis is with histopathology while treatment includes hormone replacement therapy and surgery where the sellar mass compresses the optic chiasm. The medical treatment of choice is high dose glucocorticoid therapy but alternative reported therapies include azathioprine (263), methotrexate (264), cyclosporin A (265) and stereotactic radiation (266).


GROWTH HORMONE EXCESS


While short stature and GHD are common reasons to consult a pediatric endocrinologist, tall stature is a far less common reason to present to a pediatric endocrinologist. Within the group of patients presenting with tall stature in childhood the majority will have either familial tall stature or a genetic/syndromic cause for their tall stature (e.g., Beckwith Wiedemann syndrome, Sotos syndrome, Marfan Syndrome, Simpson-Golabi-Behmel syndrome).  GH excess is an extremely rare disorder in pediatric practice. Causes of GH excess include GH secreting pituitary micro or macroadenomas, ectopic GHRH production and genetic abnormalities affecting GH secretion (McCune Albright syndrome and Carney complex).


The commonest symptom of GH excess in childhood is rapid growth. In a series of 15 childhood patients (6 female) with GH secreting adenomas reported by Takumi eta al (267) all the patients presented with rapid growth although 3 also had visual signs/symptoms, 3 amenorrhea, 2 headaches, 1 with hypogonadism and 1 with precocious puberty. Microadenomas were present in 4/15 patients. Acromegalic features such as soft tissue growth of the hands and feet, mandibular overgrowth with prognathism, forehead protrusion and deepening of voice can also occur. The presence of acromegalic features in likely to be linked to the timing of onset (more common with onset in adolescence) and the presence of hypogonadism.  Additional clinical features include excessive sweating, carpal tunnel syndrome, lethargy, arthropathy, impaired glucose tolerance and hypertension. Although rare in childhood, hypertension and glucose intolerance are seen in approximately 15% of adolescents presenting with GH excess (268).


The diagnosis of GH excess is based on the clinical features and auxology in combination with biochemical evidence. Measurement of IGF-I concentration is useful but the reference range used must be specific for the gender, age and pubertal stage of the child. As IGF-I concentrations rise during puberty a precocious puberty will lead to a raised growth velocity with a serum IGF-I concentration which may be raised for age and gender will not be raised for pubertal stage. Due to the variability of GH levels throughout the day assessment of growth hormone levels is either via an oral glucose tolerance test for GH suppression or a GH day curve. The oral glucose tolerance test for GH suppression is essentially identical to a standard oral glucose tolerance test but with measurement of glucose, insulin and GH at 0, 60, 90, 120 and 150 minutes. A normal response is suppression of GH levels to < 0.4 mcg/L (269). Some centers will undertake a GH day curve – measurement of at least 5 separate GH levels over 12 hours, however, given that adolescence is the age at which there is maximal physiological GH secretion and the lack of GH day curve normative data in adolescence interpretation of this test can be challenging.


Benign GH secreting adenomas are the most common cause of GH excess. Mutations in the genes encoding GPR101 (causing X-linked acrogigantism), MENIN (270), aryl hydrocarbon receptor interacting protein (200) and p27 (271) are known to predispose to the development of pituitary adenomas. Overall, most GH secreting adenomas are sporadic but the proportion with a genetic basis is likely to be higher in childhood.


Transsphenoidal surgery is the treatment of choice for patients with microadenomas, macroadenomas without cavernous sinus or bone extension or where the tumor is causing symptoms from compression (272). Surgical removal is expected to lead to a biochemical cure in 75-95% of patients, with lower probability of cure in patients with macroadenomas. There are three classes of medical treatments for GH excess:


  1. Dopamine agonists – cabergoline, bromocriptine
  2. Somatostatin analogues – octreotide, pasireotide, lanreotide
  3. GH receptor antagonists - pegvisomant


Medical therapy can be used either where there is failure of surgical therapy, where the tumor is not amenable to surgery or prior to surgery/radiotherapy. Dopamine agonists are the only oral therapy available. Of the dopamine agonists available, only cabergoline has shown efficacy (273) in acromegalic patients and as monotherapy achieves a biochemical cure in a minority of patients (274). Cabergoline is most useful either in tumors which co-secrete prolactin as well as GH or in combination with another therapeutic agent. The somatostatin analogues are effective in both reducing GH and IGF-I levels as well as reducing tumor size. Long acting, once monthly preparations of the somatostatin analogues represent the mainstay of therapy. Somatostatin analogues achieve biochemical resolution in up to 70% of patients (275) and tumor shrinkage (mean size reduction of 50%) in 75% of patients (276). Pegvisomant is the only GH receptor antagonist therapy available and is the most effective therapy at achieving a biochemical cure but in a small proportion (~2%) leads to tumor growth.  Radiotherapy is generally reserved as a third line treatment due to the long-time taken to achieve maximum effect (up to 10 years (277)) and risks of hypopituitarism (up to 50% by 5 years post radiotherapy), visual problems and late effects of cerebrovascular disease and second tumors.  Given the rarity of GH secreting tumors in childhood close liaison with an adult endocrinologist experienced in the management of acromegaly is recommended for a pediatric endocrinologist when faces with such a patient.


McCune Albright Syndrome


McCune Albright syndrome is disorder characterized by the clinical triad of polyostotic fibrous dysplasia, café au lait skin hyperpigmentation and gonadotrophin independent precocious puberty. It is caused by postzygotic activating mutations of GNAS which encodes a stimulatory subunit of G protein, Gsα (278).  GHRH receptor is a G protein coupled receptor and thus McCune Albright syndrome can lead to autonomous GH hypersecretion from the pituitary by activating the signal transduction pathway downstream of this receptor. In a cohort of 58 children and adults with McCune Albright syndrome Akintoye et al (279) identified 12 patients (21%) with GH excess including 6 (4 female, 2 male) who were <16 years. IGF-I concentrations in 10/12 were >2.5 SD above mean but in 2 patients surprisingly they were low at -2.5 and -0.2 SD. This may be due to the cyclical nature of the hormone hypersecretion in McCune Albright syndrome. MR imaging identified microadenomas in 4 patients and no tumor visible in the remaining patients. Clinical diagnosis of GH excess remains difficult as the facial changes can be masked or mistaken for the development of fibrous dysplastic changes in bone and the precocious puberty can mask the GH induced growth excess. The presence of a normal final height in a patient with precocious puberty indicates the potential presence of GH excess (279). Co-secretion of prolactin is common and the majority of patients have hyperprolactinemia. Due to bone thickening and fibrous dysplasia surgery is not usually an option for treatment and radiotherapy is contra-indicated because of the potential for sarcomatous change in fibrous dysplasia. Of the 11 patients with MAS associated acromegaly 6 were treated with cabergoline and then octreotide. Although 5/6 responded to cabergoline treatment with a reduction in IGF-I concentrations none normalized their IGF-I concentration and a combination of cabergoline and octreotide normalized IGF-I concentrations in 4/6 patients.  In a crossover trial of somatostatin analogue therapy and Pegvisomant in McCune Albright induced GH excess pegvisomant was effective in normalizing IGF-I concentrations in 4/5 patients while somatostatin therapy was effective in 3/5 patients (280).


Carney Complex  


The Carney complex is an autosomal dominant disorder characterized by skin pigmentary abnormalities, myxomas, endocrine tumors or overactivity, and schwannomas. It is known to be caused by loss of function mutations in the PRKAR1A gene which encodes the regulatory subunit of protein kinase A (281). Dissociation of the regulatory subunits from the catalytic subunits of protein kinase A leads to activation of signal transduction. Under normal circumstances this dissociation is triggered by cAMP. Carney complex associated mutations lead to loss of the regulatory subunit and increased activity of protein kinase A associated signal transduction.  GH secreting adenomas are reported in 10% of patients with carney complex but these are rare before puberty (282). Mild abnormalities in GH, IGF-I and prolactin levels are present in up to 79% of patients and there probably a long period of sommatomammotroph cell hypertrophy and mild hypersecretion prior to the development of true GH excess (283). Histology of Carney complex associated GH tumors is distinct and includes the presence of multifocal tumors, somatomammotroph hypertrophy and the secretion of multiple hormones from the tumor (284).


CONCLUSIONS


Growth disorders are one of the most common reasons for referral to a pediatric endocrinologist. GH deficiency can be effectively treated with recombinant human growth hormone but controversy still exists over the diagnosis of GH deficiency in childhood, particularly in relation to priming of GH stimulation tests. Over the past decade there has been a great expansion in our knowledge of the genetic causes underlying the congenital disorders causing hypopituitarism and GH deficiency but this has not yet led to any new therapies. While extremely rare in pediatric practice GH excess is an important diagnosis to consider in the tall child/adolescent and management should be undertaken in conjunction with an adult endocrinologist.


Important Concepts


  • GH signal transduction is not induced by GHR dimerization but by a conformational change in the predimerized GHR leading to repositioning of the BOX1 motifs
  • The diagnosis of growth hormone deficiency is made by combining information from auxology, biochemistry, and neuroimaging.
  • In addition to GH deficiency and Laron syndrome there are now additional disorders of the GH-IGF-I axis – Stat5b deficiency, ALS deficiency, haploinsufficiency, and mutations in IGF1R and mutations in the IGF-I gene.
  • There is an expanding number of genes where mutations lead to a disturbance of pituitary gland formation and pituitary hormone deficiency, however in the majority of patients with congenital hypopituitarism the genetic etiology remains unknown. Consider genetic screening in patients where there are multiple affected individuals in the family and in children where they have associated eye abnormalities.
  • Response to growth hormone therapy is generally very good in patients with congenital GH deficiency where a final adult height within parental target range should be expected. In contrast, in patients with radiation induced GH deficiency, GH treatment is less effective and acts mainly to prevent further height loss.
  • Recombinant human IGF-I is available for treating children with GH insensitivity. While first year height velocity often improves significantly the long-term effects on height are less effective than in children with congenital GH deficiency treated with growth hormone.
  • GH excess is an extremely rare disorder in childhood. All childhood patients with a GH secreting adenoma should be screened for mutations in AIP and MEN1 and management should be shared with an adult endocrinologist.


REFERENCES


  1. Gluckman PD, Johnson-Barrett JJ, Butler JH, Edgar BW, Gunn TR. Studies of insulin-like growth factor -I and -II by specific radioligand assays in umbilical cord blood. Clinical endocrinology 1983; 19:405-413
  2. Verhaeghe J, Van Bree R, Van Herck E, Laureys J, Bouillon R, Van Assche FA. C-peptide, insulin-like growth factors I and II, and insulin-like growth factor binding protein-1 in umbilical cord serum: correlations with birth weight. American journal of obstetrics and gynecology 1993; 169:89-97
  3. Woods KA, Camacho-Hubner C, Savage MO, Clark AJ. Intrauterine growth retardation and postnatal growth failure associated with deletion of the insulin-like growth factor I gene. The New England journal of medicine 1996; 335:1363-1367
  4. Binder G, Hettmann S, Weber K, Kohlmuller D, Schweizer R. Analysis of the GH content within archived dried blood spots of newborn screening cards from children diagnosed with growth hormone deficiency after the neonatal period. Growth hormone & IGF research : official journal of the Growth Hormone Research Society and the International IGF Research Society 2011; 21:314-317
  5. Mayer M, Schmitt K, Kapelari K, Frisch H, Kostl G, Voigt M. Spontaneous growth in growth hormone deficiency from birth until 7 years of age: development of disease-specific growth curves. Hormone research in paediatrics 2010; 74:136-144
  6. Tanner JM. Fetus into man:physical growth from conception to maturity. . Cambridge, MA: Harvard University Press.
  7. Tanner JM. Regulation of Growth in Size in Mammals. Nature 1963; 199:845-850
  8. Baron J, Klein KO, Colli MJ, Yanovski JA, Novosad JA, Bacher JD, Cutler GB, Jr. Catch-up growth after glucocorticoid excess: a mechanism intrinsic to the growth plate. Endocrinology 1994; 135:1367-1371
  9. Giustina A, Scalvini T, Tassi C, Desenzani P, Poiesi C, Wehrenberg WB, Rogol AD, Veldhuis JD. Maturation of the regulation of growth hormone secretion in young males with hypogonadotropic hypogonadism pharmacologically exposed to progressive increments in serum testosterone. The Journal of clinical endocrinology and metabolism 1997; 82:1210-1219
  10. Weissberger AJ, Ho KK. Activation of the somatotropic axis by testosterone in adult males: evidence for the role of aromatization. The Journal of clinical endocrinology and metabolism 1993; 76:1407-1412
  11. Veldhuis JD, Metzger DL, Martha PM, Jr., Mauras N, Kerrigan JR, Keenan B, Rogol AD, Pincus SM. Estrogen and testosterone, but not a nonaromatizable androgen, direct network integration of the hypothalamo-somatotrope (growth hormone)-insulin-like growth factor I axis in the human: evidence from pubertal pathophysiology and sex-steroid hormone replacement. The Journal of clinical endocrinology and metabolism 1997; 82:3414-3420
  12. Meinhardt UJ, Ho KK. Modulation of growth hormone action by sex steroids. Clinical endocrinology 2006; 65:413-422
  13. Smith EP, Boyd J, Frank GR, Takahashi H, Cohen RM, Specker B, Williams TC, Lubahn DB, Korach KS. Estrogen resistance caused by a mutation in the estrogen-receptor gene in a man. The New England journal of medicine 1994; 331:1056-1061
  14. Morishima A, Grumbach MM, Simpson ER, Fisher C, Qin K. Aromatase deficiency in male and female siblings caused by a novel mutation and the physiological role of estrogens. The Journal of clinical endocrinology and metabolism 1995; 80:3689-3698
  15. Kojima M, Hosoda H, Date Y, Nakazato M, Matsuo H, Kangawa K. Ghrelin is a growth-hormone-releasing acylated peptide from stomach. Nature 1999; 402:656-660
  16. Gnanapavan S, Kola B, Bustin SA, Morris DG, McGee P, Fairclough P, Bhattacharya S, Carpenter R, Grossman AB, Korbonits M. The tissue distribution of the mRNA of ghrelin and subtypes of its receptor, GHS-R, in humans. The Journal of clinical endocrinology and metabolism 2002; 87:2988
  17. Inui A, Asakawa A, Bowers CY, Mantovani G, Laviano A, Meguid MM, Fujimiya M. Ghrelin, appetite, and gastric motility: the emerging role of the stomach as an endocrine organ. FASEB J 2004; 18:439-456
  18. Date Y, Nakazato M, Hashiguchi S, Dezaki K, Mondal MS, Hosoda H, Kojima M, Kangawa K, Arima T, Matsuo H, Yada T, Matsukura S. Ghrelin is present in pancreatic alpha-cells of humans and rats and stimulates insulin secretion. Diabetes 2002; 51:124-129
  19. Takaya K, Ariyasu H, Kanamoto N, Iwakura H, Yoshimoto A, Harada M, Mori K, Komatsu Y, Usui T, Shimatsu A, Ogawa Y, Hosoda K, Akamizu T, Kojima M, Kangawa K, Nakao K. Ghrelin strongly stimulates growth hormone release in humans. The Journal of clinical endocrinology and metabolism 2000; 85:4908-4911
  20. Tannenbaum GS, Epelbaum J, Bowers CY. Interrelationship between the novel peptide ghrelin and somatostatin/growth hormone-releasing hormone in regulation of pulsatile growth hormone secretion. Endocrinology 2003; 144:967-974
  21. Panetta R, Patel YC. Expression of mRNA for all five human somatostatin receptors (hSSTR1-5) in pituitary tumors. Life sciences 1995; 56:333-342
  22. Siler TM, VandenBerg G, Yen SS, Brazeau P, Vale W, Guillemin R. Inhibition of growth hormone release in humans by somatostatin. The Journal of clinical endocrinology and metabolism 1973; 37:632-634
  23. Broglio F, Koetsveld Pv P, Benso A, Gottero C, Prodam F, Papotti M, Muccioli G, Gauna C, Hofland L, Deghenghi R, Arvat E, Van Der Lely AJ, Ghigo E. Ghrelin secretion is inhibited by either somatostatin or cortistatin in humans. The Journal of clinical endocrinology and metabolism 2002; 87:4829-4832
  24. Hindmarsh PC, Matthews DR, Brook CG. Growth hormone secretion in children determined by time series analysis. Clinical endocrinology 1988; 29:35-44
  25. Skinner AM, Price DA, Addison GM, Clayton PE, Mackay RI, Soo A, Mui CY. The influence of age, size, pubertal status and renal factors on urinary growth hormone excretion in normal children and adolescents. Growth Regul 1992; 2:156-160
  26. Hindmarsh PC, Fall CH, Pringle PJ, Osmond C, Brook CG. Peak and trough growth hormone concentrations have different associations with the insulin-like growth factor axis, body composition, and metabolic parameters. The Journal of clinical endocrinology and metabolism 1997; 82:2172-2176
  27. Niall HD. Revised primary structure for human growth hormone. Nature: New biology 1971; 230:90-91
  28. Masuda N, Watahiki M, Tanaka M, Yamakawa M, Shimizu K, Nagai J, Nakashima K. Molecular cloning of cDNA encoding 20 kDa variant human growth hormone and the alternative splicing mechanism. Biochimica et biophysica acta 1988; 949:125-131
  29. Lewis UJ, Dunn JT, Bonewald LF, Seavey BK, Vanderlaan WP. A naturally occurring structural variant of human growth hormone. The Journal of biological chemistry 1978; 253:2679-2687
  30. Zhang Y, Jiang J, Black RA, Baumann G, Frank SJ. Tumor necrosis factor-alpha converting enzyme (TACE) is a growth hormone binding protein (GHBP) sheddase: the metalloprotease TACE/ADAM-17 is critical for (PMA-induced) GH receptor proteolysis and GHBP generation. Endocrinology 2000; 141:4342-4348
  31. Martini JF, Pezet A, Guezennec CY, Edery M, Postel-Vinay MC, Kelly PA. Monkey growth hormone (GH) receptor gene expression. Evidence for two mechanisms for the generation of the GH binding protein. The Journal of biological chemistry 1997; 272:18951-18958
  32. Baumann G. Growth hormone binding protein 2001. Journal of pediatric endocrinology & metabolism : JPEM 2001; 14:355-375
  33. Fairhall KM, Carmignac DF, Robinson IC. Growth hormone (GH) binding protein and GH interactions in vivo in the guinea pig. Endocrinology 1992; 131:1963-1969
  34. Maheshwari H, Lillioja S, Castillo CE, Mercado M, Baumann G. Growth hormone-binding protein in human lymph. The Journal of clinical endocrinology and metabolism 1995; 80:3582-3584
  35. Brown RJ, Adams JJ, Pelekanos RA, Wan Y, McKinstry WJ, Palethorpe K, Seeber RM, Monks TA, Eidne KA, Parker MW, Waters MJ. Model for growth hormone receptor activation based on subunit rotation within a receptor dimer. Nature structural & molecular biology 2005; 12:814-821
  36. Strous GJ, dos Santos CA, Gent J, Govers R, Sachse M, Schantl J, van Kerkhof P. Ubiquitin system-dependent regulation of growth hormone receptor signal transduction. Current topics in microbiology and immunology 2004; 286:81-118
  37. Brooks AJ, Waters MJ. The growth hormone receptor: mechanism of activation and clinical implications. Nature reviews Endocrinology 2010; 6:515-525
  38. Brooks AJ, Dai W, O'Mara ML, Abankwa D, Chhabra Y, Pelekanos RA, Gardon O, Tunny KA, Blucher KM, Morton CJ, Parker MW, Sierecki E, Gambin Y, Gomez GA, Alexandrov K, Wilson IA, Doxastakis M, Mark AE, Waters MJ. Mechanism of activation of protein kinase JAK2 by the growth hormone receptor. Science 2014; 344:1249783
  39. Lanning NJ, Carter-Su C. Recent advances in growth hormone signaling. Reviews in endocrine & metabolic disorders 2006; 7:225-235
  40. Rowlinson SW, Yoshizato H, Barclay JL, Brooks AJ, Behncken SN, Kerr LM, Millard K, Palethorpe K, Nielsen K, Clyde-Smith J, Hancock JF, Waters MJ. An agonist-induced conformational change in the growth hormone receptor determines the choice of signalling pathway. Nature cell biology 2008; 10:740-747
  41. Saharinen P, Vihinen M, Silvennoinen O. Autoinhibition of Jak2 tyrosine kinase is dependent on specific regions in its pseudokinase domain. Molecular biology of the cell 2003; 14:1448-1459
  42. Boisclair YR, Rhoads RP, Ueki I, Wang J, Ooi GT. The acid-labile subunit (ALS) of the 150 kDa IGF-binding protein complex: an important but forgotten component of the circulating IGF system. The Journal of endocrinology 2001; 170:63-70
  43. Seccareccia E, Brodt P. The role of the insulin-like growth factor-I receptor in malignancy: an update. Growth hormone & IGF research : official journal of the Growth Hormone Research Society and the International IGF Research Society 2012; 22:193-199
  44. Dupont J, Holzenberger M. IGF type 1 receptor: a cell cycle progression factor that regulates aging. Cell cycle 2003; 2:270-272
  45. Baker J, Liu JP, Robertson EJ, Efstratiadis A. Role of insulin-like growth factors in embryonic and postnatal growth. Cell 1993; 75:73-82
  46. Liu JL, Yakar S, LeRoith D. Conditional knockout of mouse insulin-like growth factor-1 gene using the Cre/loxP system. Proc Soc Exp Biol Med 2000; 223:344-351
  47. Yakar S, Rosen CJ, Beamer WG, Ackert-Bicknell CL, Wu Y, Liu JL, Ooi GT, Setser J, Frystyk J, Boisclair YR, LeRoith D. Circulating levels of IGF-1 directly regulate bone growth and density. J Clin Invest 2002; 110:771-781
  48. Growth Hormone Research S. Consensus guidelines for the diagnosis and treatment of growth hormone (GH) deficiency in childhood and adolescence: summary statement of the GH Research Society. GH Research Society. The Journal of clinical endocrinology and metabolism 2000; 85:3990-3993
  49. Richmond EJ, Rogol AD. Growth hormone deficiency in children. Pituitary 2008; 11:115-120
  50. Eugster EA, Pescovitz OH. Gigantism. The Journal of clinical endocrinology and metabolism 1999; 84:4379-4384
  51. Murray PG, Hague C, Fafoula O, Patel L, Raabe AL, Cusick C, Hall CM, Wright NB, Amin R, Clayton PE. Associations with multiple pituitary hormone deficiency in patients with an ectopic posterior pituitary gland. Clinical endocrinology 2008; 69:597-602
  52. Clemmons DR. Consensus statement on the standardization and evaluation of growth hormone and insulin-like growth factor assays. Clinical chemistry 2011; 57:555-559
  53. Kaplan SL, Abrams CA, Bell JJ, Conte FA, Grumbach MM. Growth and growth hormone. I. Changes in serum level of growth hormone following hypoglycemia in 134 children with growth retardation. Pediatric research 1968; 2:43-63
  54. Shah A, Stanhope R, Matthew D. Hazards of pharmacological tests of growth hormone secretion in childhood. Bmj 1992; 304:173-174
  55. Mitchell ML, Sawin CT. Growth hormone response to glucagon in diabetic and nondiabetic persons. Israel journal of medical sciences 1972; 8:867
  56. Ghigo E, Bellone J, Aimaretti G, Bellone S, Loche S, Cappa M, Bartolotta E, Dammacco F, Camanni F. Reliability of provocative tests to assess growth hormone secretory status. Study in 472 normally growing children. The Journal of clinical endocrinology and metabolism 1996; 81:3323-3327
  57. Zadik Z, Chalew SA, Gilula Z, Kowarski AA. Reproducibility of growth hormone testing procedures: a comparison between 24-hour integrated concentration and pharmacological stimulation. The Journal of clinical endocrinology and metabolism 1990; 71:1127-1130
  58. Muller A, Scholz M, Blankenstein O, Binder G, Pfaffle R, Korner A, Kiess W, Heider A, Bidlingmaier M, Thiery J, Kratzsch J. Harmonization of growth hormone measurements with different immunoassays by data adjustment. Clinical chemistry and laboratory medicine : CCLM / FESCC 2011; 49:1135-1142
  59. Corneli G, Di Somma C, Baldelli R, Rovere S, Gasco V, Croce CG, Grottoli S, Maccario M, Colao A, Lombardi G, Ghigo E, Camanni F, Aimaretti G. The cut-off limits of the GH response to GH-releasing hormone-arginine test related to body mass index. European journal of endocrinology / European Federation of Endocrine Societies 2005; 153:257-264
  60. Tauber M, Moulin P, Pienkowski C, Jouret B, Rochiccioli P. Growth hormone (GH) retesting and auxological data in 131 GH-deficient patients after completion of treatment. The Journal of clinical endocrinology and metabolism 1997; 82:352-356
  61. Marin G, Domene HM, Barnes KM, Blackwell BJ, Cassorla FG, Cutler GB, Jr. The effects of estrogen priming and puberty on the growth hormone response to standardized treadmill exercise and arginine-insulin in normal girls and boys. The Journal of clinical endocrinology and metabolism 1994; 79:537-541
  62. Lazar L, Phillip M. Is sex hormone priming in peripubertal children prior to growth hormone stimulation tests still appropriate? Hormone research in paediatrics 2010; 73:299-302
  63. Saini S, Hindmarsh PC, Matthews DR, Pringle PJ, Jones J, Preece MA, Brook CG. Reproducibility of 24-hour serum growth hormone profiles in man. Clinical endocrinology 1991; 34:455-462
  64. Spiliotis BE, August GP, Hung W, Sonis W, Mendelson W, Bercu BB. Growth hormone neurosecretory dysfunction. A treatable cause of short stature. Jama 1984; 251:2223-2230
  65. Juul A, Skakkebaek NE. Prediction of the outcome of growth hormone provocative testing in short children by measurement of serum levels of insulin-like growth factor I and insulin-like growth factor binding protein 3. The Journal of pediatrics 1997; 130:197-204
  66. Cianfarani S, Tondinelli T, Spadoni GL, Scire G, Boemi S, Boscherini B. Height velocity and IGF-I assessment in the diagnosis of childhood onset GH insufficiency: do we still need a second GH stimulation test? Clinical endocrinology 2002; 57:161-167
  67. Triulzi F, Scotti G, di Natale B, Pellini C, Lukezic M, Scognamiglio M, Chiumello G. Evidence of a congenital midline brain anomaly in pituitary dwarfs: a magnetic resonance imaging study in 101 patients. Pediatrics 1994; 93:409-416
  68. Genovese E, Maghnie M, Beluffi G, Villa A, Sammarchi L, Severi F, Campani R. Hypothalamic-pituitary vascularization in pituitary stalk transection syndrome: is the pituitary stalk really transected? The role of gadolinium-DTPA with spin-echo T1 imaging and turbo-FLASH technique. Pediatric radiology 1997; 27:48-53
  69. Murray PG, Hague C, Fafoula O, Gleeson H, Patel L, Banerjee I, Raabe AL, Hall CM, Wright NB, Amin R, Clayton PE. Likelihood of persistent GH deficiency into late adolescence: relationship to the presence of an ectopic or normally sited posterior pituitary gland. Clinical endocrinology 2009; 71:215-219
  70. Collett-Solberg PF, Ambler G, Backeljauw PF, Bidlingmaier M, Biller BMK, Boguszewski MCS, Cheung PT, Choong CSY, Cohen LE, Cohen P, Dauber A, Deal CL, Gong C, Hasegawa Y, Hoffman AR, Hofman PL, Horikawa R, Jorge AAL, Juul A, Kamenicky P, Khadilkar V, Kopchick JJ, Kristrom B, Lopes MLA, Luo X, Miller BS, Misra M, Netchine I, Radovick S, Ranke MB, Rogol AD, Rosenfeld RG, Saenger P, Wit JM, Woelfle J. Diagnosis, Genetics, and Therapy of Short Stature in Children: A Growth Hormone Research Society International Perspective. Horm Res Paediatr 2019; 92:1-14
  71. Kristrom B, Aronson AS, Dahlgren J, Gustafsson J, Halldin M, Ivarsson SA, Nilsson NO, Svensson J, Tuvemo T, Albertsson-Wikland K. Growth hormone (GH) dosing during catch-up growth guided by individual responsiveness decreases growth response variability in prepubertal children with GH deficiency or idiopathic short stature. The Journal of clinical endocrinology and metabolism 2009; 94:483-490
  72. Cohen P, Rogol AD, Weng W, Kappelgaard AM, Rosenfeld RG, Germak J, American Norditropin Study G. Efficacy of IGF-based growth hormone (GH) dosing in nonGH-deficient (nonGHD) short stature children with low IGF-I is not related to basal IGF-I levels. Clinical endocrinology 2013; 78:405-414
  73. Bang P, Ahmed SF, Argente J, Backeljauw P, Bettendorf M, Bona G, Coutant R, Rosenfeld RG, Walenkamp MJ, Savage MO. Identification and management of poor response to growth-promoting therapy in children with short stature. Clinical endocrinology 2012; 77:169-181
  74. Lal RA, Hoffman AR. Long-Acting Growth Hormone Preparations in the Treatment of Children. Pediatr Endocrinol Rev 2018; 16:162-167
  75. Johannsson G, Gordon MB, Hojby Rasmussen M, Hakonsson IH, Karges W, Svaerke C, Tahara S, Takano K, Biller BMK. Once-weekly Somapacitan is Effective and Well Tolerated in Adults with GH Deficiency: A Randomized Phase 3 Trial. The Journal of clinical endocrinology and metabolism 2020; 105
  76. Ranke MB, Lindberg A, Chatelain P, Wilton P, Cutfield W, Albertsson-Wikland K, Price DA. Derivation and validation of a mathematical model for predicting the response to exogenous recombinant human growth hormone (GH) in prepubertal children with idiopathic GH deficiency. KIGS International Board. Kabi Pharmacia International Growth Study. The Journal of clinical endocrinology and metabolism 1999; 84:1174-1183
  77. Ranke MB, Lindberg A, Albertsson-Wikland K, Wilton P, Price DA, Reiter EO. Increased response, but lower responsiveness, to growth hormone (GH) in very young children (aged 0-3 years) with idiopathic GH Deficiency: analysis of data from KIGS. The Journal of clinical endocrinology and metabolism 2005; 90:1966-1971
  78. Schonau E, Westermann F, Rauch F, Stabrey A, Wassmer G, Keller E, Bramswig J, Blum WF, German Lilly Growth Response Study G. A new and accurate prediction model for growth response to growth hormone treatment in children with growth hormone deficiency. European journal of endocrinology / European Federation of Endocrine Societies 2001; 144:13-20
  79. Sudfeld H, Kiese K, Heinecke A, Bramswig JH. Prediction of growth response in prepubertal children treated with growth hormone for idiopathic growth hormone deficiency. Acta Paediatr 2000; 89:34-37
  80. Dos Santos C, Essioux L, Teinturier C, Tauber M, Goffin V, Bougneres P. A common polymorphism of the growth hormone receptor is associated with increased responsiveness to growth hormone. Nature genetics 2004; 36:720-724
  81. Renehan AG, Solomon M, Zwahlen M, Morjaria R, Whatmore A, Audi L, Binder G, Blum W, Bougneres P, Santos CD, Carrascosa A, Hokken-Koelega A, Jorge A, Mullis PE, Tauber M, Patel L, Clayton PE. Growth hormone receptor polymorphism and growth hormone therapy response in children: a Bayesian meta-analysis. American journal of epidemiology 2012; 175:867-877
  82. Clayton P, Chatelain P, Tato L, Yoo HW, Ambler GR, Belgorosky A, Quinteiro S, Deal C, Stevens A, Raelson J, Croteau P, Destenaves B, Olivier C. A pharmacogenomic approach to the treatment of children with GH deficiency or Turner syndrome. European journal of endocrinology / European Federation of Endocrine Societies 2013; 169:277-289
  83. Stevens A, Clayton P, Tato L, Yoo HW, Rodriguez-Arnao MD, Skorodok J, Ambler GR, Zignani M, Zieschang J, Della Corte G, Destenaves B, Champigneulle A, Raelson J, Chatelain P. Pharmacogenomics of insulin-like growth factor-I generation during GH treatment in children with GH deficiency or Turner syndrome. The pharmacogenomics journal 2013;
  84. Dauber A, Meng Y, Audi L, Vedantam S, Weaver B, Carrascosa A, Albertsson-Wikland K, Ranke MB, Jorge AAL, Cara J, Wajnrajch MP, Lindberg A, Camacho-Hubner C, Hirschhorn JN. A Genome-Wide Pharmacogenetic Study of Growth Hormone Responsiveness. The Journal of clinical endocrinology and metabolism 2020; 105
  85. Cacciari E, Zucchini S, Carla G, Pirazzoli P, Cicognani A, Mandini M, Busacca M, Trevisan C. Endocrine function and morphological findings in patients with disorders of the hypothalamo-pituitary area: a study with magnetic resonance. Archives of disease in childhood 1990; 65:1199-1202
  86. Maghnie M, Lindberg A, Koltowska-Haggstrom M, Ranke MB. Magnetic resonance imaging of CNS in 15,043 children with GH deficiency in KIGS (Pfizer International Growth Database). European journal of endocrinology / European Federation of Endocrine Societies 2013; 168:211-217
  87. Phillips JA, 3rd, Cogan JD. Genetic basis of endocrine disease. 6. Molecular basis of familial human growth hormone deficiency. The Journal of clinical endocrinology and metabolism 1994; 78:11-16
  88. Lin SC, Lin CR, Gukovsky I, Lusis AJ, Sawchenko PE, Rosenfeld MG. Molecular basis of the little mouse phenotype and implications for cell type-specific growth. Nature 1993; 364:208-213
  89. Wajnrajch MP, Gertner JM, Harbison MD, Chua SC, Jr., Leibel RL. Nonsense mutation in the human growth hormone-releasing hormone receptor causes growth failure analogous to the little (lit) mouse. Nature genetics 1996; 12:88-90
  90. Mullis PE. Genetics of isolated growth hormone deficiency. Journal of clinical research in pediatric endocrinology 2010; 2:52-62
  91. Alba M, Hall CM, Whatmore AJ, Clayton PE, Price DA, Salvatori R. Variability in anterior pituitary size within members of a family with GH deficiency due to a new splice mutation in the GHRH receptor gene. Clinical endocrinology 2004; 60:470-475
  92. Alatzoglou KS, Dattani MT. Phenotype-genotype correlations in congenital isolated growth hormone deficiency (IGHD). Indian journal of pediatrics 2012; 79:99-106
  93. Binder G, Keller E, Mix M, Massa GG, Stokvis-Brantsma WH, Wit JM, Ranke MB. Isolated GH deficiency with dominant inheritance: new mutations, new insights. The Journal of clinical endocrinology and metabolism 2001; 86:3877-3881
  94. Lee MS, Wajnrajch MP, Kim SS, Plotnick LP, Wang J, Gertner JM, Leibel RL, Dannies PS. Autosomal dominant growth hormone (GH) deficiency type II: the Del32-71-GH deletion mutant suppresses secretion of wild-type GH. Endocrinology 2000; 141:883-890
  95. Shariat N, Ryther RC, Phillips JA, 3rd, Robinson IC, Patton JG. Rescue of pituitary function in a mouse model of isolated growth hormone deficiency type II by RNA interference. Endocrinology 2008; 149:580-586
  96. Zhu YL, Conway-Campbell B, Waters MJ, Dannies PS. Prolonged retention after aggregation into secretory granules of human R183H-growth hormone (GH), a mutant that causes autosomal dominant GH deficiency type II. Endocrinology 2002; 143:4243-4248
  97. Salemi S, Yousefi S, Baltensperger K, Robinson IC, Eble A, Simon D, Czernichow P, Binder G, Sonnet E, Mullis PE. Variability of isolated autosomal dominant GH deficiency (IGHD II): impact of the P89L GH mutation on clinical follow-up and GH secretion. European journal of endocrinology / European Federation of Endocrine Societies 2005; 153:791-802
  98. Duriez B, Duquesnoy P, Dastot F, Bougneres P, Amselem S, Goossens M. An exon-skipping mutation in the btk gene of a patient with X-linked agammaglobulinemia and isolated growth hormone deficiency. FEBS Lett 1994; 346:165-170
  99. Argente J, Flores R, Gutierrez-Arumi A, Verma B, Martos-Moreno GA, Cusco I, Oghabian A, Chowen JA, Frilander MJ, Perez-Jurado LA. Defective minor spliceosome mRNA processing results in isolated familial growth hormone deficiency. EMBO molecular medicine 2014; 6:299-306
  100. Martos-Moreno GA, Travieso-Suarez L, Pozo-Roman J, Munoz-Calvo MT, Chowen JA, Frilander MJ, Perez-Jurado LA, Hawkins FG, Argente J. Response to growth hormone in patients with RNPC3 mutations. EMBO Mol Med 2018; 10
  101. Bancalari RE, Gregory LC, McCabe MJ, Dattani MT. Pituitary gland development: an update. Endocrine development 2012; 23:1-15
  102. Dattani MT, Martinez-Barbera JP, Thomas PQ, Brickman JM, Gupta R, Martensson IL, Toresson H, Fox M, Wales JKH, Hindmarsh PC, Krauss S, Beddington RSP, Robinson ICAF. Mutations in the homeobox gene HESX1/Hesx1 associated with septo-optic dysplasia in human and mouse. Nature genetics 1998; 19:125-133
  103. Brickman JM, Clements M, Tyrell R, McNay D, Woods K, Warner J, Stewart A, Beddington RS, Dattani M. Molecular effects of novel mutations in Hesx1/HESX1 associated with human pituitary disorders. Development (Cambridge, England) 2001; 128:5189-5199
  104. Reynaud R, Albarel F, Saveanu A, Kaffel N, Castinetti F, Lecomte P, Brauner R, Simonin G, Gaudart J, Carmona E, Enjalbert A, Barlier A, Brue T. Pituitary stalk interruption syndrome in 83 patients: novel HESX1 mutation and severe hormonal prognosis in malformative forms. European journal of endocrinology / European Federation of Endocrine Societies 2011; 164:457-465
  105. Dateki S, Kosaka K, Hasegawa K, Tanaka H, Azuma N, Yokoya S, Muroya K, Adachi M, Tajima T, Motomura K, Kinoshita E, Moriuchi H, Sato N, Fukami M, Ogata T. Heterozygous orthodenticle homeobox 2 mutations are associated with variable pituitary phenotype. The Journal of clinical endocrinology and metabolism 2010; 95:756-764
  106. Rizzoti K, Lovell-Badge R. Early development of the pituitary gland: induction and shaping of Rathke's pouch. Reviews in endocrine & metabolic disorders 2005; 6:161-172
  107. Solomon NM, Nouri S, Warne GL, Lagerstrom-Fermer M, Forrest SM, Thomas PQ. Increased gene dosage at Xq26-q27 is associated with X-linked hypopituitarism. Genomics 2002; 79:553-559
  108. Laumonnier F, Ronce N, Hamel BC, Thomas P, Lespinasse J, Raynaud M, Paringaux C, Van Bokhoven H, Kalscheuer V, Fryns JP, Chelly J, Moraine C, Briault S. Transcription factor SOX3 is involved in X-linked mental retardation with growth hormone deficiency. American journal of human genetics 2002; 71:1450-1455
  109. Alatzoglou KS, Kelberman D, Cowell CT, Palmer R, Arnhold IJ, Melo ME, Schnabel D, Grueters A, Dattani MT. Increased transactivation associated with SOX3 polyalanine tract deletion in a patient with hypopituitarism. The Journal of clinical endocrinology and metabolism 2011; 96:E685-690
  110. Tumer Z, Bach-Holm D. Axenfeld-Rieger syndrome and spectrum of PITX2 and FOXC1 mutations. Eur J Hum Genet 2009; 17:1527-1539
  111. Bonfig W, Krude H, Schmidt H. A novel mutation of LHX3 is associated with combined pituitary hormone deficiency including ACTH deficiency, sensorineural hearing loss, and short neck-a case report and review of the literature. European journal of pediatrics 2011; 170:1017-1021
  112. Pfaeffle RW, Savage JJ, Hunter CS, Palme C, Ahlmann M, Kumar P, Bellone J, Schoenau E, Korsch E, Bramswig JH, Stobbe HM, Blum WF, Rhodes SJ. Four novel mutations of the LHX3 gene cause combined pituitary hormone deficiencies with or without limited neck rotation. The Journal of clinical endocrinology and metabolism 2007; 92:1909-1919
  113. Pfaeffle RW, Hunter CS, Savage JJ, Duran-Prado M, Mullen RD, Neeb ZP, Eiholzer U, Hesse V, Haddad NG, Stobbe HM, Blum WF, Weigel JF, Rhodes SJ. Three novel missense mutations within the LHX4 gene are associated with variable pituitary hormone deficiencies. The Journal of clinical endocrinology and metabolism 2008; 93:1062-1071
  114. Machinis K, Pantel J, Netchine I, Leger J, Camand OJ, Sobrier ML, Dastot-Le Moal F, Duquesnoy P, Abitbol M, Czernichow P, Amselem S. Syndromic short stature in patients with a germline mutation in the LIM homeobox LHX4. American journal of human genetics 2001; 69:961-968
  115. Franca MM, Jorge AA, Carvalho LR, Costalonga EF, Vasques GA, Leite CC, Mendonca BB, Arnhold IJ. Novel heterozygous nonsense GLI2 mutations in patients with hypopituitarism and ectopic posterior pituitary lobe without holoprosencephaly. The Journal of clinical endocrinology and metabolism 2010; 95:E384-391
  116. Roessler E, Du YZ, Mullor JL, Casas E, Allen WP, Gillessen-Kaesbach G, Roeder ER, Ming JE, Ruiz i Altaba A, Muenke M. Loss-of-function mutations in the human GLI2 gene are associated with pituitary anomalies and holoprosencephaly-like features. Proceedings of the National Academy of Sciences of the United States of America 2003; 100:13424-13429
  117. Raivio T, Avbelj M, McCabe MJ, Romero CJ, Dwyer AA, Tommiska J, Sykiotis GP, Gregory LC, Diaczok D, Tziaferi V, Elting MW, Padidela R, Plummer L, Martin C, Feng B, Zhang C, Zhou QY, Chen H, Mohammadi M, Quinton R, Sidis Y, Radovick S, Dattani MT, Pitteloud N. Genetic overlap in Kallmann syndrome, combined pituitary hormone deficiency, and septo-optic dysplasia. The Journal of clinical endocrinology and metabolism 2012; 97:E694-699
  118. Turton JP, Mehta A, Raza J, Woods KS, Tiulpakov A, Cassar J, Chong K, Thomas PQ, Eunice M, Ammini AC, Bouloux PM, Starzyk J, Hindmarsh PC, Dattani MT. Mutations within the transcription factor PROP1 are rare in a cohort of patients with sporadic combined pituitary hormone deficiency (CPHD). Clinical endocrinology 2005; 63:10-18
  119. Tatsumi K, Miyai K, Notomi T, Kaibe K, Amino N, Mizuno Y, Kohno H. Cretinism with combined hormone deficiency caused by a mutation in the PIT1 gene. Nature genetics 1992; 1:56-58
  120. Sun Y, Bak B, Schoenmakers N, van Trotsenburg AS, Oostdijk W, Voshol P, Cambridge E, White JK, le Tissier P, Gharavy SN, Martinez-Barbera JP, Stokvis-Brantsma WH, Vulsma T, Kempers MJ, Persani L, Campi I, Bonomi M, Beck-Peccoz P, Zhu H, Davis TM, Hokken-Koelega AC, Del Blanco DG, Rangasami JJ, Ruivenkamp CA, Laros JF, Kriek M, Kant SG, Bosch CA, Biermasz NR, Appelman-Dijkstra NM, Corssmit EP, Hovens GC, Pereira AM, den Dunnen JT, Wade MG, Breuning MH, Hennekam RC, Chatterjee K, Dattani MT, Wit JM, Bernard DJ. Loss-of-function mutations in IGSF1 cause an X-linked syndrome of central hypothyroidism and testicular enlargement. Nature genetics 2012; 44:1375-1381
  121. Joustra SD, Schoenmakers N, Persani L, Campi I, Bonomi M, Radetti G, Beck-Peccoz P, Zhu H, Davis TM, Sun Y, Corssmit EP, Appelman-Dijkstra NM, Heinen CA, Pereira AM, Varewijck AJ, Janssen JA, Endert E, Hennekam RC, Lombardi MP, Mannens MM, Bak B, Bernard DJ, Breuning MH, Chatterjee K, Dattani MT, Oostdijk W, Biermasz NR, Wit JM, van Trotsenburg AS. The IGSF1 deficiency syndrome: characteristics of male and female patients. The Journal of clinical endocrinology and metabolism 2013; 98:4942-4952
  122. Joustra SD, Heinen CA, Schoenmakers N, Bonomi M, Ballieux BE, Turgeon MO, Bernard DJ, Fliers E, van Trotsenburg AS, Losekoot M, Persani L, Wit JM, Biermasz NR, Pereira AM, Oostdijk W, Group ICC. IGSF1 Deficiency: Lessons From an Extensive Case Series and Recommendations for Clinical Management. The Journal of clinical endocrinology and metabolism 2016; 101:1627-1636
  123. Howard SR, Guasti L, Ruiz-Babot G, Mancini A, David A, Storr HL, Metherell LA, Sternberg MJ, Cabrera CP, Warren HR, Barnes MR, Quinton R, de Roux N, Young J, Guiochon-Mantel A, Wehkalampi K, Andre V, Gothilf Y, Cariboni A, Dunkel L. IGSF10 mutations dysregulate gonadotropin-releasing hormone neuronal migration resulting in delayed puberty. EMBO molecular medicine 2016; 8:626-642
  124. Webb EA, AlMutair A, Kelberman D, Bacchelli C, Chanudet E, Lescai F, Andoniadou CL, Banyan A, Alsawaid A, Alrifai MT, Alahmesh MA, Balwi M, Mousavy-Gharavy SN, Lukovic B, Burke D, McCabe MJ, Kasia T, Kleta R, Stupka E, Beales PL, Thompson DA, Chong WK, Alkuraya FS, Martinez-Barbera JP, Sowden JC, Dattani MT. ARNT2 mutation causes hypopituitarism, post-natal microcephaly, visual and renal anomalies. Brain : a journal of neurology 2013; 136:3096-3105
  125. Brachet C, Kozhemyakina EA, Boros E, Heinrichs C, Balikova I, Soblet J, Smits G, Vilain C, Mathers PH. Truncating RAX Mutations: Anophthalmia, Hypopituitarism, Diabetes Insipidus, and Cleft Palate in Mice and Men. The Journal of clinical endocrinology and metabolism 2019; 104:2925-2930
  126. Tahoun M, Chandler JC, Ashton E, Haston S, Hannan A, Kim JS, D'Arco F, Bockenhauer D, Anderson G, Lin MH, Marzouk S, Saied MH, Miner JH, Dattani MT, Waters AM. Mutations in LAMB2 Are Associated With Albuminuria and Optic Nerve Hypoplasia With Hypopituitarism. The Journal of clinical endocrinology and metabolism 2020; 105
  127. Adly N, Alhashem A, Ammari A, Alkuraya FS. Ciliary genes TBC1D32/C6orf170 and SCLT1 are mutated in patients with OFD type IX. Hum Mutat 2014; 35:36-40
  128. Hietamaki J, Gregory LC, Ayoub S, Iivonen AP, Vaaralahti K, Liu X, Brandstack N, Buckton AJ, Laine T, Kansakoski J, Hero M, Miettinen PJ, Varjosalo M, Wakeling E, Dattani MT, Raivio T. Loss-of-Function Variants in TBC1D32 Underlie Syndromic Hypopituitarism. The Journal of clinical endocrinology and metabolism 2020; 105
  129. Lucas-Herald AK, Kinning E, Iida A, Wang Z, Miyake N, Ikegawa S, McNeilly J, Ahmed SF. A case of functional growth hormone deficiency and early growth retardation in a child with IFT172 mutations. The Journal of clinical endocrinology and metabolism 2015; 100:1221-1224
  130. Gregory LC, Shah P, Sanner JRF, Arancibia M, Hurst J, Jones WD, Spoudeas H, Le Quesne Stabej P, Williams HJ, Ocaka LA, Loureiro C, Martinez-Aguayo A, Dattani MT. Mutations in MAGEL2 and L1CAM Are Associated With Congenital Hypopituitarism and Arthrogryposis. The Journal of clinical endocrinology and metabolism 2019; 104:5737-5750
  131. Gregory LC, Ferreira CB, Young-Baird SK, Williams HJ, Harakalova M, van Haaften G, Rahman SA, Gaston-Massuet C, Kelberman D, Gosgene, Qasim W, Camper SA, Dever TE, Shah P, Robinson I, Dattani MT. Impaired EIF2S3 function associated with a novel phenotype of X-linked hypopituitarism with glucose dysregulation. EBioMedicine 2019; 42:470-480
  132. Vajravelu ME, Chai J, Krock B, Baker S, Langdon D, Alter C, De Leon DD. Congenital Hyperinsulinism and Hypopituitarism Attributable to a Mutation in FOXA2. The Journal of clinical endocrinology and metabolism 2018; 103:1042-1047
  133. Bashamboo A, Bignon-Topalovic J, Rouba H, McElreavey K, Brauner R. A Nonsense Mutation in the Hedgehog Receptor CDON Associated With Pituitary Stalk Interruption Syndrome. The Journal of clinical endocrinology and metabolism 2016; 101:12-15
  134. Karaca E, Buyukkaya R, Pehlivan D, Charng WL, Yaykasli KO, Bayram Y, Gambin T, Withers M, Atik MM, Arslanoglu I, Bolu S, Erdin S, Buyukkaya A, Yaykasli E, Jhangiani SN, Muzny DM, Gibbs RA, Lupski JR. Whole-exome sequencing identifies homozygous GPR161 mutation in a family with pituitary stalk interruption syndrome. The Journal of clinical endocrinology and metabolism 2015; 100:E140-147
  135. Bashamboo A, Bignon-Topalovic J, Moussi N, McElreavey K, Brauner R. Mutations in the Human ROBO1 Gene in Pituitary Stalk Interruption Syndrome. The Journal of clinical endocrinology and metabolism 2017; 102:2401-2406
  136. Kowarski AA, Schneider J, Ben-Galim E, Weldon VV, Daughaday WH. Growth failure with normal serum RIA-GH and low somatomedin activity: somatomedin restoration and growth acceleration after exogenous GH. The Journal of clinical endocrinology and metabolism 1978; 47:461-464
  137. Takahashi Y, Shirono H, Arisaka O, Takahashi K, Yagi T, Koga J, Kaji H, Okimura Y, Abe H, Tanaka T, Chihara K. Biologically inactive growth hormone caused by an amino acid substitution. J Clin Invest 1997; 100:1159-1165
  138. Takahashi Y, Kaji H, Okimura Y, Goji K, Abe H, Chihara K. Short stature caused by a mutant growth hormone with an antagonistic effect. Endocrine journal 1996; 43 Suppl:S27-32
  139. Takahashi Y, Kaji H, Okimura Y, Goji K, Abe H, Chihara K. Brief report: short stature caused by a mutant growth hormone. The New England journal of medicine 1996; 334:432-436
  140. Petkovic V, Besson A, Thevis M, Lochmatter D, Eble A, Fluck CE, Mullis PE. Evaluation of the biological activity of a growth hormone (GH) mutant (R77C) and its impact on GH responsiveness and stature. The Journal of clinical endocrinology and metabolism 2007; 92:2893-2901
  141. Petkovic V, Thevis M, Lochmatter D, Besson A, Eble A, Fluck CE, Mullis PE. GH mutant (R77C) in a pedigree presenting with the delay of growth and pubertal development: structural analysis of the mutant and evaluation of the biological activity. European journal of endocrinology / European Federation of Endocrine Societies 2007; 157 Suppl 1:S67-74
  142. Besson A, Salemi S, Deladoey J, Vuissoz JM, Eble A, Bidlingmaier M, Burgi S, Honegger U, Fluck C, Mullis PE. Short stature caused by a biologically inactive mutant growth hormone (GH-C53S). The Journal of clinical endocrinology and metabolism 2005; 90:2493-2499
  143. Godowski PJ, Leung DW, Meacham LR, Galgani JP, Hellmiss R, Keret R, Rotwein PS, Parks JS, Laron Z, Wood WI. Characterization of the human growth hormone receptor gene and demonstration of a partial gene deletion in two patients with Laron-type dwarfism. Proceedings of the National Academy of Sciences of the United States of America 1989; 86:8083-8087
  144. Laron Z, Pertzelan A, Mannheimer S. Genetic pituitary dwarfism with high serum concentation of growth hormone--a new inborn error of metabolism? Israel journal of medical sciences 1966; 2:152-155
  145. David A, Hwa V, Metherell LA, Netchine I, Camacho-Hubner C, Clark AJ, Rosenfeld RG, Savage MO. Evidence for a continuum of genetic, phenotypic, and biochemical abnormalities in children with growth hormone insensitivity. Endocrine reviews 2011; 32:472-497
  146. Ayling RM, Ross R, Towner P, Von Laue S, Finidori J, Moutoussamy S, Buchanan CR, Clayton PE, Norman MR. A dominant-negative mutation of the growth hormone receptor causes familial short stature. Nature genetics 1997; 16:13-14
  147. Coutant R, Dorr HG, Gleeson H, Argente J. Diagnosis of endocrine disease: limitations of the IGF1 generation test in children with short stature. European journal of endocrinology / European Federation of Endocrine Societies 2012; 166:351-357
  148. Buckway CK, Guevara-Aguirre J, Pratt KL, Burren CP, Rosenfeld RG. The IGF-I generation test revisited: a marker of GH sensitivity. The Journal of clinical endocrinology and metabolism 2001; 86:5176-5183
  149. Blum WF, Cotterill AM, Postel-Vinay MC, Ranke MB, Savage MO, Wilton P. Improvement of diagnostic criteria in growth hormone insensitivity syndrome: solutions and pitfalls. Pharmacia Study Group on Insulin-like Growth Factor I Treatment in Growth Hormone Insensitivity Syndromes. Acta Paediatr Suppl 1994; 399:117-124
  150. Chernausek SD, Backeljauw PF, Frane J, Kuntze J, Underwood LE, Group GHISC. Long-term treatment with recombinant insulin-like growth factor (IGF)-I in children with severe IGF-I deficiency due to growth hormone insensitivity. The Journal of clinical endocrinology and metabolism 2007; 92:902-910
  151. Backeljauw PF, Kuntze J, Frane J, Calikoglu AS, Chernausek SD. Adult and near-adult height in patients with severe insulin-like growth factor-I deficiency after long-term therapy with recombinant human insulin-like growth factor-I. Hormone research in paediatrics 2013; 80:47-56
  152. Tonella P, Fluck CE, Mullis PE. Insulin-like growth factor-I treatment in primary growth hormone insensitivity: effect of recombinant human IGF-I (rhIGF-I) and rhIGF-I/rhIGF-binding protein-3 complex. Hormone research in paediatrics 2010; 73:140-147
  153. Chapgier A, Wynn RF, Jouanguy E, Filipe-Santos O, Zhang S, Feinberg J, Hawkins K, Casanova JL, Arkwright PD. Human complete Stat-1 deficiency is associated with defective type I and II IFN responses in vitro but immunity to some low virulence viruses in vivo. Journal of immunology 2006; 176:5078-5083
  154. Kofoed EM, Hwa V, Little B, Woods KA, Buckway CK, Tsubaki J, Pratt KL, Bezrodnik L, Jasper H, Tepper A, Heinrich JJ, Rosenfeld RG. Growth hormone insensitivity associated with a STAT5b mutation. The New England journal of medicine 2003; 349:1139-1147
  155. Bernasconi A, Marino R, Ribas A, Rossi J, Ciaccio M, Oleastro M, Ornani A, Paz R, Rivarola MA, Zelazko M, Belgorosky A. Characterization of immunodeficiency in a patient with growth hormone insensitivity secondary to a novel STAT5b gene mutation. Pediatrics 2006; 118:e1584-1592
  156. Hwa V, Little B, Adiyaman P, Kofoed EM, Pratt KL, Ocal G, Berberoglu M, Rosenfeld RG. Severe growth hormone insensitivity resulting from total absence of signal transducer and activator of transcription 5b. The Journal of clinical endocrinology and metabolism 2005; 90:4260-4266
  157. Vidarsdottir S, Walenkamp MJ, Pereira AM, Karperien M, van Doorn J, van Duyvenvoorde HA, White S, Breuning MH, Roelfsema F, Kruithof MF, van Dissel J, Janssen R, Wit JM, Romijn JA. Clinical and biochemical characteristics of a male patient with a novel homozygous STAT5b mutation. The Journal of clinical endocrinology and metabolism 2006; 91:3482-3485
  158. Hwa V, Nadeau K, Wit JM, Rosenfeld RG. STAT5b deficiency: lessons from STAT5b gene mutations. Best Pract Res Clin Endocrinol Metab 2011; 25:61-75
  159. Pugliese-Pires PN, Tonelli CA, Dora JM, Silva PC, Czepielewski M, Simoni G, Arnhold IJ, Jorge AA. A novel STAT5B mutation causing GH insensitivity syndrome associated with hyperprolactinemia and immune dysfunction in two male siblings. European journal of endocrinology / European Federation of Endocrine Societies 2010; 163:349-355
  160. Hwa V, Camacho-Hubner C, Little BM, David A, Metherell LA, El-Khatib N, Savage MO, Rosenfeld RG. Growth hormone insensitivity and severe short stature in siblings: a novel mutation at the exon 13-intron 13 junction of the STAT5b gene. Horm Res 2007; 68:218-224
  161. Klammt J, Neumann D, Gevers EF, Andrew SF, Schwartz ID, Rockstroh D, Colombo R, Sanchez MA, Vokurkova D, Kowalczyk J, Metherell LA, Rosenfeld RG, Pfaffle R, Dattani MT, Dauber A, Hwa V. Dominant-negative STAT5B mutations cause growth hormone insensitivity with short stature and mild immune dysregulation. Nat Commun 2018; 9:2105
  162. Suwanichkul A, Boisclair YR, Olney RC, Durham SK, Powell DR. Conservation of a growth hormone-responsive promoter element in the human and mouse acid-labile subunit genes. Endocrinology 2000; 141:833-838
  163. Domene HM, Bengolea SV, Martinez AS, Ropelato MG, Pennisi P, Scaglia P, Heinrich JJ, Jasper HG. Deficiency of the circulating insulin-like growth factor system associated with inactivation of the acid-labile subunit gene. The New England journal of medicine 2004; 350:570-577
  164. Domene HM, Hwa V, Argente J, Wit JM, Camacho-Hubner C, Jasper HG, Pozo J, van Duyvenvoorde HA, Yakar S, Fofanova-Gambetti OV, Rosenfeld RG. Human acid-labile subunit deficiency: clinical, endocrine and metabolic consequences. Horm Res 2009; 72:129-141
  165. Fuqua JS, Derr M, Rosenfeld RG, Hwa V. Identification of a novel heterozygous IGF1 splicing mutation in a large kindred with familial short stature. Hormone research in paediatrics 2012; 78:59-66
  166. Walenkamp MJ, Karperien M, Pereira AM, Hilhorst-Hofstee Y, van Doorn J, Chen JW, Mohan S, Denley A, Forbes B, van Duyvenvoorde HA, van Thiel SW, Sluimers CA, Bax JJ, de Laat JA, Breuning MB, Romijn JA, Wit JM. Homozygous and heterozygous expression of a novel insulin-like growth factor-I mutation. The Journal of clinical endocrinology and metabolism 2005; 90:2855-2864
  167. Bonapace G, Concolino D, Formicola S, Strisciuglio P. A novel mutation in a patient with insulin-like growth factor 1 (IGF1) deficiency. J Med Genet 2003; 40:913-917
  168. Netchine I, Azzi S, Houang M, Seurin D, Perin L, Ricort JM, Daubas C, Legay C, Mester J, Herich R, Godeau F, Le Bouc Y. Partial primary deficiency of insulin-like growth factor (IGF)-I activity associated with IGF1 mutation demonstrates its critical role in growth and brain development. The Journal of clinical endocrinology and metabolism 2009; 94:3913-3921
  169. Klammt J, Kiess W, Pfaffle R. IGF1R mutations as cause of SGA. Best Pract Res Clin Endocrinol Metab 2011; 25:191-206
  170. Abuzzahab MJ, Schneider A, Goddard A, Grigorescu F, Lautier C, Keller E, Kiess W, Klammt J, Kratzsch J, Osgood D, Pfaffle R, Raile K, Seidel B, Smith RJ, Chernausek SD. IGF-I receptor mutations resulting in intrauterine and postnatal growth retardation. The New England journal of medicine 2003; 349:2211-2222
  171. Wallborn T, Wuller S, Klammt J, Kruis T, Kratzsch J, Schmidt G, Schlicke M, Muller E, van de Leur HS, Kiess W, Pfaffle R. A heterozygous mutation of the insulin-like growth factor-I receptor causes retention of the nascent protein in the endoplasmic reticulum and results in intrauterine and postnatal growth retardation. The Journal of clinical endocrinology and metabolism 2010; 95:2316-2324
  172. Kruis T, Klammt J, Galli-Tsinopoulou A, Wallborn T, Schlicke M, Muller E, Kratzsch J, Korner A, Odeh R, Kiess W, Pfaffle R. Heterozygous mutation within a kinase-conserved motif of the insulin-like growth factor I receptor causes intrauterine and postnatal growth retardation. The Journal of clinical endocrinology and metabolism 2010; 95:1137-1142
  173. Choi JH, Kang M, Kim GH, Hong M, Jin HY, Lee BH, Park JY, Lee SM, Seo EJ, Yoo HW. Clinical and functional characteristics of a novel heterozygous mutation of the IGF1R gene and IGF1R haploinsufficiency due to terminal 15q26.2->qter deletion in patients with intrauterine growth retardation and postnatal catch-up growth failure. The Journal of clinical endocrinology and metabolism 2011; 96:E130-134
  174. Fang P, Schwartz ID, Johnson BD, Derr MA, Roberts CT, Jr., Hwa V, Rosenfeld RG. Familial short stature caused by haploinsufficiency of the insulin-like growth factor i receptor due to nonsense-mediated messenger ribonucleic acid decay. The Journal of clinical endocrinology and metabolism 2009; 94:1740-1747
  175. Inagaki K, Tiulpakov A, Rubtsov P, Sverdlova P, Peterkova V, Yakar S, Terekhov S, LeRoith D. A familial insulin-like growth factor-I receptor mutant leads to short stature: clinical and biochemical characterization. The Journal of clinical endocrinology and metabolism 2007; 92:1542-1548
  176. Roback EW, Barakat AJ, Dev VG, Mbikay M, Chretien M, Butler MG. An infant with deletion of the distal long arm of chromosome 15 (q26.1----qter) and loss of insulin-like growth factor 1 receptor gene. American journal of medical genetics 1991; 38:74-79
  177. Kant SG, Kriek M, Walenkamp MJ, Hansson KB, van Rhijn A, Clayton-Smith J, Wit JM, Breuning MH. Tall stature and duplication of the insulin-like growth factor I receptor gene. European journal of medical genetics 2007; 50:1-10
  178. Klaassens M, Galjaard RJ, Scott DA, Bruggenwirth HT, van Opstal D, Fox MV, Higgins RR, Cohen-Overbeek TE, Schoonderwaldt EM, Lee B, Tibboel D, de Klein A. Prenatal detection and outcome of congenital diaphragmatic hernia (CDH) associated with deletion of chromosome 15q26: two patients and review of the literature. Am J Med Genet A 2007; 143A:2204-2212
  179. Ester WA, van Duyvenvoorde HA, de Wit CC, Broekman AJ, Ruivenkamp CA, Govaerts LC, Wit JM, Hokken-Koelega AC, Losekoot M. Two short children born small for gestational age with insulin-like growth factor 1 receptor haploinsufficiency illustrate the heterogeneity of its phenotype. The Journal of clinical endocrinology and metabolism 2009; 94:4717-4727
  180. Dauber A, Munoz-Calvo MT, Barrios V, Domene HM, Kloverpris S, Serra-Juhe C, Desikan V, Pozo J, Muzumdar R, Martos-Moreno GA, Hawkins F, Jasper HG, Conover CA, Frystyk J, Yakar S, Hwa V, Chowen JA, Oxvig C, Rosenfeld RG, Perez-Jurado LA, Argente J. Mutations in pregnancy-associated plasma protein A2 cause short stature due to low IGF-I availability. EMBO molecular medicine 2016; 8:363-374
  181. Teresa Munoz-Calvo M, Barrios V, Pozo J, Chowen JA, Martos-Moreno GA, Hawkins F, Dauber A, Domene HM, Yakar S, Rosenfeld RG, Perez-Jurado LA, Oxvig C, Frystyk J, Argente J. Treatment with recombinant human insulin-like growth factor-I improves growth in patients with PAPP-A2 deficiency. The Journal of clinical endocrinology and metabolism 2016:jc20162751
  182. Cabrera Salcedo CH, V.; Tyzinski, L;,Andrew, M.; Wasserman, H.; Backeljauw, P.;  Dauber, A. 2016 PAPP-A2 Gene Mutation Effects on Glucose Metabolism and Bone Mineral Density and Response to Therapy with Recombinant Human IGF-I. ESPE; 2016; Paris.
  183. Garre ML, Cama A. Craniopharyngioma: modern concepts in pathogenesis and treatment. Current opinion in pediatrics 2007; 19:471-479
  184. Holsken A, Buchfelder M, Fahlbusch R, Blumcke I, Buslei R. Tumour cell migration in adamantinomatous craniopharyngiomas is promoted by activated Wnt-signalling. Acta neuropathologica 2010; 119:631-639
  185. Schroeder JW, Vezina LG. Pediatric sellar and suprasellar lesions. Pediatric radiology 2011; 41:287-298; quiz 404-285
  186. Bunin GR, Surawicz TS, Witman PA, Preston-Martin S, Davis F, Bruner JM. The descriptive epidemiology of craniopharyngioma. Neurosurgical focus 1997; 3:e1
  187. Muller HL. Childhood craniopharyngioma--current concepts in diagnosis, therapy and follow-up. Nature reviews Endocrinology 2010; 6:609-618
  188. Muller HL. Childhood craniopharyngioma. Pituitary 2013; 16:56-67
  189. Muller HL. Consequences of craniopharyngioma surgery in children. The Journal of clinical endocrinology and metabolism 2011; 96:1981-1991
  190. Visser J, Hukin J, Sargent M, Steinbok P, Goddard K, Fryer C. Late mortality in pediatric patients with craniopharyngioma. J Neurooncol 2010; 100:105-111
  191. Steno J, Bizik I, Steno A, Matejcik V. Craniopharyngiomas in children: how radical should the surgeon be? Child's nervous system : ChNS : official journal of the International Society for Pediatric Neurosurgery 2011; 27:41-54
  192. Muller HL, Gebhardt U, Schroder S, Pohl F, Kortmann RD, Faldum A, Zwiener I, Warmuth-Metz M, Pietsch T, Calaminus G, Kolb R, Wiegand C, Sorensen N, study committee of K. Analyses of treatment variables for patients with childhood craniopharyngioma--results of the multicenter prospective trial KRANIOPHARYNGEOM 2000 after three years of follow-up. Hormone research in paediatrics 2010; 73:175-180
  193. Becker G, Kortmann RD, Skalej M, Bamberg M. The role of radiotherapy in the treatment of craniopharyngioma--indications, results, side effects. Frontiers of radiation therapy and oncology 1999; 33:100-113
  194. Price DA, Wilton P, Jonsson P, Albertsson-Wikland K, Chatelain P, Cutfield W, Ranke MB. Efficacy and safety of growth hormone treatment in children with prior craniopharyngioma: An analysis of the Pharmacia and Upjohn International Growth Database (KIGS) from 1988 to 1996. Hormone Research 1998; 49:91-97
  195. Olsson DS, Buchfelder M, Wiendieck K, Kremenevskaja N, Bengtsson BA, Jakobsson KE, Jarfelt M, Johannsson G, Nilsson AG. Tumour recurrence and enlargement in patients with craniopharyngioma with and without GH replacement therapy during more than 10 years of follow-up. European journal of endocrinology / European Federation of Endocrine Societies 2012; 166:1061-1068
  196. Taguchi T, Takao T, Iwasaki Y, Pooh K, Okazaki M, Hashimoto K, Terada Y. Rapid recurrence of craniopharyngioma following recombinant human growth hormone replacement. J Neurooncol 2010; 100:321-322
  197. Lafferty AR, Chrousos GP. Pituitary tumors in children and adolescents. The Journal of clinical endocrinology and metabolism 1999; 84:4317-4323
  198. Steele CA, MacFarlane IA, Blair J, Cuthbertson DJ, Didi M, Mallucci C, Javadpour M, Daousi C. Pituitary adenomas in childhood, adolescence and young adulthood: presentation, management, endocrine and metabolic outcomes. European journal of endocrinology / European Federation of Endocrine Societies 2010; 163:515-522
  199. Chandrasekharappa SC, Guru SC, Manickam P, Olufemi SE, Collins FS, EmmertBuck MR, Debelenko LV, Zhuang ZP, Lubensky IA, Liotta LA, Crabtree JS, Wang YP, Roe BA, Weisemann J, Boguski MS, Agarwal SK, Kester MB, Kim YS, Heppner C, Dong QH, Spiegel AM, Burns AL, Marx SJ. Positional cloning of the gene for multiple endocrine neoplasia-type 1. Science 1997; 276:404-407
  200. Vierimaa O, Georgitsi M, Lehtonen R, Vahteristo P, Kokko A, Raitila A, Tuppurainen K, Ebeling TM, Salmela PI, Paschke R, Gundogdu S, De Menis E, Makinen MJ, Launonen V, Karhu A, Aaltonen LA. Pituitary adenoma predisposition caused by germline mutations in the AIP gene. Science 2006; 312:1228-1230
  201. Cnossen MH, Stam EN, Cooiman LC, Simonsz HJ, Stroink H, Oranje AP, Halley DJ, de Goede-Bolder A, Niermeijer MF, de Muinck Keizer-Schrama SM. Endocrinologic disorders and optic pathway gliomas in children with neurofibromatosis type 1. Pediatrics 1997; 100:667-670
  202. Collet-Solberg PF, Sernyak H, Satin-Smith M, Katz LL, Sutton L, Molloy P, Moshang T, Jr. Endocrine outcome in long-term survivors of low-grade hypothalamic/chiasmatic glioma. Clinical endocrinology 1997; 47:79-85
  203. Brauner R, Malandry F, Rappaport R, Zucker JM, Kalifa C, Pierre-Kahn A, Bataini P, Dufier JL. Growth and endocrine disorders in optic glioma. European journal of pediatrics 1990; 149:825-828
  204. Kim RJ, Janss A, Shanis D, Homan S, Moshang T, Jr. Adult heights attained by children with hypothalamic/chiasmatic glioma treated with growth hormone. The Journal of clinical endocrinology and metabolism 2004; 89:4999-5002
  205. Minkov M. Multisystem Langerhans cell histiocytosis in children: current treatment and future directions. Paediatric drugs 2011; 13:75-86
  206. Clayton PE, Shalet SM. Dose dependency of time of onset of radiation-induced growth hormone deficiency. The Journal of pediatrics 1991; 118:226-228
  207. Kirk JA, Raghupathy P, Stevens MM, Cowell CT, Menser MA, Bergin M, Tink A, Vines RH, Silink M. Growth failure and growth-hormone deficiency after treatment for acute lymphoblastic leukaemia. Lancet 1987; 1:190-193
  208. Ogilvy-Stuart AL, Clark DJ, Wallace WH, Gibson BE, Stevens RF, Shalet SM, Donaldson MD. Endocrine deficit after fractionated total body irradiation. Archives of disease in childhood 1992; 67:1107-1110
  209. Littley MD, Shalet SM, Beardwell CG, Ahmed SR, Applegate G, Sutton ML. Hypopituitarism following external radiotherapy for pituitary tumours in adults. The Quarterly journal of medicine 1989; 70:145-160
  210. Jadresic A, Jimenez LE, Joplin GF. Long-term effect of 90Y pituitary implantation in acromegaly. Acta endocrinologica 1987; 115:301-306
  211. Darzy KH, Shalet SM. Circadian and stimulated thyrotropin secretion in cranially irradiated adult cancer survivors. J Clin Endocr Metab 2005; 90:6490-6497
  212. Achermann JC, Brook CG, Hindmarsh PC. The GH response to low-dose bolus growth hormone-releasing hormone (GHRH(1-29)NH2) is attenuated in patients with longstanding post-irradiation GH insufficiency. European journal of endocrinology / European Federation of Endocrine Societies 2000; 142:359-364
  213. Robinson IC, Fairhall KM, Hendry JH, Shalet SM. Differential radiosensitivity of hypothalamo-pituitary function in the young adult rat. The Journal of endocrinology 2001; 169:519-526
  214. Hochberg Z, Kuten A, Hertz P, Tatcher M, Kedar A, Benderly A. The effect of single-dose radiation on cell survival and growth hormone secretion by rat anterior pituitary cells. Radiation research 1983; 94:508-512
  215. Duffner PK, Cohen ME, Voorhess ML, MacGillivray MH, Brecher ML, Panahon A, Gilani BB. Long-term effects of cranial irradiation on endocrine function in children with brain tumors. A prospective study. Cancer 1985; 56:2189-2193
  216. Samaan NA, Vieto R, Schultz PN, Maor M, Meoz RT, Sampiere VA, Cangir A, Ried HL, Jesse RH, Jr. Hypothalamic, pituitary and thyroid dysfunction after radiotherapy to the head and neck. International journal of radiation oncology, biology, physics 1982; 8:1857-1867
  217. Chen MS, Lin FJ, Huang MJ, Wang PW, Tang S, Leung WM, Leung W. Prospective hormone study of hypothalamic-pituitary function in patients with nasopharyngeal carcinoma after high dose irradiation. Japanese journal of clinical oncology 1989; 19:265-270
  218. Spoudeas HA, Hindmarsh PC, Matthews DR, Brook CG. Evolution of growth hormone neurosecretory disturbance after cranial irradiation for childhood brain tumours: a prospective study. The Journal of endocrinology 1996; 150:329-342
  219. Chrousos GP, Poplack D, Brown T, O'Neill D, Schwade J, Bercu BB. Effects of cranial radiation on hypothalamic-adenohypophyseal function: abnormal growth hormone secretory dynamics. The Journal of clinical endocrinology and metabolism 1982; 54:1135-1139
  220. Blatt J, Bercu BB, Gillin JC, Mendelson WB, Poplack DG. Reduced pulsatile growth hormone secretion in children after therapy for acute lymphoblastic leukemia. The Journal of pediatrics 1984; 104:182-186
  221. Brauner R, Rappaport R, Prevot C, Czernichow P, Zucker JM, Bataini P, Lemerle J, Sarrazin D, Guyda HJ. A prospective study of the development of growth hormone deficiency in children given cranial irradiation, and its relation to statural growth. The Journal of clinical endocrinology and metabolism 1989; 68:346-351
  222. Tillmann V, Buckler JM, Kibirige MS, Price DA, Shalet SM, Wales JK, Addison MG, Gill MS, Whatmore AJ, Clayton PE. Biochemical tests in the diagnosis of childhood growth hormone deficiency. The Journal of clinical endocrinology and metabolism 1997; 82:531-535
  223. Sklar C, Sarafoglou K, Whittam E. Efficacy of insulin-like growth factor binding protein 3 in predicting the growth hormone response to provocative testing in children treated with cranial irradiation. Acta endocrinologica 1993; 129:511-515
  224. Tillmann V, Shalet SM, Price DA, Wales JK, Pennells L, Soden J, Gill MS, Whatmore AJ, Clayton PE. Serum insulin-like growth factor-I, IGF binding protein-3 and IGFBP-3 protease activity after cranial irradiation. Horm Res 1998; 50:71-77
  225. Achermann JC, Hindmarsh PC, Brook CG. The relationship between the growth hormone and insulin-like growth factor axis in long-term survivors of childhood brain tumours. Clinical endocrinology 1998; 49:639-645
  226. Oberfield SE, Allen JC, Pollack J, New MI, Levine LS. Long-term endocrine sequelae after treatment of medulloblastoma: prospective study of growth and thyroid function. The Journal of pediatrics 1986; 108:219-223
  227. Shalet SM, Gibson B, Swindell R, Pearson D. Effect of spinal irradiation on growth. Archives of disease in childhood 1987; 62:461-464
  228. Clayton PE, Shalet SM, Price DA. Growth response to growth hormone therapy following craniospinal irradiation. European journal of pediatrics 1988; 147:597-601
  229. Clayton PE, Shalet SM, Price DA. Growth response to growth hormone therapy following cranial irradiation. European journal of pediatrics 1988; 147:593-596
  230. Sulmont V, Brauner R, Fontoura M, Rappaport R. Response to growth hormone treatment and final height after cranial or craniospinal irradiation. Acta Paediatr Scand 1990; 79:542-549
  231. Yakar S, Kim H, Zhao H, Toyoshima Y, Pennisi P, Gavrilova O, Leroith D. The growth hormone-insulin like growth factor axis revisited: lessons from IGF-1 and IGF-1 receptor gene targeting. Pediatric nephrology 2005; 20:251-254
  232. Clayton PE, Banerjee I, Murray PG, Renehan AG. Growth hormone, the insulin-like growth factor axis, insulin and cancer risk. Nature reviews Endocrinology 2011; 7:11-24
  233. Chen B, Liu S, Xu W, Wang X, Zhao W, Wu J. IGF-I and IGFBP-3 and the risk of lung cancer: a meta-analysis based on nested case-control studies. Journal of experimental & clinical cancer research : CR 2009; 28:89
  234. Rinaldi S, Cleveland R, Norat T, Biessy C, Rohrmann S, Linseisen J, Boeing H, Pischon T, Panico S, Agnoli C, Palli D, Tumino R, Vineis P, Peeters PH, van Gils CH, Bueno-de-Mesquita BH, Vrieling A, Allen NE, Roddam A, Bingham S, Khaw KT, Manjer J, Borgquist S, Dumeaux V, Torhild Gram I, Lund E, Trichopoulou A, Makrygiannis G, Benetou V, Molina E, Donate Suarez I, Barricarte Gurrea A, Gonzalez CA, Tormo MJ, Altzibar JM, Olsen A, Tjonneland A, Gronbaek H, Overvad K, Clavel-Chapelon F, Boutron-Ruault MC, Morois S, Slimani N, Boffetta P, Jenab M, Riboli E, Kaaks R. Serum levels of IGF-I, IGFBP-3 and colorectal cancer risk: results from the EPIC cohort, plus a meta-analysis of prospective studies. Int J Cancer 2010; 126:1702-1715
  235. Roddam AW, Allen NE, Appleby P, Key TJ, Ferrucci L, Carter HB, Metter EJ, Chen C, Weiss NS, Fitzpatrick A, Hsing AW, Lacey JV, Jr., Helzlsouer K, Rinaldi S, Riboli E, Kaaks R, Janssen JA, Wildhagen MF, Schroder FH, Platz EA, Pollak M, Giovannucci E, Schaefer C, Quesenberry CP, Jr., Vogelman JH, Severi G, English DR, Giles GG, Stattin P, Hallmans G, Johansson M, Chan JM, Gann P, Oliver SE, Holly JM, Donovan J, Meyer F, Bairati I, Galan P. Insulin-like growth factors, their binding proteins, and prostate cancer risk: analysis of individual patient data from 12 prospective studies. Annals of internal medicine 2008; 149:461-471, W483-468
  236. Endogenous H, Breast Cancer Collaborative G, Key TJ, Appleby PN, Reeves GK, Roddam AW. Insulin-like growth factor 1 (IGF1), IGF binding protein 3 (IGFBP3), and breast cancer risk: pooled individual data analysis of 17 prospective studies. The lancet oncology 2010; 11:530-542
  237. Kauppinen-Makelin R, Sane T, Valimaki MJ, Markkanen H, Niskanen L, Ebeling T, Jaatinen P, Juonala M, Finnish Acromegaly Study G, Pukkala E. Increased cancer incidence in acromegaly--a nationwide survey. Clinical endocrinology 2010; 72:278-279
  238. Ron E, Gridley G, Hrubec Z, Page W, Arora S, Fraumeni JF, Jr. Acromegaly and gastrointestinal cancer. Cancer 1991; 68:1673-1677
  239. Orme SM, McNally RJ, Cartwright RA, Belchetz PE. Mortality and cancer incidence in acromegaly: a retrospective cohort study. United Kingdom Acromegaly Study Group. The Journal of clinical endocrinology and metabolism 1998; 83:2730-2734
  240. Sklar CA, Mertens AC, Mitby P, Occhiogrosso G, Qin J, Heller G, Yasui Y, Robison LL. Risk of disease recurrence and second neoplasms in survivors of childhood cancer treated with growth hormone: a report from the Childhood Cancer Survivor Study. The Journal of clinical endocrinology and metabolism 2002; 87:3136-3141
  241. Swerdlow AJ, Reddingius RE, Higgins CD, Spoudeas HA, Phipps K, Qiao Z, Ryder WD, Brada M, Hayward RD, Brook CG, Hindmarsh PC, Shalet SM. Growth hormone treatment of children with brain tumors and risk of tumor recurrence. The Journal of clinical endocrinology and metabolism 2000; 85:4444-4449
  242. Blethen SL, Allen DB, Graves D, August G, Moshang T, Rosenfeld R. Safety of recombinant deoxyribonucleic acid-derived growth hormone: The National Cooperative Growth Study experience. The Journal of clinical endocrinology and metabolism 1996; 81:1704-1710
  243. Maneatis T, Baptista J, Connelly K, Blethen S. Growth hormone safety update from the National Cooperative Growth Study. Journal of pediatric endocrinology & metabolism : JPEM 2000; 13 Suppl 2:1035-1044
  244. Wyatt D. Lessons from the national cooperative growth study. European journal of endocrinology / European Federation of Endocrine Societies 2004; 151 Suppl 1:S55-59
  245. Ergun-Longmire B, Mertens AC, Mitby P, Qin J, Heller G, Shi W, Yasui Y, Robison LL, Sklar CA. Growth hormone treatment and risk of second neoplasms in the childhood cancer survivor. The Journal of clinical endocrinology and metabolism 2006; 91:3494-3498
  246. Crompton MR. Hypothalamic lesions following closed head injury. Brain : a journal of neurology 1971; 94:165-172
  247. Benvenga S, Campenni A, Ruggeri RM, Trimarchi F. Clinical review 113: Hypopituitarism secondary to head trauma. The Journal of clinical endocrinology and metabolism 2000; 85:1353-1361
  248. Kelly DF, Gonzalo IT, Cohan P, Berman N, Swerdloff R, Wang C. Hypopituitarism following traumatic brain injury and aneurysmal subarachnoid hemorrhage: a preliminary report. Journal of neurosurgery 2000; 93:743-752
  249. Lieberman SA, Oberoi AL, Gilkison CR, Masel BE, Urban RJ. Prevalence of neuroendocrine dysfunction in patients recovering from traumatic brain injury. The Journal of clinical endocrinology and metabolism 2001; 86:2752-2756
  250. Bondanelli M, De Marinis L, Ambrosio MR, Monesi M, Valle D, Zatelli MC, Fusco A, Bianchi A, Farneti M, degli Uberti EC. Occurrence of pituitary dysfunction following traumatic brain injury. Journal of neurotrauma 2004; 21:685-696
  251. Leal-Cerro A, Flores JM, Rincon M, Murillo F, Pujol M, Garcia-Pesquera F, Dieguez C, Casanueva FF. Prevalence of hypopituitarism and growth hormone deficiency in adults long-term after severe traumatic brain injury. Clinical endocrinology 2005; 62:525-532
  252. Agha A, Rogers B, Sherlock M, O'Kelly P, Tormey W, Phillips J, Thompson CJ. Anterior pituitary dysfunction in survivors of traumatic brain injury. The Journal of clinical endocrinology and metabolism 2004; 89:4929-4936
  253. Tanriverdi F, Senyurek H, Unluhizarci K, Selcuklu A, Casanueva FF, Kelestimur F. High risk of hypopituitarism after traumatic brain injury: a prospective investigation of anterior pituitary function in the acute phase and 12 months after trauma. The Journal of clinical endocrinology and metabolism 2006; 91:2105-2111
  254. Acerini CL, Tasker RC, Bellone S, Bona G, Thompson CJ, Savage MO. Hypopituitarism in childhood and adolescence following traumatic brain injury: the case for prospective endocrine investigation. European journal of endocrinology / European Federation of Endocrine Societies 2006; 155:663-669
  255. Einaudi S, Matarazzo P, Peretta P, Grossetti R, Giordano F, Altare F, Bondone C, Andreo M, Ivani G, Genitori L, de Sanctis C. Hypothalamo-hypophysial dysfunction after traumatic brain injury in children and adolescents: a preliminary retrospective and prospective study. Journal of pediatric endocrinology & metabolism : JPEM 2006; 19:691-703
  256. Khadr SN, Crofton PM, Jones PA, Wardhaugh B, Roach J, Drake AJ, Minns RA, Kelnar CJ. Evaluation of pituitary function after traumatic brain injury in childhood. Clinical endocrinology 2010; 73:637-643
  257. Poomthavorn P, Maixner W, Zacharin M. Pituitary function in paediatric survivors of severe traumatic brain injury. Archives of disease in childhood 2008; 93:133-137
  258. Heather NL, Jefferies C, Hofman PL, Derraik JG, Brennan C, Kelly P, Hamill JK, Jones RG, Rowe DL, Cutfield WS. Permanent hypopituitarism is rare after structural traumatic brain injury in early childhood. The Journal of clinical endocrinology and metabolism 2012; 97:599-604
  259. Buxton N, Robertson I. Lymphocytic and granulocytic hypophysitis: a single centre experience. British journal of neurosurgery 2001; 15:242-245, discussion 245-246
  260. Carmichael JD. Update on the diagnosis and management of hypophysitis. Current opinion in endocrinology, diabetes, and obesity 2012; 19:314-321
  261. Gellner V, Kurschel S, Scarpatetti M, Mokry M. Lymphocytic hypophysitis in the pediatric population. Child's nervous system : ChNS : official journal of the International Society for Pediatric Neurosurgery 2008; 24:785-792
  262. Cemeroglu AP, Blaivas M, Muraszko KM, Robertson PL, Vazquez DM. Lymphocytic hypophysitis presenting with diabetes insipidus in a 14-year-old girl: case report and review of the literature. European journal of pediatrics 1997; 156:684-688
  263. Papanastasiou L, Pappa T, Tsiavos V, Tseniklidi E, Androulakis I, Kontogeorgos G, Piaditis G. Azathioprine as an alternative treatment in primary hypophysitis. Pituitary 2011; 14:16-22
  264. Tubridy N, Saunders D, Thom M, Asa SL, Powell M, Plant GT, Howard R. Infundibulohypophysitis in a man presenting with diabetes insipidus and cavernous sinus involvement. Journal of neurology, neurosurgery, and psychiatry 2001; 71:798-801
  265. Ward L, Paquette J, Seidman E, Huot C, Alvarez F, Crock P, Delvin E, Kampe O, Deal C. Severe autoimmune polyendocrinopathy-candidiasis-ectodermal dystrophy in an adolescent girl with a novel AIRE mutation: response to immunosuppressive therapy. The Journal of clinical endocrinology and metabolism 1999; 84:844-852
  266. Selch MT, DeSalles AA, Kelly DF, Frighetto L, Vinters HV, Cabatan-Awang C, Wallace RE, Solberg TD. Stereotactic radiotherapy for the treatment of lymphocytic hypophysitis. Report of two cases. Journal of neurosurgery 2003; 99:591-596
  267. Abe T, Tara LA, Ludecke DK. Growth hormone-secreting pituitary adenomas in childhood and adolescence: features and results of transnasal surgery. Neurosurgery 1999; 45:1-10
  268. Bhansali A, Upreti V, Dutta P, Mukherjee KK, Nahar U, Santosh R, Das S, Walia R, Pathak A. Adolescent acromegaly: clinical parameters and treatment outcome. Journal of pediatric endocrinology & metabolism : JPEM 2010; 23:1047-1054
  269. Katznelson L, Atkinson JL, Cook DM, Ezzat SZ, Hamrahian AH, Miller KK, American Association of Clinical E. American Association of Clinical Endocrinologists medical guidelines for clinical practice for the diagnosis and treatment of acromegaly--2011 update. Endocrine practice : official journal of the American College of Endocrinology and the American Association of Clinical Endocrinologists 2011; 17 Suppl 4:1-44
  270. Chandrasekharappa SC, Guru SC, Manickam P, Olufemi SE, Collins FS, Emmert-Buck MR, Debelenko LV, Zhuang Z, Lubensky IA, Liotta LA, Crabtree JS, Wang Y, Roe BA, Weisemann J, Boguski MS, Agarwal SK, Kester MB, Kim YS, Heppner C, Dong Q, Spiegel AM, Burns AL, Marx SJ. Positional cloning of the gene for multiple endocrine neoplasia-type 1. Science 1997; 276:404-407
  271. Pellegata NS, Quintanilla-Martinez L, Siggelkow H, Samson E, Bink K, Hofler H, Fend F, Graw J, Atkinson MJ. Germ-line mutations in p27Kip1 cause a multiple endocrine neoplasia syndrome in rats and humans. Proceedings of the National Academy of Sciences of the United States of America 2006; 103:15558-15563
  272. Melmed S, Colao A, Barkan A, Molitch M, Grossman AB, Kleinberg D, Clemmons D, Chanson P, Laws E, Schlechte J, Vance ML, Ho K, Giustina A, Acromegaly Consensus G. Guidelines for acromegaly management: an update. The Journal of clinical endocrinology and metabolism 2009; 94:1509-1517
  273. Colao A, Ferone D, Marzullo P, Di Sarno A, Cerbone G, Sarnacchiaro F, Cirillo S, Merola B, Lombardi G. Effect of different dopaminergic agents in the treatment of acromegaly. The Journal of clinical endocrinology and metabolism 1997; 82:518-523
  274. Abs R, Verhelst J, Maiter D, Van Acker K, Nobels F, Coolens JL, Mahler C, Beckers A. Cabergoline in the treatment of acromegaly: a study in 64 patients. The Journal of clinical endocrinology and metabolism 1998; 83:374-378
  275. Maiza JC, Vezzosi D, Matta M, Donadille F, Loubes-Lacroix F, Cournot M, Bennet A, Caron P. Long-term (up to 18 years) effects on GH/IGF-1 hypersecretion and tumour size of primary somatostatin analogue (SSTa) therapy in patients with GH-secreting pituitary adenoma responsive to SSTa. Clinical endocrinology 2007; 67:282-289
  276. Bevan JS. Clinical review: The antitumoral effects of somatostatin analog therapy in acromegaly. The Journal of clinical endocrinology and metabolism 2005; 90:1856-1863
  277. Minniti G, Jaffrain-Rea ML, Osti M, Esposito V, Santoro A, Solda F, Gargiulo P, Tamburrano G, Enrici RM. The long-term efficacy of conventional radiotherapy in patients with GH-secreting pituitary adenomas. Clinical endocrinology 2005; 62:210-216
  278. Weinstein LS, Shenker A, Gejman PV, Merino MJ, Friedman E, Spiegel AM. Activating mutations of the stimulatory G protein in the McCune-Albright syndrome. The New England journal of medicine 1991; 325:1688-1695
  279. Akintoye SO, Chebli C, Booher S, Feuillan P, Kushner H, Leroith D, Cherman N, Bianco P, Wientroub S, Robey PG, Collins MT. Characterization of gsp-mediated growth hormone excess in the context of McCune-Albright syndrome. The Journal of clinical endocrinology and metabolism 2002; 87:5104-5112
  280. Akintoye SO, Kelly MH, Brillante B, Cherman N, Turner S, Butman JA, Robey PG, Collins MT. Pegvisomant for the treatment of gsp-mediated growth hormone excess in patients with McCune-Albright syndrome. The Journal of clinical endocrinology and metabolism 2006; 91:2960-2966
  281. Kirschner LS, Carney JA, Pack SD, Taymans SE, Giatzakis C, Cho YS, Cho-Chung YS, Stratakis CA. Mutations of the gene encoding the protein kinase A type I-alpha regulatory subunit in patients with the Carney complex. Nature genetics 2000; 26:89-92
  282. Stratakis CA, Kirschner LS, Carney JA. Clinical and molecular features of the Carney complex: diagnostic criteria and recommendations for patient evaluation. The Journal of clinical endocrinology and metabolism 2001; 86:4041-4046
  283. Horvath A, Stratakis CA. Clinical and molecular genetics of acromegaly: MEN1, Carney complex, McCune-Albright syndrome, familial acromegaly and genetic defects in sporadic tumors. Reviews in endocrine & metabolic disorders 2008; 9:1-11
  284. Pack SD, Kirschner LS, Pak E, Zhuang Z, Carney JA, Stratakis CA. Genetic and histologic studies of somatomammotropic pituitary tumors in patients with the "complex of spotty skin pigmentation, myxomas, endocrine overactivity and schwannomas" (Carney complex). The Journal of clinical endocrinology and metabolism 2000; 85:3860-3865


Surgical Treatment of Pituitary Adenomas

ABSTRACT

The overwhelming majority of pituitary adenomas are benign and present either with characteristic syndromes of excess hormone secretion or secondary to mass effect by the growing tumor. The common hypersecretory syndromes include Cushing’s disease, acromegaly/gigantism, and hyperprolactinemia. Local mass effects on the pituitary can cause varying degrees of hypopituitarism. As the tumor grows beyond the confines of the sella turcica, the visual pathways are commonly affected and visual field deficits are present. Effective medical therapy is available for prolactin secreting adenomas. With the exception of these tumors, transsphenoidal surgery remains the first-line treatment for most other pituitary adenomas. Medical therapy for growth hormone secreting adenomas and for Cushing’s disease continues to evolve.

CLASSIFICATION

Pituitary adenomas may be classified according to their clinical/radiographic characteristics (Table 1) and, more recently, their cell lineage (Table 2). Those tumors that measure less than 10 mm in diameter are considered microadenomas; macroadenomas are those 10 mm or larger (Fig. 1A, B, C, and D). Macroadenomas may also be sub-categorized as "giant" if their extent reaches far beyond the normal confines of the pituitary region or their greatest diameter exceeds 4cm (Fig 1E, F, and G). Pituitary adenomas may also be categorized based on their functional/secretory status. The hypersecretory adenomas cause distinctive clinical syndromes that include acromegaly/gigantism caused by growth hormone (GH) secreting adenomas, the classic Forbes-Albright syndrome (amenorrhea-galactorrhea) caused by prolactin (PRL) secreting adenomas, TSH-secreting adenomas, the occasional hypersecreting FSH/LH adenoma, and Cushing's disease/Nelson’s syndrome caused by corticotropin (ACTH) secreting adenomas. The non-functioning adenomas (NFAs) are “silent” and only perturb the endocrine system due to mass effects on the normal gland causing hypopituitarism (decreased pituitary hormone production) and generally present either incidentally, because of visual loss, or with secondary subtle hormonal abnormalities. The new histopathological classification considers the majority of tumors to be clinically silent gonadotropin tumors staining for SF-1. The next category is the true null cell adenoma which stains for no pituitary hormones with none of the other transcription factors or hormones being detected.

Table 1. Clinical/Radiographic Classification Schemes of Pituitary Adenomas

 Scheme

 Features

Microadenoma/ Macroadenoma

 £ 10 mmm/ > 10 mm

Non-Functioning adenoma


Functioning adenoma


 Endocrinologically inactive, patient may present with pituitary deficiency or cranial nerve deficits (CN 2 most commonly)


Excess of pituitary hormone secretion:  GH adenoma; PRL adenoma; ACTH adenoma; TSH adenoma; GH -PRL adenoma; FSH/LH adenoma (rare, most are non-functioning)


Other plurihormonal hypersecretory adenomas

Abbreviations: CN = cranial nerve, GH = growth hormone, PRL = prolactin, ACTH = adrenocorticotropic hormone, TSH = thyroid stimulating hormone, FSH = follicle stimulating hormone, LH = luteinizing hormone

Figure 1. Tumor Classification based on size.  Microadenoma: Coronal and sagittal T1 weighted MRIs with contrast with arrow indicating the location of the tumor (A and B).  Macroadenoma: Coronal and sagittal T1 weighted MRIs of a typical macroadenoma (C and D).  Giant invasive macroadenoma: Coronal and sagittal T1 MRIs with contrast in a patient in whom the tumor compresses the right temporal lobe and invades the sphenoid sinus (E and F).  In another patient, the sagittal MRI reveals a tumor that has not only invaded the sphenoid sinus but compresses the brainstem; the tumor is highlighted (G and H).

The new cell lineage classification system of pituitary adenomas is a result of recent studies which have uncovered the shared transcription factor profiles present in adenoma cell lines (1). For detailed information on the pathology and pathogenesis of pituitary adenomas, see the corresponding Endotext chapter. The most common transcription factor profile is PIT1, which is shared by somatotroph, lactotroph, and thyrotroph adenomas.  PIT1 mediates differentiation, expansion, and survival of these three cell types (Table 2). In adenomas, evidence supports an HMGA mediated upregulation of PIT1 (2). HMGA genes are usually active during embryogenesis but not in normal adulthood (3). A new paradigm has evolved, which generally begins with transcription factor mediated monoclonal expansion of a single cell line followed by variable differentiation and retention of secretory capability. Patients harboring multiple pituitary adenomas present a unique scenario in which the true pathogenesis and pathogenetic process underlying neoplastic growth could involve distinct multicentric monoclonal expansion (“Multiple-Hit Theory”) or adenoma transdifferentiation across cell lines (“Transdifferentiation Theory”) (4).

Table 2. Cell Lineage Classification of Pituitary Adenomas (1)

Lineage

 Cell type


 Immunophenotype

Transcription factor profile

Acidophil

Somatotroph  

GH ± PRL ± a-subunit

PIT1

Lactotroph

PRL

PIT1, ER-a

Thyrotroph

TSH-b, a-subunit

PIT1, GATA2

Corticotroph

Corticotroph

ACTH, LMWCK

TPIT

Gonadotroph

Gonadotroph

FSH-b or LH-b or a-subunit

SF1, GATA2

Unknown

Null cell

None

None

Abbreviations: GH= growth hormone, PRL= prolactin, TSH = thyroid stimulating hormone, ACTH = adrenocorticotropic hormone, LMWCK = low molecular weight cytokeratin

EPIDEMIOLOGY

Pituitary adenomas account for approximately 10 to 15% of surgically-treated primary tumors of the central nervous system (CNS) (5-9). The incidence appears higher in African Americans in whom pituitary adenomas account for over 20% of non-metastatic CNS tumors (10, 11). The incidence rate of pituitary tumors has increased from 2.5 to 3.1 per 100,000 per year (annual percentage change of 4.25%). Although the incidence varies according to age, sex, and ethnic group, between approximately 0.5 and 8.5 per 100,000 in the population are diagnosed annually with a pituitary adenoma (5, 12-14). In a large cohort study between 2004 and 2009, the largest incidence peak was 8.5 for males 75-79 years old (14). Autopsy series indicate that pituitary tumors are quite common, and that nearly 25% of the population may harbor undiagnosed adenomas (15, 16). The majority of these tumors are less than 3-5 mm in diameter and would not require medical or surgical intervention. More recent series using magnetic resonance imaging (MRI) of healthy subjects indicate that approximately 10% of the population harbors pituitary lesions. Some series report a higher rate of diagnosis among women of childbearing age, despite a similar incidence in women and men  (5, 13). Because disruption of the hypothalamo-pituitary-gonadal axis in women is more evident than in men, women with pituitary adenomas may present to clinical attention at a higher rate, and earlier, than men.


Among the varying classes of adenomas, prolactinomas and non-functioning adenomas have the highest incidence, and account for nearly two-thirds of all pituitary tumors. Prolactin-secreting adenomas comprise 40 to 60% of functioning adenomas and are the most common subtype of pituitary tumor diagnosed in adolescents (6). The majority of microadenomas occur in women in their second and third decades. Men generally present later, in their fourth and fifth decades, almost always with macroadenomas.


GH secreting adenomas represent approximately 20-30% of all functioning tumors. Nearly three quarters of GH secreting adenomas are macroadenomas. Approximately 40 to 60 individuals per million have acromegaly (17-19). Between 3 and 4 new cases per million are diagnosed annually (17-20). Most present in their 3rd to 5th decades after they have been developing symptoms and signs for many years  (18). Acromegaly has been associated with an increased incidence of cardiovascular, respiratory, and cerebrovascular disease, as well as an increased risk of colon cancer. Studies have reported an increased risk of mortality compared to the unaffected population (17, 20). Although some studies report a higher incidence of several cancers, others have only confirmed an increased risk of colon cancer  (21, 22). There is some evidence that mortality risk may be different between the sexes. Etxabe et al. found a higher mortality rate in men than in women  (18). Other reports found similarly increased mortality in both sexes  (23). Still others report increased risks of death in men from cardiovascular, respiratory, cerebrovascular, and malignant disease, but only from cerebrovascular disease in women  (17).


ACTH adenomas account for 15 to 25% of all functioning adenomas and are the most common pituitary tumors diagnosed in pre-pubertal children (6). The majority of ACTH adenomas, regardless of age, are microadenomas. Approximately 39 individuals per million have Cushing's disease from an ACTH-secreting adenoma and the annual incidence is estimated at 2.4 per million (24). Cushing's disease is more common in women, most of whom present in their third and fourth decades (24, 25). There is a high incidence of hypertension and diabetes mellitus as well as higher vascular disease-related mortality (24, 26). Nelson’s syndrome can develop after adrenalectomy in patients with Cushing’s disease, as negative feedback is then lost to a previously unrecognized intrasellar ACTH adenoma. These patients may develop hyperpigmentation, and the ACTH-secreting pituitary tumors often become aggressive over time. 

CLINICAL PRESENTATION

Advances in neuroimaging, namely CT, CT angiography and particularly magnetic resonance imaging (MRI) have improved the visualization of the pituitary region. Increasing numbers of adenomas are diagnosed incidentally during the evaluation of sinus disorders (15%), trauma (19%), and stroke (15%), among others. These "incidentalomas" are not necessarily asymptomatic. Visual deficits are present in 5-15% of cases and up to 50% when formal testing is employed (27). Some degree of pituitary dysfunction is found in up to 15-30% (27, 28). More than one third are macroadenomas and, of these, approximately 30% will show significant enlargement over time (28-31). Small asymptomatic incidental microadenomas are less likely to have clinically significant growth and often can be followed over time with repeated MRIs.

Although increasing numbers of tumors are diagnosed incidentally, pituitary adenomas more often present secondary to hypersecretion, hypopituitarism, or mass effect (Table 3).

Table 3. Presenting Features of Pituitary Adenomas

Hypersecretion

GH-secreting adenoma: Acromegaly

ACTH-secreting adenoma: Cushing's disease/Nelson’s syndrome

Prolactin-secreting adenoma: Amenorrhea-galactorrhea

TSH-secreting adenoma: Secondary hyperthyroidism

Pituitary insufficiency

Symptoms: diminished libido, infertility, fatigue, weakness

Gonadal dysfunction, Hypothyroidism, Adrenal Insufficiency, Somatotroph Insufficiency

Mass Effect (symptoms related to compressed adjacent structures)

Optic chiasm: bitemporal visual field deficit and diminished visual acuity

Cavernous sinus: trigeminal nerve, facial pain; cranial nerves III, IV, VI, diplopia, ptosis, mydriasis, anisocoria

Pressure on dura or diaphragma sellae: headache

Hypothalamus: behavior, eating, and vigilance disturbances (somnolence)

Temporal lobe: complex partial seizures, memory and cognitive disturbances

Incidental

Discovered during the evaluation for headaches, trauma, nasal sinus disorders, dizziness

Hypersecretory Syndromes

(For detailed descriptions see corresponding chapters in Endotext)

Acromegaly induces characteristic growth hormone-induced structural changes in physiognomy. There is an insidious coarsening of facial features with an enlarged forehead, enlarged tongue, malocclusion of the teeth, and prognathism (Fig 2). Patients' hands and feet also enlarge. Many patients may develop excessive sweating (hyperhidrosis). The external hypertrophy of tissue is paralleled throughout the body. Enlargement of the tongue and hands is common. Patients may suffer from enlarged organs (visceromegaly) and overgrowth of joints and cartilage, along with high blood pressure, cardiomyopathy, congestive heart failure, sleep apnea, spinal canal narrowing (facet hypertrophy), and carpal tunnel syndrome. Significant numbers of patients with acromegaly also have impaired glucose metabolism and diabetes mellitus.

Figure 2. Acromegaly.  A. Coronal T1 weighted MRI with contrast in a patient with an intrasellar GH secreting adenoma.  Arrows indicate the common finding of “cutis gyrata”.  B. Sagittal T1 weighted MRI in the same patient with arrows indicating the frontal bossing and the enlarged frontal sinus, and * the tumor.


Cushing's disease causes changes in body habitus with characteristic increased weight gain, truncal obesity, "buffalo hump", enlargement of supraclavicular fat pads and moon facies. Skin changes are also common and include purple striae, easy bruisability, ruddy complexion, and increased body and facial hair. Patients suffer from fatigue, proximal muscle weakness, osteoporosis, psychological/psychiatric disorders, high blood pressure, and impaired glucose metabolism. They often have headache, menstrual disorders, and cognitive and emotional dysfunction.


Women with prolactinomas classically present with amenorrhea or oligomenorrhea and galactorrhea. Most are in their childbearing years, and are more likely to pursue medical attention for infertility and menstrual irregularity. Men, and women beyond their reproductive years, more often have headache, visual symptoms, sexual dysfunction, and signs of decreased pituitary function. Amenorrhea and galactorrhea are not specific to prolactinomas, however. Prolactin secretion is under constant inhibitory control from the hypothalamus. Any lesion that imposes pressure upon the portal venous connection of the pituitary stalk (infundibulum) connecting the hypothalamus and pituitary gland can interrupt these inhibitory dopaminergic signals.  This, in turn, causes an increase in serum prolactin levels, and mimics a prolactinoma, i.e., a 'pseudo-prolactinoma'. In such cases serum prolactin levels are usually only moderately elevated. As a general rule, serum prolactin levels over 200 ng/ml (3600mU/L) are indicative of prolactinomas (32).

Hypopituitarism

Tumor growth impairs the normal secretory function of the anterior pituitary and causes hypopituitarism. Common complaints include diminished sex drive, fatigue, weakness, and hypothyroidism. Pituitary insufficiency generally develops slowly over time.  However, acute pituitary insufficiency may occur in the setting of pituitary apoplexy, a condition in which the tumor infarcts or has internal bleeding (Fig 3). Pituitary tumor apoplexy can be particularly devastating, because it combines acute hypopituitarism and adrenal insufficiency with a rapidly expanding intracranial mass, and often causes visual loss or even sudden blindness.

Figure 3. Pituitary tumor apoplexy.  Sagittal T1 weighted MRI without contrast in a patient presenting with pituitary tumor apoplexy.  Note the fluid-fluid level within the tumor indicative of the apoplectic tumor.

Neurological Dysfunction

Neurologic signs and symptoms develop as adenomas grow beyond the confines of the sella turcica and exert pressure upon adjacent brain structures. As tumors enlarge, they compress the optic nerves and optic chiasm, and patients experience visual deficits and diminished visual acuity. Classically this causes a bitemporal hemianopia, i.e., visual loss in the temporal fields of each eye. Tumor growth may also affect other nerves (such as the 3rd, 4th, 5th, or 6th cranial nerves) and cause facial pain and/or double vision or drooping of the eyelid. Headache, although a non-specific complaint, can occur when a tumor stretches the dural sac that surrounds the pituitary gland. Headache from pituitary lesions is usually frontal or retro-orbital – it may be bitemporal or radiate to the occipito-cervical region.  Many patients will have been previously diagnosed with “migraine”, or “tension-headache” (33).

DIAGNOSIS

A panel of endocrinological tests can often confirm the clinical diagnosis of pituitary adenoma. Serum GH and IGF-1 levels screen for acromegaly. Failure to suppress GH levels after an oral glucose load (oral glucose tolerance test (OGTT)) can further confirm the diagnosis. Although any macroadenoma may cause moderate increases in serum PRL, levels greater than 200 ng/ml (3600 mU/L) are highly suggestive of a prolactin secreting adenoma. Dilution of the samples for assay may be necessary to avoid the “hook effect” related to macroprolactinemia.

Endocrinologic studies that suggest Cushing's disease includes an elevated ACTH and late night salivary or elevated 24-hour urine free cortisol (UFC), loss of the normal diurnal variation in cortisol levels, and suppression of serum cortisol levels after high dose dexamethasone but failure to suppress after low dose dexamethasone. Inferior petrosal vein sampling after corticotropin-releasing hormone (CRH) stimulation (i.e., Inferior Petrosal Sinus Sampling; IPSS) may be required to confirm and localize the pituitary source. At times, prior to diagnosing Cushing's disease, other ectopic sources of excess ACTH, such as bronchogenic or pancreatic carcinoma and pulmonary carcinoid tumors, must be excluded. This can often be accomplished with a CT scan or MRI of the chest and abdomen and with novel nuclear imaging tests (34, 35). Obesity, alcoholism, and depression also elevate serum cortisol levels, and the diagnosis of Cushing's disease should be made with caution in these “pseudo-Cushing’s” settings (36). 

TREATMENT

Although some incidentally-discovered microadenomas that do not cause symptoms may be followed clinically and with repeated MRI, patients with macroadenomas generally need medical or surgical intervention. Therapeutic goals include improved quality of life and survival; elimination of mass effect and reversal of related signs and symptoms, normalization of hormonal hypersecretion; preservation or recovery of normal pituitary function, and prevention of recurrence of the pituitary tumor.

MEDICAL THERAPY  

Medical therapy is available for most hypersecretory tumors (37-40). The majority of prolactin-secreting adenomas are effectively treated with dopamine agonists (bromocriptine and cabergoline). Cabergoline is generally preferred as a result of  a better side-effect profile, and between 80-90% of patients can achieve hormonal control (37). Surgical intervention is ordinarily reserved for those who are intolerant of medical therapy because of multiple side effects (e.g., nausea, headache, impulsive or compulsive behavior), whose prolactin levels remain elevated, or whose tumors continue to grow despite maximal medical treatment.


Medical treatment using somatostatin analogues (octreotide, lanreotide, and pasireotide) and dopamine agonists (cabergoline) have varying degrees of efficacy for treating GH adenomas.  The growth hormone receptor antagonist, pegvisamont, can be used in combination with other agents (41-43), and hormonal control can generally be achieved in about 60-90% of patients (37).  Although medical therapy is most often reserved for those patients’ awaiting surgery or those with persistent disease postoperatively, some advocate primary medical therapy, particularly for invasive tumors (44, 45). There is some conflicting evidence that pre-surgical medical therapy may improve surgical outcome (46).


Ketoconazole and/or metyrapone therapy can normalize serum cortisol levels in patients with Cushing's disease preoperatively 50-75% of the time. Metyrapone and ketoconazole inhibit enzymes in the adrenal gland required for steroid synthesis. A new and safer formulation, levoketoconazole is now available.  Along with acromegaly, surgery remains the first-line therapy for ACTH secreting tumors and Cushing disease. Clinical trials have also demonstrated some role for medical therapy with cabergoline or pasireotide, and with mifepristone (cortisol receptor blocker) in selected cases (47, 48).A new agent, osilodrostat, is under development.


The disadvantage of medical treatment of hypersecretory syndromes is that it is usually suppressive in nature and not fully cytotoxic. Tumors often recur when medications are discontinued, or they become resistant to therapy. Potential new targets are being explored, but have not yet reached clinical practice (49-51). 

RADIATION THERAPY

Radiotherapy is most often employed in conjunction with medical or surgical therapy. Fractionated external beam radiation therapy can reduce excessive hormone production and can reduce the incidence of tumor recurrence (52); however, it can be replaced by  stereotactic radiotherapy with focal conformal fractionated delivery. Gamma knife, Cyberknife, proton beam or linear accelerator stereotactic radiosurgery is increasingly considered as adjunctive therapy for pituitary tumors, and can be effective in normalizing hormonal hypersecretion and preventing recurrence (53-55). Whether by fractionated external beam or radiosurgery, the effects of radiotherapy are delayed. Patients require continued suppressive medical therapy during the period between treatment and effect. There is also a significant incidence of radiation-induced delayed hypopituitarism (52). There is no evidence to date that one of these various modalities is superior to another in efficacy, risks of complications, recurrence rates, or incidence of hypopituitarism. For more information on radiotherapy for pituitary tumors, see the corresponding chapter in Endotext.

SURGERY 

Indications for Surgery

For most pituitary tumors, surgery remains the first-line treatment of symptomatic pituitary adenomas. Large or invasive asymptomatic tumors may also warrant surgical consideration. It is sometime possible to estimate a tumor’s invasiveness on an MRI using the Knosp grading system (56). Asymptomatic tumors with evidence of radiographic invasion or displacement of the optic apparatus may benefit from surgery to prevent neurological deficits and progressive pituitary dysfunction. Surgery is also chosen secondarily when medical treatment fails for the treatment of prolactinoma. Regardless of the tumor type, surgery provides prompt relief from excess hormone secretion and mass effect. There is evidence to suggest that debulking of medically refractory prolactinomas and GH adenomas can return these tumors to a responsive state (57, 58). Rarely is surgery recommended as first line therapy for prolactinomas (59).  Surgery may be indicated in pituitary apoplexy with acute vision loss £ 72 hours as a result of mass effect on the optic chiasm from hematoma formation. Studies have shown that some patients with pituitary apoplexy can be successfully treated without operative intervention, but they are often confounded by selection bias, and the ideal patient has not been conclusively established for operative versus non-operative treatment (60-62).

Peri-Operative Management

A major component of the surgical management of patients with pituitary tumors actually occurs in the peri-operative period. Detailed information on peri-operative management of pituitary tumors can be found elsewhere (63). Briefly, pre-operative planning is very important in order to avoid complications and achieve optimal outcomes. It is obligatory to note any prior nasal surgery, review prior imaging, and obtain adequate pre-operative imaging for integration with neuronavigational systems. Typically, a high resolution T1 post contrast MRI is adequate for neuronavigational registration. The authors advocate additional imaging that includes (1) coronal and sagittal T1-weighted pre and post contrast images with at least 3mm slice thickness through the parasellar region for identification of the tumor, pituitary gland/stalk, cavernous sinus, and vasculature, (2) axial T2-weighted images of the sella to measure intercarotid distance, and (3) a coronal and sagittal strong T2-weighted Constructive Interface in Steady State (i.e., CISS, also known as FIESTA) through the parasellar region to identify midline structures and the optic chiasm. For revision surgery, a CT scan of the sinuses can be helpful to identify abnormal osseous anatomy. The imaging should be reviewed to identify normal gland and pituitary stalk, look for cavernous sinus invasion, identify arachnoid diverticula, and verify anatomical landmarks. Finally, it is critical to assess pre-operative pituitary function and replete necessary hormones (especially cortisol and thyroid hormones) prior to surgery. Remember to replete cortisol before thyroid hormone to avoid precipitating an adrenal crisis. For more information on the evaluation and management of pituitary hormone deficiency, see corresponding chapters in Endotext.


Post-operative management varies from routine to very complicated depending on the lesion size and extent of the operation and post-operative pituitary function. Patients with complete removal of intrasellar non-functioning tumors and intraoperative preservation of the normal pituitary gland without a cerebrospinal fluid (CSF) leak can have a relatively benign post-operative course. It is important to monitor closely for diabetes insipidus (DI), check a fasting morning cortisol to rule out secondary adrenal insufficiency, and restrict fluids as appropriate to prevent the syndrome of inappropriate anti-diuretic hormone (SIADH) (64). Patients with larger suprasellar or invasive tumors and/or those with CSF leaks requiring more extensive skull base reconstructions may require ICU care (65, 66). For information on the management of endocrine dysfunction and post-operative care in Cushing’s disease and Acromegaly, please see the corresponding chapters in Endotext.

Surgical Technique

The minimally invasive transsphenoidal approach can be used effectively for 95% of pituitary tumors. Exceptions are those large tumors with significant temporal or anterior cranial fossa extension. In such circumstances, transcranial approaches are often more appropriate. Occasionally, combined transsphenoidal and transcranial approaches are used. Nevertheless, some surgeons extend the basic transsphenoidal exposure in order to remove some of these tumors and avoid a craniotomy (Fig. 4) (67-70).


The transsphenoidal approach is a versatile method for treating pituitary tumors (Table 4). Endoscopic approaches may be used in isolation or as an adjunct to the other transsphenoidal approaches (Fig. 4) (71-78). Computer-guided neuronavigational techniques are nearly ubiquitous at major pituitary centers in lieu of traditional fluoroscopic guidance (79, 80). The role of neuronavigation is most pertinent in recurrent adenomas in which the midline anatomy has been distorted by previous transsphenoidal surgery. Intraoperative MRI is increasingly available and appears to be most applicable for large tumors (81).  There are three basic variations of the transsphenoidal approach.

Figure 4. Endoscopic approach. Intra-operative photograph of one surgeon (left) driving the endoscope while the main surgeon (right) resects the tumor.


Table 4. Transsphenoidal Surgery for Pituitary Adenomas: Personal Summary of 3744 Cases over a 36 year period

Type of Adenoma

Number of Patients (%)

Functioning adenomas


GH adenoma (Acromegaly)

662 (17.7)

PRL adenoma

975 (26.0)

ACTH adenoma (Cushing's disease)

680 (18.2)

TSH adenoma

45 (1.2)

Non-functioning adenomas

1382 (36.9)

SUBMUCOSAL TRANSSEPTAL APPROACH

The patient is placed in a lawn-chair position and a hemi-transfixion incision is made just inside the nostril so that the scar cannot be seen after surgery (Fig. 5). Most often the entire procedure can be accomplished endonasally. Conversion to a sublabial approach may be necessary for large macroadenomas and children in whom the exposure through one nostril is sometimes inadequate. A submucosal plane is developed along the nasal septum back to the level of the sphenoid sinus. Bone of the septum can be harvested for use later in the operation. The bone in front of the pituitary gland is also removed, the dura opened, and tumor is extracted in fragments (Fig. 6). Afterwards the saved bone, cartilage, or artificial material can be used to refashion the normal housing of the pituitary gland. Closure is rapid and consists of several interrupted absorbable sutures in the nasal mucosa and temporary nasal packing to promote healing of the mucosa.

Figure 5. Standard positioning for the endonasal approach (above). Below left, endonasal hemitransfixion incision; below right, direct sphenoidotomy technique.

Figure 6. Left, standard endonasal approach showing the trajectory to sella in sagittal view; Right, sequential steps used in tumor removal and repair of the sellar floor common to all techniques.

SEPTAL PUSHOVER/DIRECT SPHENOIDOTOMY

This approach uses incisions deeper within the nasal cavity (Fig 6, lower right. The incision for the septal pushover technique is made at the junction of the cartilaginous and bony septum. Submucosal tunnels are developed on either side of the bony septum until the sphenoid sinus is reached. Another option to reach the sphenoid sinus is by performing a direct sphenoidotomy. Using this method, no incision is made in the septum. Instead, the posterior part of septum just in front of the sphenoid sinus is deflected laterally and the sphenoid sinus is entered directly. There are several advantages to these techniques. Because there is no submucosal dissection of the cartilaginous septum, the risk of an anterior nasal septal perforation is eliminated. In addition, there is less need for nasal packing postoperatively, a frequent cause of postoperative pain and discomfort. The main drawback of these more direct approaches is that the exposure is not as wide as can be achieved by the standard endonasal transseptal approach in which the cartilaginous septum can be more extensively mobilized.

PURE ENDOSCOPIC APPROACH

The pure endoscopic approach has much appeal and is becoming the procedure of choice at many pituitary centers  (82, 83). Surgery begins at the sphenoid rostrum where a direct anterior sphenoidotomy is performed after identifying the natural sphenoid os within the sphenoidoethmoidal recess. Some surgeons prefer to perform the surgery using a single nostril. A binostril approach, however, provides more maneuverability and two-handed microdissection. To achieve an adequate exposure for the binostril approach, the middle and superior turbinates are lateralized and the bony septum just in front of the sphenoid sinus is removed. The sphenoidotomy is widened from the midline inferior vomer to the ethmoid air cells superiorly and then laterally until the carotid arteries are easily visualized (Fig 7-A). This allows instruments to be used in both nostrils simultaneously. Although a specialized endoscope holder may be used during tumor removal, the “3-hand” technique is advocated by many surgeons. The “3-hand” or “4-hand” technique requires two surgeons; one surgeon maneuvers the endoscope while another has both hands free to remove the tumor using microsurgical techniques. The surgical team is typically a neurosurgeon and otolaryngologist with experience in skull base surgery. Extended approaches are more commonly performed by teams rather than individuals (80, 84). The endoscope provides panoramic magnified views of the sellar anatomy during both the approach to and resection of tumors (Fig 7 – A, B). The option of using angled endoscopes allows surgeons to inspect for residual tumor, particularly along the cavernous sinus walls and the suprasellar region (85) (Fig 7 – C, D). No nasal packing is required as the procedure is performed posterior to the septum. The main disadvantages are the procedure’s learning curve and that the depth of field may problematic for some surgeons. There are 3D endoscopes and continued development of High Defintion (HD) imaging that may help to alleviate this potential problem. A recent international survey showed that about 7% of surgeons report using the 3D endoscope for transsphenoidal surgery. Advances in patient specific anatomical modeling is increasingly available for integration with the neuronavigation in the form of “augmented reality” which helps the surgeon visualize otherwise hidden anatomical structures (86). Finally, given the importance of vision preservation during endonasal surgery, especially with extended approaches, new developments in visual evoked potential monitoring are being studied (87). The clinical benefit of these new technologies is promising but still uncertain.

Figure 7. Endoscopic views.  A.  After the anterior wall of the sphenoid sinus is opened, the endoscope provides a panoramic view of the sella and surrounding anatomy. B. Endoscopic view of the tumor bed after resection.  C. Endoscopic view of the right cavernous sinus wall using the 0 degree endoscope.  D.  Note the dramatically improved view of the right cavernous sinus wall in the same patient using the 45 degree endoscope.  (arrowhead= carotid artery)

Outcome

Surgical outcomes after surgery for pituitary adenomas can be divided into functional outcomes and oncologic outcomes. Functional goals include the relief of symptoms and improvement or preservation of pituitary and visual function, along with improved quality of life (88-90). Visual deficits in patients with non-functioning pituitary adenomas are improved in approximately 80-90%. Some visual deterioration may occur in 0-4%. Most patients with intact pituitary function preoperatively retain their normal function. Those with preoperative pituitary deficiency regain function in 27% of the cases. The remaining patients are managed with hormone replacement therapy. Oncologic outcomes relate to tumor resection, recurrence, and biochemical remission from hormonal excess. Ten-year recurrence rates are approximately 16%, although only 6% require additional treatment (Table 5). On long-term follow-up, 83% of patients are alive and well without evidence of disease.

Table 5. Results of Transsphenoidal Surgery, Personal Summary of 3093 Cases over a 28 year period. Proportions (%) represent cumulative incidence.

Tumor

Remission

10-year Recurrence

Non-functioning adenoma

Not applicable*

16%

GH adenoma

Microadenoma

88%

1.3%

Macroadenoma

65%

PRL adenoma

Microadenoma

87%

13%

Macroadenoma

56%

ACTH adenoma

Microadenoma

91%

12% (Adults)

42% (Pediatric)

Macroadenoma

65%

 *Visual improvement occurs in 87% of those with preoperative visual loss.


Currently, using strict criteria for remission and in expert hands, transsphenoidal surgery obtains remission in 85-90% of patients with acromegaly with microadenomas and 65% of those harboring macroadenomas. For functional tumors, remission rates vary by tumor size and tumor type (91). Microadenomas typically have higher biochemical remission rates and remission rates are highest for microprolactinomas (92.3%) and lowest for somatotroph macroadenomas (40%). Currently, acromegalic symptoms are improved in 95% and recurrence is less than 2 percent at ten years. Ninety seven percent of patients have preserved normal pituitary function  (92). Modern criteria for remission include normal IGF-1 levels and either GH suppression to less than 0.4 ng/ml with oral glucose tolerance test or fasting GH less than 1.0 ng/ml. Using these criteria, surgical biochemical remission is over 60% (93). Both repeat surgery and medical therapy are options for those with residual disease and/or biochemical recurrence (37, 94).


Patients with prolactinomas who present for surgery are most often those who have failed medical management. Endonasal surgery for prolactinomas is associated with additional risks resulting from tumor fibrosis after dopamine agonist therapy but remission rates are still quite good. Prolactin levels are normalized in about 87% of microadenomas and 56% of macroadenomas (Table 5). The recurrence rate among those patients who are normalized after a transsphenoidal operation is 13% at ten years. Preserved pituitary function occurs in all but 3%.


Surgical management of Cushing's disease achieves a 91% remission rate for microadenomas, but falls to 65% for those with macroadenomas. Some 10-20% of adults experience recurrence after ten years. Postoperative stereotactic radiosurgery has achieved remission in approximately 60-70% of patients whose disease either did not remit following surgery or recurred (95).


Pituitary surgeons, with all health care professionals, strive for excellence in the care of our patients, it is becoming clear that criteria must be developed in order optimize surgical outcomes. Recently, a consensus statement on Pituitary Tumor Centers of Excellence (PTCOE) was released (96). In brief, PTCOE should be independent non-for-profit organizations, widely recognized by endocrinologist and pituitary surgeons, aimed at the advancement of pituitary science and the highest quality of patient care. They should also be recognized by external societies and act as resident training centers.

Complications of Transsphenoidal Surgery

Complication avoidance is central to transsphenoidal surgery given the close proximity of major neurologic and vascular structures (97, 98). Recently, surgical checklists for endonasal transsphenoidal surgery have been developed in order to optimize surgical outcomes and avoid complications (99). The overall mortality rate for transsphenoidal surgery is less than 0.5% (Table 6). Major morbidity (cerebrospinal fluid leak, meningitis, stroke, intracranial hemorrhage, and visual loss) occurs in between 1 and 3% of cases. Less serious complications (sinus disease, nasal septal perforations, and wound issues) occur in approximately 1-7%. Larger invasive tumors and giant adenomas are associated with a higher morbidity. In the modern era, more aggressive extended approaches to large invasive tumors has led to a higher incidence of CSF leak, but the use of the pedicled nasoseptal flap has been largely successful in preventing recurrent leaks with a success rate of up to 98.6% (100). The nasoseptal flap can also be used again in certain revision cases with good results (101).


Table 6. Complications of Transsphenoidal Surgery (1972-2017). Personal historical series and a modern results covering a 45 year period and 4,246 cases.

 Outcome Measure

Cumulative Incidence (%)


1972-2000

1992-2017 (102)

 Mortality

<0.5%

<0.3%

Major complication: (CSF leak, meningitis, ischemic stroke, intracranial hemorrhage, vascular injury, visual loss)

1.5%

CSF leak 2.6%

Other 3.2%

Minor complication: (sinus disease, septal perforations, epistaxis, wound infections and hematomas)

6.5%

1.3%

CONCLUSIONS

Pituitary adenomas are a complex set of benign tumors that present with characteristic hypersecretory syndromes and mass effect. Although medical and radiotherapy offer effective treatment for particular functional tumors in specific situations, transsphenoidal surgery continues to provide optimal outcomes for non-prolactin secreting adenomas with a low incidence of major morbidity.

REFERENCES

  1. Lopes, M.B.S., The 2017 World Health Organization classification of tumors of the pituitary gland: a summary. Acta Neuropathologica, 2017. 134(4): p. 521-535.
  2. Palmieri, D., et al., PIT1 upregulation by HMGA proteins has a role in pituitary tumorigenesis. Endocrine-Related Cancer, 2012. 19(2): p. 123-135.
  3. Chiappetta, G., et al., High level expression of the HMGI (Y) gene during embryonic development. Oncogene, 1996. 13(11): p. 2439-46.
  4. Budan, R.M. and C.E. Georgescu, Multiple Pituitary Adenomas: A Systematic Review. Frontiers in Endocrinology, 2016. 7(8): p. 950-8.
  5. Annegers, J.F., et al., Pituitary adenoma in Olmsted County, Minnesota, 1935--1977. A report of an increasing incidence of diagnosis in women of childbearing age. Mayo Clinic Proceedings, 1978. 53(10): p. 641-3.
  6. Clayton, R.N., Sporadic pituitary tumours: from epidemiology to use of databases. Best Practice & Research Clinical Endocrinology & Metabolism, 1999. 13(3): p. 451-60.
  7. Lovaste, M.G., G. Ferrari, and G. Rossi, Epidemiology of primary intracranial neoplasms. Experiment in the Province of Trento, (Italy), 1977-1984. Neuroepidemiology, 1986. 5(4): p. 220-32.
  8. Monson, J.P., The epidemiology of endocrine tumours. Endocrine-Related Cancer, 2000. 7(1): p. 29-36.
  9. Wen-qing, H., et al., Statistical analysis of central nervous system tumors in China. Journal of Neurosurgery, 1982. 56(4): p. 555-64.
  10. Fan, K.J. and G.H. Pezeshkpour, Ethnic distribution of primary central nervous system tumors in Washington, DC, 1971 to 1985. Journal of the National Medical Association, 1992. 84(10): p. 858-63.
  11. Heshmat, M.Y., et al., Neoplasms of the central nervous system. incidence and population selectivity in the Washington DC, metropolitan area. Cancer, 1976. 38(5): p. 2135-42.
  12. Percy, A.K., et al., Neoplasms of the central nervous system. Epidemiologic considerations. Neurology, 1972. 22(1): p. 40-8.
  13. Robinson, N., V. Beral, and J.S. Ashley, Incidence of pituitary adenoma in women. Lancet, 1979. 2(8143): p. 630.
  14. Gittleman, H., et al., Descriptive epidemiology of pituitary tumors in the United States, 2004–2009. Journal of Neurosurgery, 2014. 121: p. 527-535.
  15. Tomita, T. and E. Gates, Pituitary adenomas and granular cell tumors. Incidence, cell type, and location of tumor in 100 pituitary glands at autopsy. American Journal of Clinical Pathology, 1999. 111(6): p. 817-25.
  16. Costello, R.T., Subclinical Adenoma of the Pituitary Gland. American Journal of Pathology, 1936. 12(2): p. 205-216.1.
  17. Alexander, L., et al., Epidemiology of acromegaly in the Newcastle region. Clinical Endocrinology, 1980. 12(1): p. 71-9.
  18. Etxabe, J., et al., Acromegaly: an epidemiological study. Journal of Endocrinological Investigation, 1993. 16(3): p. 181-7.
  19. Ritchie, C.M., et al., Ascertainment and natural history of treated acromegaly in Northern Ireland. Ulster Medical Journal, 1990. 59(1): p. 55-62.
  20. Bengtsson, B.A., et al., Epidemiology and long-term survival in acromegaly. A study of 166 cases diagnosed between 1955 and 1984. Acta Medica Scandinavica, 1988. 223(4): p. 327-35.
  21. Orme, S.M., et al., Mortality and cancer incidence in acromegaly: a retrospective cohort study. United Kingdom Acromegaly Study Group. Journal of Clinical Endocrinology & Metabolism, 1998. 83(8): p. 2730-4.
  22. Popovic, V., et al., Increased incidence of neoplasia in patients with pituitary adenomas. The Pituitary Study Group. Clinical Endocrinology, 1998. 49(4): p. 441-5.
  23. Nabarro, J.D., Acromegaly. Clinical Endocrinology, 1987. 26(4): p. 481-512.
  24. Etxabe, J. and J.A. Vazquez, Morbidity and mortality in Cushing's disease: an epidemiological approach. Clinical Endocrinology, 1994. 40(4): p. 479-84.
  25. Howlett, T.A., et al., Diagnosis and management of ACTH-dependent Cushing's syndrome: comparison of the features in ectopic and pituitary ACTH production. Clinical Endocrinology, 1986. 24(6): p. 699-713.
  26. Sandler, L.M., et al., Long term follow-up of patients with Cushing's disease treated by interstitial irradiation. Journal of Clinical Endocrinology & Metabolism, 1987. 65(3): p. 441-7.
  27. Seltzer, J., et al., Outcomes following transsphenoidal surgical management of incidental pituitary adenomas: a series of 52 patients over a 17-year period. Journal of Neurosurgery, 2019. 130(5): p. 1584-1592.
  28. Feldkamp, J., et al., Incidentally discovered pituitary lesions: high frequency of macroadenomas and hormone-secreting adenomas - results of a prospective study. Clinical Endocrinology, 1999. 51(1): p. 109-13.
  29. Donovan, L.E. and B. Corenblum, The natural history of the pituitary incidentaloma. Archives of Internal Medicine, 1995. 155(2): p. 181-3.
  30. Molitch, M.E., Pituitary incidentalomas. Endocrinology & Metabolism Clinics of North America, 1997. 26(4): p. 725-40.
  31. Molitch, M.E. and E.J. Russell, The pituitary "incidentaloma". Annals of Internal Medicine, 1990. 112(12): p. 925-31.
  32. Smith, M.V. and E.R. Laws Jr, Magnetic Resonance Imaging Measurements of Pituitary Stalk Compression and Deviation in Patients with Nonprolactin-Secreting Intrasellar and Parasellar Tumors: Lack of Correlation with Serum Prolactin Levels. Neurosurgery, 1994. 34(5).
  33. Rizzoli, P., et al., Headache in Patients With Pituitary Lesions. Neurosurgery, 2016. 78(3): p. 316-323.
  34. Isidori, A.M., et al., Conventional and Nuclear Medicine Imaging in Ectopic Cushing's Syndrome: A Systematic Review. Journal of Clinical Endocrinology & Metabolism, 2015. 100(9): p. 3231-44.
  35. Calligaris, D., et al., MALDI mass spectrometry imaging analysis of pituitary adenomas for near-real-time tumor delineation. Proceedings of the National Academy of Sciences of the United States of America, 2015. 112(32): p. 9978-83.
  36. Pecori Giraldi, F. and A.G. Ambrogio, Pseudo-Cushing - A Clinical Challenge? Frontiers of Hormone Research, 2016. 46: p. 1-14.
  37. Molitch, M.E., Diagnosis and Treatment of Pituitary Adenomas. Journal of the American Medical Association, 2017. 317(5): p. 516-9.
  38. Newman, C.B., Medical therapy for acromegaly. Endocrinology & Metabolism Clinics of North America, 1999. 28(1): p. 171-90.
  39. Orrego, J.J. and A.L. Barkan, Pituitary disorders. Drug treatment options. Drugs, 2000. 59(1): p. 93-106.
  40. Shimon, I. and S. Melmed, Management of pituitary tumors. Annals of Internal Medicine, 1998. 129(6): p. 472-83.
  41. Higham, C.E., et al., Long-term experience of pegvisomant therapy as a treatment for acromegaly. Clinical Endocrinology, 2009. 71(1): p. 86-91.
  42. Parkinson, C. and P.J. Trainer, Growth hormone receptor antagonists therapy for acromegaly. Best Practice & Research Clinical Endocrinology & Metabolism, 1999. 13(3): p. 419-30.
  43. Trainer, P.J., et al., A randomized, controlled, multicentre trial comparing pegvisomant alone with combination therapy of pegvisomant and long-acting octreotide in patients with acromegaly. Clinical Endocrinology, 2009. 71(4): p. 549-57.
  44. Bush, Z.M. and M.L. Vance, Management of acromegaly: is there a role for primary medical therapy? Reviews in Endocrine & Metabolic Disorders, 2008. 9(1): p. 83-94.
  45. Tritos, N.A., et al., Effectiveness of first-line pegvisomant monotherapy in acromegaly: an ACROSTUDY analysis. European Journal of Endocrinology, 2017. 176(2): p. 213-220.
  46. Losa, M., P. Mortini, and M. Giovanelli, Is presurgical treatment with somatostatin analogs necessary in acromegalic patients? Journal of Endocrinological Investigation, 1999. 22(11): p. 871-3.
  47. Fleseriu, M., Medical treatment of Cushing disease: new targets, new hope. Endocrinology & Metabolism Clinics of North America, 2015. 44(1): p. 51-70.
  48. Hamrahian, A.H., et al., AACE/ACE Disease State Clinical Review: Medical Management of Cushing Disease. Endocrine Practice, 2014. 20(7): p. 746-57.
  49. Feelders, R.A., et al., Advances in the medical treatment of Cushing's syndrome. The lancet. Diabetes & endocrinology, 2019. 7(4): p. 300-312.
  50. Theodoropoulou, M. and M. Reincke, Tumor-Directed Therapeutic Targets in Cushing Disease. The Journal of Clinical Endocrinology & Metabolism, 2019. 104(3): p. 925-933.
  51. Hinojosa-Amaya, J.M., D. Cuevas-Ramos, and M. Fleseriu, Medical Management of Cushing's Syndrome: Current and Emerging Treatments. Drugs, 2019. 79(9): p. 935-956.
  52. Zaugg, M., et al., External irradiation of macroinvasive pituitary adenomas with telecobalt: a retrospective study with long-term follow-up in patients irradiated with doses mostly of between 40-45 Gy. International Journal of Radiation Oncology, Biology, Physics, 1995. 32(3): p. 671-80.
  53. Jackson, I.M. and G. Noren, Role of gamma knife therapy in the management of pituitary tumors. Endocrinology & Metabolism Clinics of North America, 1999. 28(1): p. 133-42.
  54. Kim, S.H., et al., Gamma Knife radiosurgery for functioning pituitary adenomas. Stereotactic & Functional Neurosurgery, 1999. 72 Suppl 1: p. 101-10.
  55. Sheehan, J.P., et al., Gamma Knife surgery for pituitary adenomas: factors related to radiological and endocrine outcomes. Journal of Neurosurgery, 2011. 114(2): p. 303-9.
  56. Knosp, E., et al., Pituitary Adenomas with Invasion of the Cavernous Sinus Space: A Magnetic Resonance Imaging Classification Compared with Surgical Findings. Neurosurgery, 1993. 33(4): p. 610-618.
  57. Colao, A., et al., Partial surgical removal of growth hormone-secreting pituitary tumors enhances the response to somatostatin analogs in acromegaly. Journal of Clinical Endocrinology & Metabolism, 2006. 91(1): p. 85-92.
  58. Hamilton, D.K., et al., Surgical outcomes in hyporesponsive prolactinomas: analysis of patients with resistance or intolerance to dopamine agonists. Pituitary, 2005. 8(1): p. 53-60.
  59. Donoho, D.A. and E.R. Laws, The Role of Surgery in the Management of Prolactinomas. Neurosurgery Clinics of North America, 2019. 30(4): p. 509-514.
  60. Briet, C., et al., Pituitary Apoplexy. Endocrine Reviews, 2015. 36(6): p. 622-45.
  61. Rutkowski, M.J., et al., Surgical intervention for pituitary apoplexy: an analysis of functional outcomes. Journal of Neurosurgery, 2018. 129(2): p. 417-424.
  62. Barkhoudarian, G. and D.F. Kelly, Pituitary Apoplexy. Neurosurgery Clinics of North America, 2019. 30(4): p. 457-463.
  63. Transsphenoidal Surgery. Complication Avoidance and Management Techniques, ed. E.R. Laws Jr, et al. 2017, Cham: Springer International Publishing.
  64. Burke, W.T., A practical method for prevention of readmission for symptomatic hyponatremia following transsphenoidal surgery. Pituitary, 2018. 21(1): p. 25-31.
  65. Sanchez, M.M., et al., Management of Giant Pituitary Adenomas. Neurosurgery Clinics of North America, 2019. 30(4): p. 433-444.
  66. Rutkowski, M. and G. Zada, Management of Pituitary Adenomas Invading the Cavernous Sinus. Neurosurgery Clinics of North America, 2019. 30(4): p. 445-455.
  67. Kaptain, G.J., et al., Transsphenoidal approaches for the extracapsular resection of midline suprasellar and anterior cranial base lesions.(Reprint in Neurosurgery. 2008 Jun;62(6 Suppl 3):1264-71; PMID: 18695546). Neurosurgery, 2001. 49(1): p. 94-100; discussion 100-1.
  68. Kato, T., et al., Transsphenoidal-transtuberculum sellae approach for supradiaphragmatic tumours: technical note. Acta Neurochirurgica, 1998. 140(7): p. 715-8; discussion 719.
  69. Kouri, J.G., et al., Resection of suprasellar tumors by using a modified transsphenoidal approach. Report of four cases. Journal of Neurosurgery, 2000. 92(6): p. 1028-35.
  70. Weiss, M.H., Transnasal Transsphenoidal Approach, in Surgery of the Third Ventricle, M.L.J. Apuzzo, Editor. 1987, Williams and Wilkins: Baltimore. p. 476-494.
  71. Cavallo, L.M., et al., Endoscopic endonasal transsphenoidal surgery. Before scrubbing in: tips and tricks. Surgical Neurology, 2007. 67(4): p. 342-7.
  72. Frank, G., et al., The endoscopic versus the traditional approach in pituitary surgery. Neuroendocrinology, 2006. 83(3-4): p. 240-8.
  73. Jane, J.A., Jr., et al., Perspectives on endoscopic transsphenoidal surgery. Neurosurgical Focus, 2005. 19(6): p. E2.
  74. Jane, J.A., Jr., et al., Endoscopic transsphenoidal surgery for acromegaly: remission using modern criteria, complications, and predictors of outcome. Journal of Clinical Endocrinology & Metabolism, 2011. 96(9): p. 2732-40.
  75. Jankowski, R., et al., Endoscopic pituitary tumor surgery. Laryngoscope, 1992. 102(2): p. 198-202.
  76. Jho, H.D. and A. Alfieri, Endoscopic endonasal pituitary surgery: evolution of surgical technique and equipment in 150 operations. Minimally Invasive Neurosurgery, 2001. 44(1): p. 1-12.
  77. Jho, H.D. and R.L. Carrau, Endoscopy assisted transsphenoidal surgery for pituitary adenoma. Technical note. Acta Neurochirurgica, 1996. 138(12): p. 1416-25.
  78. Kassam, A., et al., Expanded endonasal approach: the rostrocaudal axis. Part I. Crista galli to the sella turcica. Neurosurgical Focus, 2005. 19(1): p. E3.
  79. Elias, W.J., et al., Frameless stereotaxy for transsphenoidal surgery. Neurosurgery, 1999. 45(2): p. 271-5; discussion 275-7.
  80. de Divitiis, E., et al., The Current Status of Endoscopy in Transsphenoidal Surgery: An International Survey. World Neurosurgery, 2015. 83(4): p. 447-454.
  81. Nimsky, C., et al., Intraoperative high-field magnetic resonance imaging in transsphenoidal surgery of hormonally inactive pituitary macroadenomas. Neurosurgery, 2006. 59(1): p. 105-14; discussion 105-14.
  82. McLaughlin, N., et al., Pituitary centers of excellence. Neurosurgery, 2012. 71(5): p. 916-24; discussion 924-6.
  83. Rolston, J.D., S.J. Han, and M.K. Aghi, Nationwide shift from microscopic to endoscopic transsphenoidal pituitary surgery. Pituitary, 2016. 19(3): p. 248-50.
  84. Somma, T., et al., From the Champion to the Team: New Treatment Paradigms in Contemporary Neurosurgery. World Neurosurgery, 2019. 131: p. 141-148.
  85. Oertel, J., M.R. Gaab, and S. Linsler, The endoscopic endonasal transsphenoidal approach to sellar lesions allows a high radicality: The benefit of angled optics. Clinical Neurology and Neurosurgery, 2016. 146: p. 29-34.
  86. Carl, B., et al., Augmented Reality in Transsphenoidal Surgery. World Neurosurgery, 2019. 125: p. e873-e883.
  87. Kurozumi, K., et al., Simultaneous combination of electromagnetic navigation with visual evoked potential in endoscopic transsphenoidal surgery: clinical experience and technical considerations. Acta Neurochirurgica, 2017: p. 1-6.
  88. Laws Jr, E.R., et al., A Benchmark for Preservation of Normal Pituitary Function After Endoscopic Transsphenoidal Surgery for Pituitary Macroadenomas. World Neurosurgery, 2016. 91(C): p. 371-375.
  89. Dallapiazza, R.F. and J.A. Jane Jr, Outcomes of Endoscopic Transsphenoidal Pituitary Surgery. Endocrinology and Metabolism Clinics of NA, 2015. 44(1): p. 105-115.
  90. Wolf, A., et al., Quantitative evaluation of vision-related and health-related quality of life after endoscopic transsphenoidal surgery for pituitary adenoma. Journal of Neurosurgery, 2017. 127(2): p. 409-416.
  91. Hofstetter, C.P., et al., Endoscopic endonasal transsphenoidal surgery for functional pituitary adenomas. Neurosurgical Focus, 2011. 30(4): p. E10.
  92. Starke, R.M., et al., Endoscopic vs microsurgical transsphenoidal surgery for acromegaly: outcomes in a concurrent series of patients using modern criteria for remission. Journal of Clinical Endocrinology & Metabolism, 2013. 98(8): p. 3190-8.
  93. Jane Jr, J.A., et al., Endoscopic Transsphenoidal Surgery for Acromegaly: Remission Using Modern Criteria, Complications, and Predictors of Outcome. The Journal of Clinical Endocrinology & Metabolism, 2011. 96(9): p. 2732-2740.
  94. Katznelson, L., et al., Acromegaly: An Endocrine Society Clinical Practice Guideline. The Journal of Clinical Endocrinology & Metabolism, 2014. 99(11): p. 3933-3951.
  95. Ironside, N., et al., Outcomes of Pituitary Radiation for Cushing's Disease. Endocrinology and Metabolism Clinics of NA, 2018. 47(2): p. 349-365.
  96. Casanueva, F.F., Criteria for the definition of Pituitary Tumor Centers of Excellence (PTCOE): A Pituitary Society Statement. Pituitary, 2017. 20(5): p. 489-498.
  97. Zada, G., et al., The neurosurgical anatomy of the sphenoid sinus and sellar floor in endoscopic transsphenoidal surgery. Journal of Neurosurgery, 2011. 114: p. 1319-1330.
  98. de Divitiis, O., et al., The (R)evolution of Anatomy. World Neurosurgery, 2019. 127: p. 710-735.
  99. Laws, E.R., et al., A checklist for endonasal transsphenoidal anterior skull base surgery. Journal of Neurosurgery, 2016. 124(6): p. 1634-1639.
  100. Eloy, J.A., et al., Nasoseptal flap repair after endoscopic transsellar versus expanded endonasal approaches: Is there an increased risk of postoperative cerebrospinal fluid leak? The Laryngoscope, 2012. 122(6): p. 1219-1225.
  101. Zanation, A.M., et al., Nasoseptal flap takedown and reuse in revision endoscopic skull base reconstruction. The Laryngoscope, 2010. 121(1): p. 42-46.
  102. Agam, M.S., et al., Complications associated with microscopic and endoscopic transsphenoidal pituitary surgery: experience of 1153 consecutive cases treated at a single tertiary care pituitary center. Journal of Neurosurgery, 2019. 130(5): p. 1576-1583.


Atypical Forms of Diabetes

ABSTRACT


While most patients with diabetes have Type 1 diabetes (T1D) or Type 2 diabetes (T2D) there are other etiologies of diabetes that occur less frequently. In this chapter we will discuss a number of these less-common causes of diabetes. It is clinically very important to recognize these uncommon causes of diabetes as treatment directed towards the underlying etiology can at times result in the remission of the diabetes (for example Cushing’s Syndrome) or be required to avoid other complications of the underlying disorder (for example hemochromatosis, which in addition to causing diabetes can lead to severe liver disease and congestive heart failure). In this chapter the following disorders that are associated with diabetes are discussed: 1) genetic disorders of insulin action (Type A insulin resistance, Donohue Syndrome/Leprechaunism, Rabson-Mendenhall syndrome); 2) maternally inherited diabetes mellitus and deafness syndrome; 3) disorders of the exocrine pancreas (pancreatitis, trauma/pancreatectomy, neoplasia, cystic fibrosis, hemochromatosis); 4) endocrinopathies (acromegaly, Cushing’s syndrome, glucagonoma, pheochromocytoma, hyperthyroidism, somatostatinoma, primary hyperaldosteronism); 5) drug induced; 6) infections; 7) immune mediated (stiff-man syndrome, anti-insulin receptor antibodies); 8) ketosis prone diabetes (Flatbush diabetes); and 9) genetic disorder sometimes associated with diabetes (Down syndrome, Klinefelter syndrome, Turner syndrome, Wilsons syndrome, Wolfram syndrome, Friedreich ataxia, Huntington chorea, Bardet-Biedl syndrome (Laurence-Moon-Biedl syndrome), myotonic dystrophy, porphyria, Prader-Willi syndrome, Alström syndrome). Gestational diabetes, monogenic diabetes (maturity onset diabetes of the young (MODY) and neonatal diabetes), lipodystrophy, fibrocalculous pancreatic disease, diabetes associated with HIV infection, diabetes due to the autoimmune polyglandular syndromes, and post-transplant diabetes are not discussed in this chapter as they are discussed in other Endotext chapters.


INTRODUCTION


While most patients with diabetes have Type 1 diabetes (T1D) or Type 2 diabetes (T2D) there are other etiologies of diabetes that occur less frequently. In this chapter we will discuss a number of these less-common causes of diabetes (see table 1). Note that gestational diabetes, monogenic diabetes (maturity onset diabetes of the young (MODY) and neonatal diabetes), lipodystrophy, fibrocalculous pancreatic disease, diabetes associated with HIV infection, diabetes due to the autoimmune polyglandular syndromes, and post-transplant diabetes are discussed in separate Endotext chapters (1-7). It is clinically very important to recognize these uncommon causes of diabetes as treatment directed towards the underlying etiology can at times result in the remission of the diabetes (for example Cushing’s Syndrome) or be required to avoid other complications of the underlying disorder (for example hemochromatosis, which in addition to causing diabetes can lead to severe liver disease and congestive heart failure).


Table 1. Non-Type 1 Non-T2D Classification       

Genetic defects of beta-cell development and function

MODY (common causes- GCK, HNF1A, HNF4A, HNF1B) 

Neonatal Diabetes (common causes- KCNJ11, ABCC8, INS, 6q24)

1.     Mitochondrial DNA

Genetic defects in insulin action

1.     Type A insulin resistance

2.     Donohue Syndrome (Leprechaunism)

3.     Rabson-Mendenhall syndrome

4.     Lipoatrophic diabetes

Diseases of the exocrine pancreas

1.     Pancreatitis

2.     Fibrocalculous pancreatic disease

3.     Trauma/pancreatectomy

4.     Neoplasia

5.     Cystic fibrosis

6.     Hemochromatosis (iron overload)

Thalassemia (iron overload)

Endocrinopathies

1.     Acromegaly

2.     Cushing’s syndrome

3.     Glucagonoma

4.     Pheochromocytoma

5.     Hyperthyroidism

6.     Somatostatinoma

7.     Primary hyperaldosteronism

Drug- or chemical-induced hyperglycemia

1.     Vacor

2.     Pentamidine

3.     Nicotinic acid

4.     Glucocorticoids

5.     Diazoxide

6.     Check point inhibitors

7.     Dilantin

8.     Interferon alpha

9.     Immune suppressants

10.  Others (statins, psychotropic drugs, b-Adrenergic agonists, thiazides, etc.)

Infections

1.     Congenital rubella

2.     HCV

3.     HIV

COVID-19

Immune-mediated diabetes

1.     Stiff-man syndrome

2.     Anti-insulin receptor antibodies

3.     Autoimmune polyglandular syndromes

Diabetes of unknown cause

1.     Ketosis-prone diabetes (Flatbush diabetes)

Other genetic syndromes sometimes associated with diabetes

1.     Down syndrome

2.     Klinefelter syndrome

3.     Turner syndrome

4.     Wilsons syndrome

5.     Wolfram syndrome

6.     Friedreich ataxia

7.     Bardet-Biedl syndrome (Laurence-Moon-Biedl syndrome)

8.     Myotonic dystrophy

9.     Prader-Willi syndrome

10.  Alström syndrome


MATERNALLY INHERITED DIABETES MELLITUS AND DEAFNESS (MIDD)


Maternally inherited diabetes mellitus and deafness is a mitochondrial disorder characterized by diabetes and progressive sensorineuronal hearing loss (8,9). Mitochondrial DNA is only transmitted from the mother as the sperm lacks mitochondrial DNA (8). Therefore, over 50% of affected individuals with MIDD have a mother with diabetes.  A mother with this disorder transmits the mutation to almost all of her offspring (10). However, the proportion of somatic cells with the mutation can vary considerably, a condition called heteroplasmy (9). The higher the number of somatic cells with a mutation the greater is the penetrance of symptoms and disease severity. Additionally, the proportion of somatic cells with a mutation can vary from tissue to tissue and explains the variability in the manifestations of this disorder (9). The prevalence of mitochondrial diabetes in the diabetes population depends on ethnic background and ranges between 0.2% and 2%, with the highest prevalence in Japan (10).


MIDD is associated with a point mutation in a transfer ribonucleic acid (tRNA) gene at position 3243 with an A to G transition (8,9). In addition to diabetes and auditory impairment, the m.3243A>G mutation can cause other clinical manifestations including central neurological and psychiatric disorders, eye disease, myopathy, cardiac disorders, renal disease, endocrine disease, and gastrointestinal disease (8,9). Other point mutations in mitochondrial DNA can also result in diabetes and deafness but these mutations are rare in comparison to m.3243A>G (8-10).


It is thought that defects in mitochondrial function result in the decreased production of ATP following glucose uptake by beta cells resulting in decreased insulin secretion in response to elevated glucose levels (8,9). Additionally, mitochondrial dysfunction in the highly metabolically active pancreatic islets ultimately results in the loss of B‐cell mass further compromising insulin secretion (9). Insulin sensitivity is usually normal (10). Other tissues that are metabolically active may also be adversely effected by the inability of the mitochondria to produce ATP including the cells in the cochlea (9).


The clinical syndrome of MIDD can phenotypically resemble either T1D or T2D (9,10). The age of onset varies between childhood and mid-adulthood. Approximately 20% of patients present acutely with high glucose levels and even ketoacidosis (9). Most patients do not have islet cell antibodies but they are present in a small number of patients (9). This could be due to concomitant T1D or to the development of antibodies secondary to beta cell destruction due to mitochondria dysfunction. Patients tend to be thin rather than obese (9). This disorder can be distinguished from MODY by the presence of multi-organ involvement, particularly sensorineural hearing loss, and maternal rather than autosomal dominant transmission. Initially patients may be treated with diet and/or oral agents but overtime most patients with MIDD progress to requiring insulin therapy (8-10).


As the name implies this disorder is recognized by the presence of diabetes and deafness and a family history of these conditions in maternal relatives (9,10). Hearing loss is present in approximately 75% of patients and typically precedes the development of diabetes (9). Hearing loss is more common and severe in males (9). Approximately 10-15% of patients, in addition to having diabetes and deafness, also have the syndrome of mitochondrial encephalomyopathy, lactic acidosis, and stroke‐like episodes (9). The m.3243A>G mutation can cause a wide spectrum of abnormalities that include neurological abnormalities (strokes, dementia, seizures), psychiatric disorders including recurrent major depression, schizophrenia and a variety of phobias, macular retinal dystrophy with pigmentation, proximal myopathy, cardiomyopathy, renal failure, short stature, endocrine dysfunction, and gastrointestinal complaints (9). The finding of classical retinal dystrophy and hyperpigmentation on routine eye exam should suggest the diagnosis of maternally inherited diabetes mellitus and deafness. Once suspected the diagnosis of MIDD should be confirmed by genetic testing for the mitochondrial DNA point mutation at position 3243 (A>G). This is usually initially carried out on blood cells but if negative urinary cells or skeletal muscle can be tested and if necessary one can test for other mutations that cause similar phenotypes (11). Once a diagnosis is confirmed first-degree family members at risk should be screened for the mutation and provided with genetic counseling. For those carrying the mutation without clinical manifestations, screening for diabetes and monitoring of kidney function, hearing, and cardiac function should be carried out.


GENETIC DEFECTS IN INSULIN ACTION


Overview of Insulin Receptor Defects


Mutations in the insulin receptor can cause different degrees of insulin resistance but do not need to be associated with diabetes per se (12). A large number of different mutations have been described and they can be classified as mutations that prevent synthesis of the receptor, inhibit transport of the receptor to the plasma membrane, decrease insulin binding to the receptor, impair transmembrane signaling, or increase receptor degradation (13). Pancreatic beta cell hyperplasia and hyperinsulinemia can compensate for the insulin resistance preventing hyperglycemia. Fasting hypoglycemia and postprandial hyperglycemia may be observed. Overtime the beta cells’ ability to secrete insulin diminishes and frank diabetes usually develops. Treatment of the diabetes may require very high doses of insulin (14). Unfortunately, insulin sensitizers have not been very effective in patients with insulin receptor defects. In contrast to the typical patients with insulin resistance, obesity, dyslipidemia, hypertension, and fatty liver are not usually present (14,15). Acanthosis nigricans, pigmentation in the neck or axillae, is a visible sign of severe insulin resistance (12,14). In females, severe insulin resistance is usually associated with hyperandrogenism, oligomenorrhea or amenorrhea, anovulation, hirsutism, acne, and masculinization (12,14). It is hypothesized that the ovarian dysfunction and acanthosis nigricans is due to high levels of insulin acting via the IGF1 receptors (15). The amount of residual insulin receptor function determines the specific syndrome in patients with insulin receptor mutations (Figure 1).

Figure 1. Insulin Receptor Mutation Syndromes (Modified from reference (12)). Severe disorders are usually homozygous or compound heterozygous mutations while milder forms are often heterozygotes.

Type A Insulin Resistance


This autosomal dominant disorder includes patients with severe insulin resistance and acanthosis nigricans (12,14). Patients have normal growth and females show ovarian hyperandrogenism that typically presents in the peripubertal period (14). In females, hyperglycemia develops after ovarian hyperandrogenism and acanthosis nigricans. Males display only acanthosis nigricans and they often remain undiagnosed even after the development of symptomatic diabetes, which may not occur until the patients are adults. These patients have mutations in the insulin receptor gene that decreases the activity of the insulin receptor (13,14). In addition, mutations in transcription factors that stimulate the expression of insulin receptors can lead to a similar phenotype as mutations in the insulin receptor (10). Inherited defects in pathways downstream of the insulin receptor can also lead to clinical abnormalities similar to mutations in the insulin receptor (10,11).


Donohue Syndrome (Leprechaunism)


Donohue syndrome is a rare congenital, autosomal recessive syndrome characterized by very severe insulin resistance due to mutations in the insulin receptor gene, dysmorphic features such as protuberant and low-set ears, flaring nostrils and thick lips, growth retardation, failure to thrive, and early death (13). The name leprechaunism relates to the elfin features of those affected. Clinical features include in addition to acanthosis nigricans, hypertrichosis, hirsutism, dysmorphic facies, breast enlargement, abdominal distension, and lipoatrophy. Patients have extremely high levels of insulin and can develop impaired glucose tolerance or overt diabetes. The prognosis for infants with this condition is very poor and most will die in the first year of life. When parents, who are heterozygous for mutations in the insulin receptor are studied, many of these individuals are insulin resistant (13).


Rabson-Mendenhall Syndrome


The Rabson-Mendenhall syndrome represents another disorder of extreme insulin resistance (14). This autosomal recessive syndrome is associated with mutations in the insulin receptor gene (12). Initially fasting hypoglycemia, postprandial hyperglycemia, and marked hyperinsulinemia may be observed (12). When beta-cells decompensate, hyperglycemia may become very difficult to treat. Clinical features include in addition to acanthosis nigricans, phallic enlargement, precocious pseudopuberty, short stature, and abnormal teeth, hair and nails (13,14). Hyperplasia of the pineal gland is an unusual feature (13). Prognosis is poor as diabetes is difficult to control even with high insulin doses (13). Hyperglycemia leads to microvascular disease and/or diabetic ketoacidosis resulting in death in the second and third decades of life (12). Leptin administration has resulted in an improvement in this syndrome (16,17).


DISEASES OF THE EXOCRINE PANCREAS


Diseases that destroy the pancreas can cause DM even in individuals who do not have risk factors for diabetes (18). In the medical literature this is often referred to as Type 3C diabetes. Acquired causes of damage to the pancreas include pancreatitis, trauma, infection, pancreatic carcinoma, and pancreatectomy. Inherited disorders that affect the endocrine pancreas, such as hemochromatosis, thalassemia, and cystic fibrosis, can also cause insulin deficiency and diabetes. The distribution of causes for diabetes secondary to pancreatic disorders in one study was chronic pancreatitis (79%), pancreatic ductal adenocarcinoma (8%), hemochromatosis (7%), cystic fibrosis (4%), and previous pancreatic surgery (2%) (19). The prevalence of diabetes secondary to pancreatic disease is estimated to range from 1% to 9% and likely will depend on the patient population studied (20). In a population study carried out in New Zealand the prevalence of diabetes secondary to pancreatic disorders was close to that of T1D (21).


Pancreatitis


Pancreatitis may lead to the destruction of the beta cells due to inflammation and irreversible fibrotic damage  (22). In addition to destroying the beta cells, pancreatitis also leads to the destruction of glucagon secreting alpha-cells and pancreatic polypeptide secreting cells (22). The decrease in insulin secretion is the primary mechanism leading to hyperglycemia. In addition, the decrease in secretion of pancreatic polypeptide leads to a decrease in hepatic insulin sensitivity resulting in increased hepatic glucose production (23). Nutrient malabsorption that occurs secondary to pancreatitis leads to impaired incretin secretion that can result in diminished insulin release by the remaining beta-cells (24). Acute pancreatitis can induce transient hyperglycemia that can last for several weeks or permanent hyperglycemia (20,25,26). Predictors of the development of diabetes include obesity, a family history of diabetes, exocrine pancreatic insufficiency, history of pancreatic surgery, pancreatic calcifications, and long duration of pancreatitis (27).


The prevalence of diabetes secondary to pancreatitis varies greatly with studies in North America estimating a prevalence of 0.5%-1.15% whereas in Southeast Asia, where tropical or fibrocalcific pancreatitis is endemic, a prevalence of approximately 15%-20% has been reported (22) (see chapter in Tropical Endocrinology Section of Endotext entitled “Fibrocalculous Pancreatic Diabetes” for an in depth discussion of this entity (7). Recently, data from the UK Royal College of General Practitioners Research and Surveillance Centre found 559 cases of diabetes following pancreatic disease in 31,789 cases of adults newly diagnosed with diabetes (1.8%) (28). Most cases of diabetes following pancreatic disease were classified as T2D (28). In another study approximately 50% of the patients with diabetes secondary to pancreatitis were not recognized and were incorrectly thought to have T2D (5). It is very likely that many cases of diabetes secondary to pancreatitis are not recognized to be due to pancreatic disease.


The prevalence of diabetes in patients with diagnosed pancreatitis has ranged between 26-80%, depending on the cohort and duration of follow up (20,22,29). The prevalence of diabetes increases with the duration of pancreatitis and early onset of calcific disease (22). Because of the high risk of diabetes in patients with pancreatitis these patients should be periodically screened for the presence of diabetes with measurement of fasting glucose and/or A1c levels.


At times it can be difficult to distinguish diabetes secondary to pancreatitis from T1D or T2D. The following diagnostic criteria have been proposed (Table 2) (22).


Table 2. Proposed Diagnostic Criteria for Diabetes Secondary to Pancreatitis

Major Criteria (must be present)

Presence of exocrine pancreatic insufficiency (monoclonal fecal elastase-1 test or direct function tests)    

Pathological pancreatic imaging (endoscopic ultrasound, MRI, CT)    

Absence of T1D associated autoimmune markers

Minor Criteria

Absent pancreatic polypeptide secretion    

Impaired incretin secretion (e.g., GLP-1)    

No excessive insulin resistance (e.g., HOMA-IR)    

Impaired beta cell function (e.g., HOMA-B, C-Peptide/glucose-ratio)    

Low serum levels of lipid soluble vitamins (A, D, E and K)


It should be recognized that these proposed criteria have not been rigorously tested nor are all criteria available in routine clinical practice. In addition, there are a number of key considerations. First, long-standing T1D and T2D are associated with exocrine pancreatic failure (30). It has been estimated that 26% to 74% of patients with T1D and 28% to 36% of patients with T2D have evidence of exocrine pancreatic insufficiency (18). Second, patients with diabetes are at a higher risk for developing acute and/or chronic pancreatitis (31). Lastly, patients with previous episodes of pancreatitis may also develop T1D or T2D independently of their exocrine pancreatic disease. When diabetes occurs in patients with a pre-existing diagnosis of chronic pancreatitis it is likely that the pancreatitis is an important contributor to the development of the diabetes.


Testing for T1D associated autoimmune markers can be helpful in separating T1D from diabetes secondary to pancreatic disease. The presence of islet cell antibodies supports the diagnosis of T1D. The pancreatic polypeptide response to insulin-induced hypoglycemia, secretin-infusion, or a mixed nutrient ingestion can be helpful in separating T2D from diabetes secondary to pancreatic disease. Patients with diabetes secondary to pancreatitis have an absent or reduced pancreatic polypeptide response while patients with T2D have an elevated pancreatic polypeptide response (22,29). Studies have shown that pancreatic polypeptide regulates hepatic insulin sensitivity and the absence of pancreatic polypeptide leads to hepatic insulin resistance and enhances hepatic glucose production, which could contribute to the abnormal glucose metabolism that occurs with pancreatic disease (20).


In patients with diabetes secondary to pancreatitis hyperglycemia can be mild to very severe depending upon the degree of pancreatic destruction leading to impaired insulin production and secretion (18,20,22). Glycemic control may be unstable due to the loss of glucagon secretion in response to hypoglycemia, carbohydrate malabsorption, and inconsistent food intake due to pain and/or nausea secondary to pancreatitis (i.e., “brittle diabetes”) (18,20,22). Whether glycemic control is worse in patients with diabetes secondary to pancreatitis is uncertain as older studies reported worse glycemic control and more recent studies have reported that glycemic control was similar to other patients with diabetes (18). The ability to obtain good glycemic control is likely to be related to the degree of pancreatic insufficiency with patients with a total absence of pancreatic function being more difficult to control.


In patients with relatively mild diabetes treatment with metformin is indicated. The GI side effects (nausea, abdominal complaints, diarrhea) of metformin may not be tolerable in some patients with pancreatitis. In observational studies metformin therapy has been associated with a reduction in the development of pancreatic cancer in patients with diabetes (32). Given the increased risk of pancreatic cancer in patients with diabetes and/or pancreatitis a reduction in the development of pancreatic cancer would be a potential added benefit of metformin therapy (33-35). There are conflicting data on whether treatment with DPP4-inhibitors or GLP1-analogues can cause pancreatitis, but until this issue has been unequivocally settled, it is wise to refrain from using these drugs in patients who have had pancreatitis without a clear reversible etiology (for example, gallstone pancreatitis status post cholecystectomy). Thiazolidinediones should probably be avoided as patients with pancreatitis and malabsorption are at increased risk for osteoporosis and thiazolidinediones may potentiate this problem.


Chronic pancreatitis is a progressive disease and therefore it is likely that glycemic control will worsen overtime and most patients will eventually require insulin therapy (22). Many patients will have severe insulin deficiency and will need to be treated with insulin therapy using regimens employed in patients with T1D. Because of the absence of glucagon secretion patients with diabetes secondary to pancreatitis are more susceptible to severe hypoglycemia with insulin therapy but diabetic ketoacidosis is not commonly observed due to the absence of glucagon.


Patients with diabetes secondary to pancreatitis are at risk for microvascular complications and lower extremity arterial disease and therefore routine testing for eye disease, kidney disease, foot ulcers, and neuropathy should be instituted (36-39).


Finally, it should be recognized that patients with diabetes secondary to pancreatitis will almost always have exocrine pancreatic insufficiency (29). Many patients with chronic pancreatitis manifest fat malabsorption without symptoms and therefore a thorough evaluation is required. Oral pancreatic enzyme replacement is beneficial in these patients. Of note, pancreatic enzyme supplementation can improve incretin secretion and thereby may benefit glycemic control (20,24,40). Fat soluble vitamin deficiency commonly occurs (Vitamin A, D, and K) and many patients will require supplementation with fat-soluble vitamins.


Pancreatectomy


The metabolic abnormalities that occur after pancreatic surgery depend on the amount and area of the pancreas removed and whether the remaining pancreas is normal or diseased (23). The basis for this variability is due to the distribution of β and non-β islet cell types in the pancreas. Islet density is relatively low in the head of the pancreas and gradually increases through the body toward the tail region by greater than 2-fold and thus α- and β-cells predominate in the tail. In contrast, the cells that secrete pancreatic polypeptide are mainly localized in the head of the pancreas. Distal pancreatectomy usually causes little change in the metabolic status unless more than 50% of parenchyma is excised in patients with diffuse disease or more than 80% in patients with normal pancreatic function (23). Approximately 4.8 to 38% of patients develop diabetes after a distal pancreatectomy (23). Resection of the head of the pancreas results in a decrease in pancreatic polypeptide, hepatic insulin resistance, and fasting hyperglycemia. Approximately 20% of patients develop diabetes after resection of the head of the pancreas (23). It should also be recognized that removal of pancreatic tissue can accelerate the development of T2D by decreasing insulin secretion in patients with impaired glucose metabolism (41).


Patients who have undergone total surgical pancreatectomy have a deficiency of insulin, glucagon, and pancreatic polypeptide and require insulin treatment. In general, there are several differences from typical T1D, including exocrine deficiency, low insulin requirements, and a higher risk of hypoglycemia due to the decrease in glucagon, which stimulates hepatic glucose production (glycogenolysis and gluconeogenesis). Pancreatectomized patients are prone to hypoglycemia and a delayed recovery from hypoglycemia. In an evaluation of 180 patients post pancreatectomy 42% experienced one or more hypoglycemic events on a monthly basis (42). In addition to treatment with insulin, pancreatic enzyme supplements are always needed. Intraportal islet auto transplantation has been used to prevent the development of diabetes with total pancreatectomy and/or reduce the risk of developing difficult to control diabetes (43-45).


Pancreatic Cancer


A high percentage of patients with pancreatic carcinoma have diabetes (20,46). In one study 68% of patients with pancreatic cancer also had diabetes (47). The prevalence of diabetes in patients with pancreatic cancer is much higher than in other common malignancies (46,47). In patients with pancreatic cancer who also have diabetes, the diagnosis of diabetes occurred less than 2 years prior to the diagnosis of pancreatic cancer in 74% of patients (48). In a population-based study 0.85% of patients over the age of 50 years with newly diagnosed diabetes were diagnosed with pancreatic cancer within 3 years (49). In a study of 115 patients over 50 years of age who were hospitalized for new-onset diabetes 5.6% were found to have a pancreatic cancer (50). Many patients with pancreatic cancer lose weight and therefore deteriorating glycemic control in conjunction with weight loss and anorexia should raise the possibility of an occult pancreatic cancer (46,51). Other clues to the presence of pancreatic cancer in a patient with new onset diabetes are the lack of a family history of diabetes, a BMI < 25, and the absence of features of the metabolic syndrome such as dyslipidemia and hypertension. Given the high incidence of diabetes relative to the incidence of pancreatic cancer the routine screening of all patients who develop diabetes is not cost effective. However, in selected patients with the features described above screening is appropriate.


Conversely, long standing T2D increases the risk of developing pancreatic cancer by approximately 1.5 to 2-fold indicating a bidirectional relationship (23,46,52). This risk may persist even after adjustment for obesity and smoking, risk factors for pancreatic cancer. Diabetes is both a risk factor for the development of pancreatic cancer and a complication of pancreatic cancer.


As discussed above diabetes may develop secondary to chronic pancreatitis. Chronic pancreatitis increases the risk of pancreatic cancer. Thus, patients with diabetes secondary to chronic pancreatitis are at a higher risk of developing pancreatic cancer (53).  


The strongest evidence linking pancreatic cancer with incident diabetes is the beneficial effects of cancer resection on glycemic control (46). In a small study in 7 patients, Permert and colleagues reported an improvement in diabetes status and glucose metabolism after subtotal pancreatectomy (54). Similarly, Pannala and colleagues in a larger study reported that after pancreaticoduodenectomy, diabetes resolved in 17 of 30 patients (57%) with new-onset diabetes but was unaffected in patients with longstanding diabetes (48). Litwin and colleagues noted similar improvements in glucose metabolism after surgery in patients with pancreatic cancer but a deterioration in patients with chronic pancreatitis (55). Finally, studies have also shown that a good response to chemotherapy in patients with pancreatic cancer can also improve glucose levels (56). Taken together these results demonstrate a benefit from tumor removal and suggest that new-onset diabetes associated with pancreatic cancer may be a paraneoplastic phenomenon.


The mechanism accounting for the development of new onset diabetes by pancreatic cancers is unknown (46). In contrast to other pancreatic disorders the etiology of diabetes is not due to destruction of the pancreas as patients with new onset diabetes and pancreatic cancer have hyperinsulinemia rather than low insulin levels and as noted above the diabetes improves after resection (20). Additionally, the pancreatic cancers may be very small and thus unlikely to cause pancreatic insufficiency. Pancreatic cancer is associated with insulin resistance but the factors leading to insulin resistance are unknown (20).


In patients with pancreatic cancer the main goal of the treatment of diabetes is to prevent the short- term metabolic complications and facilitate the ability of the patient to tolerate treatment of the pancreatic cancer (surgery and chemotherapy). Given the poor survival of patients with pancreatic cancer prevention of the long-term sequelae of diabetes is not a major focus. Metformin is a preferred hypoglycemic agent because there are observational studies suggesting that metformin may improve survival in patients with pancreatic cancer (57-59). However, randomized trials have failed to demonstrate a benefit of metformin therapy in patients with pancreatic cancer (60,61).


Hemochromatosis


Hemochromatosis is an autosomal recessive disorder characterized by increased iron absorption by the GI tract and increased total body iron stores (62). The excess iron is sequestered in many different tissues including the liver, skin, heart, and the pancreas. The classic triad of hemochromatosis is diabetes mellitus, hepatomegaly, and increased skin pigmentation (“bronze diabetes”), but clinical features also include gonadal failure, arthropathy, and cardiomyopathy (62).


In early studies diabetes was present in over 50% of patients with hemochromatosis (63,64). More recently the prevalence of diabetes in patients with hemochromatosis has decreased to approximately 20% of patients, presumably due to the early diagnosis and treatment of hemochromatosis due to genetic testing (63-66). In patients with hemochromatosis screening for the presence of diabetes should be periodically carried out.


Diabetes was typically observed in persons who also had severe iron overload and cirrhosis (64). In recent studies with lower rates of diabetes impaired glucose tolerance was observed in approximately 30% of patients with hemochromatosis (63,66). It should be noted that iron overload from any cause can result in diabetes (67). For example, patients with thalassemia develop iron overload due to the need for frequent transfusions (68,69). The prevalence of diabetes in patients with thalassemia has been declining since the more aggressive and widespread use of iron chelation therapy (69).


There are two abnormalities that lead to abnormal glucose metabolism in patients with hemochromatosis and iron overload (63). First, iron overload leads to beta cell damage with decreased insulin production and secretion. Pathologic examination revealed hemosiderin deposition and iron-induced fibrosis of the islets (64). The decrease in insulin secretion is the primary defect leading to the development of diabetes (63,64,66). Of note glucagon secretion does not appear to be deficient in patients with diabetes and hemochromatosis suggesting that the iron overload has a preferential toxicity for beta cells compared to alpha cells (64,70,71). Similarly, basal and stimulated pancreatic polypeptide levels are also not decreased in diabetic patients with hemochromatosis (72). Thus, the hormonal abnormalities differ in patients with iron overload induced diabetes compared to patients with pancreatitis induced diabetes. The second abnormality is insulin resistance that occurs due to iron overload hepatic damage and/or secondary to obesity (63,64). In addition, a genetic predisposition to diabetes potentiates the development of metabolic dysfunction. Many patients with hemochromatosis and diabetes have a relative with diabetes (73).


The typical micro and macrovascular complications of diabetes occur in patients with hemochromatosis (64,73). In a study by Griffiths and colleagues, 11 of 49 patients with hemochromatosis and diabetes had diabetic retinopathy (74). Sixty percent of the patients with hemochromatosis who had diabetes for greater than 10 years had retinopathy. The incidence of retinopathy is similar to that observed in the general diabetes population (73,74). Similarly, Becker and Miller observed that 7 of 22 patients with diabetes and hemochromatosis had pathologic evidence of diabetic glomerulopathy (75).


The treatment of hemochromatosis by phlebotomy has a variable impact on glucose metabolism (63). In patients who do not yet have complications or organ damage an improvement of insulin secretory capacity and normalization of glucose tolerance has been observed (63,64). Glucose metabolism often improves in patients with impaired glucose tolerance (63,76). In patients with diabetes improvement in glucose metabolism by phlebotomy may occur but is not as common as in “pre-diabetics” (63,76,77). In one study 28% of patients with diabetes and hemochromatosis on insulin or oral agents showed improved glucose control following phlebotomy therapy (78).


Cystic Fibrosis


Cystic Fibrosis is an autosomal recessive disorder due to a defect in the chloride transport channel (79). Cystic fibrosis related diabetes is rare in children but is present in approximately 20% of adolescents and 40-50% of adults with cystic fibrosis (80,81). As patients with cystic fibrosis live longer it is likely that the number of patients with cystic fibrosis and diabetes will increase. The development of diabetes is associated with more severe cystic fibrosis gene mutations, increasing age, worse pulmonary function, undernutrition, liver dysfunction, pancreatic insufficiency, a family history of diabetes, female gender, and corticosteroid use (80,81).


The primary defect in patients with cystic fibrosis related diabetes is decreased insulin production and secretion due to fibrosis and atrophy of the pancreas with a reduction of islet mass (80). In addition, mutations in the cystic fibrosis transmembrane conductance regulator gene may have direct effects on the ability of beta cells to secrete insulin (81,82). Beta cell dysfunction is not complete with residual insulin secretion and thus patients with cystic fibrosis related diabetes do not typically develop ketosis (80). Reduced alpha cell mass also occurs so while fasting glucagon levels are normal, glucagon secretion in response to hypoglycemia is impaired (80). Peripheral and hepatic insulin resistance may also occur secondary to infections and inflammation (81).


Some of the clinical features of cystic fibrosis related diabetes are similar to T1D as patients are young, not obese, insulin deficiency is the primary defect, and features of the metabolic syndrome (hyperlipidemia, hypertension, visceral adiposity) are not usually present (80). However, cystic fibrosis related diabetes is not an autoimmune disease (islet cell antibodies are not present) and ketosis is rare because endogenous insulin is still produced (80). Fasting glucose levels are often normal initially with elevated postprandial glucose levels due to a reduced and delayed insulin response to carbohydrates while basal insulin is often adequate to maintain normal glucose levels (83). Patients with cystic fibrosis related diabetes are not at high risk to develop atherosclerosis and heart disease is not a major issue (80-82). This is likely due to malabsorption leading to life-long low plasma cholesterol levels and the shortened length of life (80,81). As life expectancy increases the risk of macrovascular disease may increase. Microvascular complications do occur in cystic fibrosis related diabetes and are related to the duration of diabetes and glycemic control (80,81,83). The American Diabetes Association recommends screening for complications of diabetes beginning 5 years after the diagnosis of cystic fibrosis related diabetes (84)


Lung disease is a major cause of morbidity and mortality in patients with cystic fibrosis and both insulin insufficiency and hyperglycemia negatively affect cystic fibrosis lung disease (85). Numerous studies have shown that the occurrence of diabetes in patients with cystic fibrosis is associated with more severe lung disease and increased mortality and this adverse effect disproportionately affects women (80,83,85). In patients with cystic fibrosis lung function is critically dependent on maintaining normal weight and lean body mass. Insulin deficiency leads to a catabolic state with the loss of protein and fat (80). Multiple studies have shown that insulin replacement therapy improves nutritional status and pulmonary function in patients with cystic fibrosis related diabetes (80). In addition, elevated blood glucose levels result in elevated blood glucose levels in the airways, which promotes the growth of pathogenic microorganisms and increase pulmonary infections (80,83). Of note recent studies have shown that the marked increase in mortality in patients with cystic fibrosis related diabetes compared to patients with cystic fibrosis only has diminished (86). It is likely that early diagnosis and aggressive treatment has improved survival in patients with cystic fibrosis related diabetes.


Because of the adverse effects of diabetes on lung function in patients with cystic fibrosis routine screening for diabetes is recommended (85). It is recommended that annual screening begin at age 10 (85). While fasting glucose and A1c levels are routine screening tests for diabetes, in patients with cystic fibrosis these tests are not sensitive enough (85). Fasting glucose and A1c testing will fail to diagnose approximately 50% of patients with cystic fibrosis related diabetes (82,85). However, recent studies have suggested that a screening A1c >5.5% would detect more than 90% of patients with diabetes and therefore with further confirming studies measuring A1c levels could become an initial screening approach (84).  As noted above, abnormalities in postprandial glucose characterizes cystic fibrosis related diabetes and it is therefore recommended that an oral glucose tolerance test (OGTT) be utilized for the diagnosis of diabetes in patients with cystic fibrosis (85). Studies have shown that the diagnosis of diabetes by OGTT correlates with clinically important cystic fibrosis outcomes including the rate of lung function decline, the risk of microvascular complications, and the risk of early death (85). Moreover, the OGTT identified patients who benefited from insulin therapy (85). Additional screening recommendations are shown in Table 3 and the interpretation of these tests are shown in Table 4.


Table 3. ADA and Cystic Fibrosis Foundation Recommendations for Screening for Cystic Fibrosis Related Diabetes (CFRD) (85)

1.     1) The use of A1C as a screening test for CFRD is not recommended.

2.     2) Screening for CFRD should be performed using a 2-h 75-g OGTT. 

3.     3) Annual screening for CFRD should begin by age 10 years in all CF patients who do not have CFRD.

4.     4) CF patients with acute pulmonary exacerbation requiring intravenous antibiotics and/or systemic glucocorticoids should be screened for CFRD by monitoring fasting and 2-h postprandial plasma glucose levels for the first 48 h. If elevated blood glucose levels are found by SMBG, the results must be confirmed by a certified laboratory.

5.     5) Screening for CFRD by measuring mid- and immediate post-feeding plasma glucose levels is recommended for CF patients on continuous enteral feedings, at the time of gastrostomy feeding initiation and then monthly by SMBG. Elevated glucose levels detected by SMBG must be confirmed by a certified laboratory.

6.     6) Women with CF who are planning a pregnancy or confirmed pregnant should be screened for preexisting CFRD with a 2-h 75-g fasting OGTT if they have not had a normal CFRD screen in the last 6 months. 

7.     7) Screening for gestational diabetes mellitus is recommended at both 12–16 weeks’ and 24–28 weeks’ gestation in pregnant women with CF not known to have CFRD, using a 2-h 75-g OGTT with blood glucose measures at 0, 1, and 2 h. 

8.     8) Screening for CFRD using a 2-h 75-g fasting OGTT is recommended 6–12 weeks after the end of the pregnancy in women with gestational diabetes mellitus (diabetes first diagnosed during pregnancy). 

9.     9) CF patients not known to have diabetes who are undergoing any transplantation procedure should be screened preoperatively by OGTT if they have not had CFRD screening in the last 6 months. Plasma glucose levels should be monitored closely in the perioperative critical care period and until hospital discharge. Screening guidelines for patients who do not meet diagnostic criteria for CFRD at the time of hospital discharge are the same as for other CF patients.

CF= cystic fibrosis; CRFD= cystic fibrosis related diabetes; OGTT= oral glucose tolerance test, SMBG= self-monitored blood glucose


Table 4. Criteria for the Diagnosis of Cystic Fibrosis Related Diabetes (85)

1.     1) During a period of stable baseline health the diagnosis of CFRD can be made in CF patients according to standard ADA criteria. Testing should be done on 2 separate days to rule out laboratory error unless there are unequivocal symptoms of hyperglycemia (polyuria and polydipsia); a positive FPG or A1C can be used as a confirmatory test, but if it is normal the OGTT should be performed or repeated. If the diagnosis of diabetes is not confirmed, the patient resumes routine annual testing.

·       2-h OGTT plasma glucose >200 mg/dl (11.1 mmol/l)

·       FPG >126 mg/dl (7.0 mmol/l)

·       A1C > 6.5% (A1C <6.5% does not rule out CFRD because this value is often spuriously low in CF.)

·       Classical symptoms of diabetes (polyuria and polydipsia) in the presence of a casual glucose level >200 mg/dl (11.1 mmol/l)

2.     2) The diagnosis of CFRD can be made in CF patients with acute illness (intravenous antibiotics in the hospital or at home, systemic glucocorticoid therapy) when FPG levels >126 mg/dl (7.0 mmol/l) or 2-h postprandial plasma glucose levels >200 mg/dl (11.1 mmol/ l) persist for more than 48 h.

3.     3) The diagnosis of CFRD can be made in CF patients on enteral continuous drip feedings when mid- or post=feeding plasma glucose levels exceed 200 mg/dl (11.1 mmol/l) on 2 separate days.

4.     4) Diagnosis of gestational diabetes mellitus is diagnosed based on 0-, 1-, and 2-h glucose levels with a 75-g OGTT if any one of the following is present:

·       FPG >92 mg/dl (5.1 mmol/l)

·       1-h plasma glucose >180 mg/dl (10.0 mmol/l)

·       2-h plasma glucose >153 mg/dl (8.5 mmol/l)

5.     CF patients with gestational diabetes mellitus are not considered to have CFRD, but require CFRD screening 6–12 weeks after the end of the pregnancy.

6.     5) The onset of CFRD should be defined as the date a person with CF first meets diagnostic criteria, even if hyperglycemia subsequently abates.

CF= cystic fibrosis; CRFD= cystic fibrosis related diabetes; OGTT= oral glucose tolerance test


There is evidence that elevations in glucose below the levels typically used to diagnose diabetes result in adverse effects on the lungs (83). Thus, some experts recommend that treatment should be considered for individuals with abnormal glucose levels which do not meet the criteria for diabetes if there is evidence of declining lung function or weight loss (83).


A unique feature in the treatment of patients with cystic fibrosis related diabetes is that insulin is the treatment of choice in all patients (85). Studies have shown that cystic fibrosis patients on insulin therapy who achieve good glycemic control demonstrate improvement in weight, protein anabolism, pulmonary function, and survival (85). No specific insulin treatment regimen is recommended and the regimen should be individualized for the patient. For example, a patient with elevated postprandial glucose levels will benefit from meal time rapid acting insulin. It should be noted that patients with cystic fibrosis induced diabetes still have endogenous insulin production, which allows for the achievement of good glycemic control. Oral diabetes agents are not as effective as insulin in improving nutritional and metabolic outcomes and therefore are not recommended (85). For most patients with cystic fibrosis related diabetes an A1c < 7% is recommended but the A1c goal can be higher or lower for certain patients based on clinical judgement. Also of note is that cystic fibrosis patients require a high-calorie, high-salt, high-fat diet.


Ivacaftor, a cystic fibrosis transmembrane conductance regulator modulator, is a relatively new agent to treat cystic fibrosis and has been shown to partially reverse the disease. Interestingly in case reports ivacaftor has been shown to markedly improve glycemic control (81,87). In a recent retrospective observation study approximately 1/3 of patients with CFRD had either a resolution of their diabetes or marked improvement with ivacaftor therapy (88). Additionally, the risk of developing CFRD is decreased in patients treated with ivacaftor (89). This beneficial effect is likely due to an improvement in insulin secretion (81,90).


INFECTIONS


Viral Infections


Viral infections, particularly enterovirus and herpes virus infections, have been postulated to play a role in triggering the autoimmune reaction that leads to the development of T1D (91-93). This phenomenon is discussed in detail in the Endotext chapter on the pathogenesis of T1D and the Endotext chapter on changing the course of the disease in T1D (94,95). In rare instances a viral infection has been associated with the fulminant development of diabetes due to the destruction of beta cells (96).


Congenital Rubella


Congenital rubella infection has been shown to predispose to the development of T1D that usually presents before five years of age (97). It has been estimated that approximately 1-6% of individuals with the rubella syndrome will develop diabetes in childhood or adolescence (97,98). The mechanism for this association is unknown. In addition, studies have also shown that patients with congenital rubella also develop T2D (98). In one series 22% of individuals with congenital rubella developed diabetes later in life (98). Fortunately, with increased vaccinations, congenital rubella has become a disease of the past in developed countries.


Hepatitis C Virus (HCV)


Meta-analyses and large data base studies have demonstrated that HCV infection is associated with an increased risk of T2D (99-104). In a meta-analysis of 34 studies the risk of diabetes in patients with HCV infection was increased by approximately 70% (99). Moreover, HCV infection is associated with an increased risk of T2D independent of the severity of the associated liver disease (i.e. occurs in patients without liver disease) but the risk of T2D was higher in HCV patients with cirrhosis (100). As expected, the risk of diabetes is increased in HCV patients if the BMI is increased, there is a family history of diabetes, older age, more severe liver disease, and male sex. Conversely, the prevalence of HCV infection in patients with T2D is higher than in non-diabetic controls (100,104,105). In a meta-analysis of 22 studies with 78,051 individuals it was found that patients with T2D were at a higher risk of HCV infection than non-diabetic patients (OR = 3.50; CI = 2.54-4.82) (105). Finally, diabetes is a significant risk factor for the development of liver cirrhosis and hepatocellular carcinoma in HCV infected patients (104,106-109).


Given the increased risk of diabetes in HCV infected patients it seems prudent to routinely screen HCV positive patients for diabetes. Conversely, screening patients with diabetes for HCV infection seems reasonable given the availability of drugs that can effectively treat HCV infections.


Patients with diabetes and HCV infection are insulin resistant in the liver and peripheral tissues (104,109,110). Insulin resistance is present in HCV infection in the absence of significant liver dysfunction and prior to the development of diabetes (110). Treatment that reduces viral load decreases insulin resistance and the risk of developing diabetes in HCV (104,110,111). The insulin resistance in individuals with HCV infections may be due to inflammation induced by cytokines such as TNF-alpha or monocyte chemoattractant protein-1, released from HCV-induced liver inflammation (104,109). Additionally, HCV may directly activate the mTOR/S6K1 signaling pathway, inhibiting IRS-1 protein function and thereby down-regulating GLUT-4 and up-regulating the gluconeogenic enzyme phosphoenolpyruvate carboxykinase-2 (104,109).


Studies have shown that direct-acting antiviral agents that eradicate HCV infection are associated with improved glycemic control in patients with diabetes indicated by decreased A1c levels and decreased insulin use (109,112). Additionally, in a database study of anti-viral treatment for HCV infection, a decrease in end-stage renal disease, ischemic stroke, and acute coronary syndrome was reported (113). These beneficial results on key outcomes need to be confirmed in randomized trials (this may be impossible as withholding treatment of HCV is not appropriate). Treatment of diabetes with metformin or thiazolidinediones is preferred as studies have suggested that these drugs may lower the risk of hepatocellular carcinoma, liver-related death, or liver transplantation in patients infected with HCV (114,115).


COVID-19


Studies have shown that COVID-19 infections are associated with hyperglycemia and new onset diabetes (116). In a meta-analysis of 8 studies with a total of 3711 COVID-19

patients 492 cases of newly diagnosed diabetes were found (14.4%) (117). There are a number of possibilities that could explain this association (116):

  • The diabetes could be secondary to acute illness and stress induced hyperglycemia. Stress induced hyperglycemia has been observed after other acute conditions including other infections.
  • Pre-existing diabetes could be first recognized during a COVID-19 infection
  • SARS-CoV-2 virus could directly damage the beta cells leading to decreased insulin secretion and hyperglycemia.
  • SARS-CoV-2 virus could lead to pancreatitis indirectly effecting beta cell function
  • The strong immune response that is seen in COVID-19 infections (cytokine storm) could indirectly lead to beta cell dysfunction.
  • The use of high dose glucocorticoids in patients with severe COVID-19 could lead to hyperglycemia and diabetes.


Hopefully, future studies will better characterize the mechanisms leading to new onset diabetes in patients with COVID-19 infections and determine whether there is a unique mechanism for this association.


ENDOCRINOPATHIES


A number of endocrine disorders are associated with an increased occurrence of diabetes.  Increased levels of GH, glucocorticoids, catecholamines, glucagon cause insulin resistance and increased levels of catecholamines, somatostatin, and aldosterone (by producing hypokalemia) decrease insulin secretion and hence can adversely affect glucose homeostasis. The disturbance in glucose metabolism occurring secondary to endocrine disorders may vary from a moderate degree of glucose intolerance to overt diabetes with symptomatic hyperglycemia. Additionally, the endocrine disorders can worsen glycemic control in patients with pre-existing diabetes.


Acromegaly


This condition is caused by excessive production of growth hormone (GH) from the pituitary (118). The prevalence of DM in patients with acromegaly is between 10-40%; the prevalence of diabetes and glucose intolerance effects more than 50% of patients (118-120). As expected, there is an increased prevalence of diabetes mellitus with age, elevated BMI, a family history of diabetes, and longer duration of acromegaly (119). Diabetes may be present at the time of the diagnosis of acromegaly (121). Higher plasma IGF-1 concentrations correlate with an increased risk of diabetes suggesting that the biochemical severity of acromegaly influences the risk of developing abnormalities of glucose metabolism (122). Patients with acromegaly should be screened for abnormalities in glucose metabolism (120). The prevalence of acromegaly in patients with diabetes is unknown but is likely to be very low given that acromegaly is an uncommon disorder (60 per million) and diabetes is very common (118).


GH is a counter regulatory hormone to insulin and is secreted during hypoglycemia (123,124). In patients with acromegaly insulin resistance is the major abnormality leading to disturbances in glucose metabolism (119,121,125). The insulin resistance is driven primarily through GH induced lipolysis, which results in glucose-fatty acid substrate competition leading to decreased glucose utilization in muscle (119,121,125). Additionally, inhibition of post receptor signaling pathway of the insulin receptor also likely plays a role in the insulin resistance (125). Increased hepatic gluconeogenesis also contributes to the hyperglycemia (119,125). Lipolysis increases the delivery of glycerol and fatty acids to the liver, which serve as a substrate and energy source for gluconeogenesis. In some patients with acromegaly increased insulin secretion compensates for the insulin resistance and glucose metabolism remains normal (119). If insulin secretion cannot increase sufficiently to compensate for the insulin resistance glucose intolerance or diabetes develops (119).


Treatment is directed at the cause of the acromegaly (118). Successful surgical removal of the pituitary adenoma improves hyperglycemia and glucose metabolism has been reported to normalize in 23–58% of people with pre-operative diabetes after surgical cure of acromegaly (119-121). Lower IGF-1 and growth hormone levels post operatively correlate with remission of diabetes (126). A meta-analysis of 31 studies with 619 patients treated with somatostatin analogues for acromegaly reported a decrease in insulin levels and glucose levels during a glucose tolerance test but no change in fasting glucose or A1c levels (127). The absence of greater benefit in glucose homeostasis with somatostatin analogues could be secondary to somatostatin analogues inhibiting insulin secretion (118). Of note, while first generation somatostatin analogues appear to have mild or neutral effects on glucose metabolism in patients with acromegaly, treatment with pasireotide, a second-generation somatostatin analogue, aggravated glucose metabolism leading to the development of diabetes in some instances (128,129). The adverse effect of pasireotide is due to inhibiting insulin secretion and decreasing the incretin effect. There are little data on the impact of cabergoline on glucose homeostasis in patients with acromegaly but the available studies suggest that it modestly improves glucose metabolism (120). Studies have shown that bromocriptine can improve glucose homeostasis (119,120,130).  Finally, treatment with the growth hormone receptor antagonist, pegvisomant, has beneficial effects on glucose homeostasis (131,132).


The treatment of diabetes in patients with acromegaly is similar to the treatment in other patients with diabetes (119). Patients with acromegaly are often lean with low body fat and therefore dietary recommendations may need to be modified. Additionally, since insulin resistance is the primary defect in patients with acromegaly the use of insulin sensitizers may be especially effective but there are no studies comparing the efficacy of various hypoglycemic agents in patients with acromegaly (119). Data suggest that active acromegaly with elevated GH levels enhances the development of microvascular disease (121). The effect of acromegaly on the development of macrovascular disease is unclear (121). Ketoacidosis is uncommon in patients with diabetes and acromegaly.   


Cushing’s Syndrome


Cushing’s syndrome is due to elevated glucocorticoids that can be caused by the overproduction of ACTH by pituitary adenomas or ectopic ACTH producing tumors, overproduction of glucocorticoids by the adrenal glands due to adenomas or hyperplasia, or the exogenous administration of glucocorticoids (133). In patients with Cushing’s syndrome diabetes is present in 20-47% of the patients, while impaired glucose tolerance (IGT) is present in 21-64% of cases (134). Risk factors for the development of diabetes in patients with Cushing syndrome include age, obesity, and a family history of diabetes (134). The prevalence of diabetes varies depending on the etiology of Cushing’s syndrome (pituitary 33%, ectopic 74%, adrenal 34%) (135). In patients with endogenous Cushing’s syndrome the relationship of the degree of hypercortisolism and abnormalities in glucose metabolism has been inconsistent with some studies showing a correlation and other studies no relationship (136). For example, in one study, in patients with endogenous Cushing’s syndrome the prevalence of abnormalities in glucose metabolism and diabetes did not differ in patients with slightly elevated (not greater than 2x the upper limit of normal), moderately elevated (2-5X the ULN), and severely elevated (>5x the ULN) levels of urinary free cortisol (137). In patients with exogenous Cushing’s syndrome high doses of glucocorticoids and longer duration of treatment are more likely to cause diabetes (120,136). Elevated glucocorticoids are more likely to cause high glucose levels in the afternoon or evening and in the postprandial state (120). Hyperglycemia resulting from exogenous steroids occurs in concert with the time-action profile of the steroid regimen employed, such that once daily morning administration of an intermediate acting steroid (prednisone or methylprednisone) causes peak hyperglycemia within 12 hours (post-prandial) while long-acting or frequently administered steroids cause both fasting and postprandial hyperglycemia.


Patients with Cushing’s syndrome should be screened for the presence of abnormalities in glucose metabolism (136). It should be noted that fasting glucose levels are often normal with abnormalities present during an oral glucose tolerance test (134,136). Screening with A1c levels or with an oral glucose tolerance test are therefore preferred. The abnormalities in glucose metabolism may contribute to the increased risk of atherosclerosis in patients with Cushing’s syndrome.


The prevalence of Cushing’s syndrome in patients with diabetes is uncertain with studies reporting very different results ranging from 0 to 9% (136). The selection process used and the criteria used to determine the presence of Cushing’s syndrome likely greatly influences the results with studies that select patients with marked obesity, poor glycemic control, and poorly controlled hypertension finding a higher percentage of patients with diabetes having Cushing’s syndrome. A recent meta-analysis of 14 studies with a total of 2827 patients with T2D reported that 1.4% had Cushing’s syndrome based on biochemical analysis (138). In a multicenter study carried out in Italy between 2006 and 2008, 813 patients with known T2D without clinically overt hypercortisolism were evaluated for Cushing’s syndrome (139). After extensive evaluation 6 patients (0.7%) were diagnosed to have Cushing’s syndrome. Four patients had an adrenal adenoma and their diabetes was markedly improved with the disappearance of diabetes in three patients and discontinuation of insulin therapy in the remaining patient. One patient had bilateral macronodular adrenal hyperplasia and one patient had ACTH dependent Cushing’s syndrome with a normal pituitary MRI. In approximately 15-35% of patients with an incidental adrenal nodule mild autonomous cortisol secretion with T2D is present (140,141). After surgical removal of the adenoma in patients with autonomous cortisol secretion diabetes normalized or improved in 62.5% of patients (5 of 8) (142). However, not all studies have seen such dramatic improvements in diabetes after adenoma removal (143). Clearly additional studies (preferably large randomized trials) are required to better define the prevalence of mild subclinical Cushing’s syndrome in patients with diabetes and whether treating the subclinical Cushing’s syndrome in these patients will improve their glycemic control. For a detailed discussion of autonomous cortisol secretion see the chapter on Adrenal Incidentalomas in the Adrenal section of Endotext (144).


Currently, routinely screening patients with T2D for Cushing’s syndrome is not recommended (136). Nevertheless, clinicians should be aware of the possibility of Cushing’s syndrome and screen appropriate patients with T2D (young patients, negative family history of diabetes, patients with physical findings suggestive of Cushing’s syndrome, patients with difficult to control diabetes or hypertension) (136).    


Glucocorticoids function as a counter regulatory hormone to insulin and increase in response to hypoglycemia (145). Glucocorticoids disrupt glucose metabolism primarily by inducing insulin resistance in liver and muscle and by stimulating hepatic gluconeogenesis (134,136). The increase in hepatic gluconeogenesis is mediated by several mechanisms including a) directly stimulating the expression of gluconeogenic enzymes b) stimulating proteolysis and lipolysis leading to an increase delivery of amino acids, glycerol, and fatty acids to the liver that provides substrates and energy sources for gluconeogenesis c) inducing insulin resistance and d) enhancing the action of glucagon (134,136). The glucocorticoid induced increase in insulin resistance is due to inhibition of the post-receptor signaling pathway of the insulin receptor, which will result in a decrease in the uptake of glucose by skeletal muscle and adipose tissue (134). In addition to the above glucocorticoids can accelerate the degradation of Glut4 in beta cells, which impairs the ability of beta cells to secrete insulin in response to glucose (146).


Treatment of Cushing’s syndrome by removal of a pituitary tumor, an ectopic ACTH producing tumor, or an adrenal lesion result in a marked improvement in glucose metabolism and in many patients a remission of the diabetes (134,136). In patients with persistent Cushing’s syndrome drug therapy may be needed to normalize cortisol levels. Studies have shown that ketoconazole (200–1200 mg/day), metyrapone (250–4500 mg/day), mifepristone (300–2000 mg/day), or cabergoline (1-7mg/day) improves glucose metabolism in patients with Cushing’s syndrome (120,136).  In contrast, pasireotide has been shown to significantly worsen glucose tolerance, despite control of hypercortisolism, in patients with Cushing’s syndrome (120,136). In patients with exogenous Cushing’s syndrome it is important to use as low a dose as possible of glucocorticoids for the shortest period of time to avoid complications of therapy including disrupting glucose homeostasis (147).


The management of diabetes in patients with Cushing’s disease is similar to the treatment of other patients with diabetes (120). Since insulin resistance is a key defect in patients with Cushing’s syndrome the use of insulin sensitizers may be especially effective but there are no studies comparing the efficacy of various hypoglycemic agents in patients with Cushing’s syndrome (120). Pioglitazone and rosiglitazone can increase the risk of osteoporosis and it should be noted that patients with Cushing’s syndrome also have a high risk of osteoporosis. As noted above, postprandial glucose levels are preferentially increased in Cushing’s syndrome and therefore drugs that lower postprandial glucose levels, such as DPP4 inhibitors, GLP1 receptor agonists, alpha glucosidase inhibitors, and rapid acting insulin may be very useful (120). In glucocorticoid-treated patients requiring a basal-bolus insulin regimen, a higher requirement of short-acting insulin than basal insulin is frequently required (usually approximately 70% of total insulin dose as prandial and 30% as basal) (120). Because of the insulin resistance in patients with Cushing’s syndrome higher doses of insulin are often required to achieve glycemic control. Patients with Cushing’s syndrome are at higher risk for developing macrovascular disease and therefore the treatment of dyslipidemia and hypertension is required (148,149).  


Pheochromocytoma


Pheochromocytomas are rare neuroendocrine tumors that secrete norepinephrine, epinephrine, and dopamine (150). In pheochromocytomas the prevalence of diabetes mellitus has been estimated to be between 15-40% and impaired glucose tolerance as high as 50% (151-153). Patients with diabetes were older, had a longer known duration of hypertension, higher plasma epinephrine levels, increased urinary metanephrine excretion, and larger tumors (152,153). Surprisingly the BMI did not differ between patients with and without diabetes perhaps because more active tumors with higher catecholamine levels lead to weight loss (152,153). In most instances the diabetes is relatively mild but in rare instances can be severe with ketoacidosis (154). The association of hypertension with diabetes in a young patient who is not overweight is a clue to the presence of a pheochromocytoma (152).


Catecholamines, acting primarily by the beta-adrenergic receptors, stimulate glucose production by the liver by increasing glycogenolysis and increase insulin resistance leading to a decrease in tissue disposal of glucose, which together result in elevations in glucose levels (155-157). In addition, catecholamines acting via the alpha-adrenergic receptors, inhibit insulin secretion by the beta cells and acting via the beta-adrenergic receptors, increase glucagon secretion by the alpha cells (158). A decrease in insulin secretion and an increase in glucagon secretion would facilitate the development of hyperglycemia.


With tumor resection the diabetes resolves or markedly improves in the vast majority of patients (>90%) with a pheochromocytoma (152,153). A duration of diabetes of less than 3 years is associated with a remission of diabetes (159). It should be noted that post-surgical removal of a pheochromocytoma, hypoglycemia can occur in approximately 5% of patients (160). Most of these hypoglycemic episodes occur in the first 24 hours and are more likely to occur in patients with large tumors and high urinary metanephrine levels (160). If surgery is unsuccessful the use of alpha and beta blockers may improve insulin resistance and glucose homeostasis (161).


Hyperthyroidism 


Hyperthyroidism in patients without diabetes leads to an increase in glucose intolerance (162). Whether hyperthyroidism causes frank diabetes is unclear because much of the older literature that purports that hyperthyroidism causes diabetes used criteria for diabetes that differs greatly from current guidelines. For example, the study of Kreines and colleagues reported that 57% of patients with hyperthyroidism had diabetes but the criteria for diabetes was a 1 hour glucose >160mg/dL plus a 2 hour value >120 mg/dL during an oral glucose tolerance test (163). A study from China using oral glucose tolerance tests did not find a major difference in the prevalence of diabetes in patients with Grave’s disease (11.3%) vs controls (10.0%) (164). Additional studies using modern criteria for the diagnosis of diabetes are required to better elucidate the risk of developing diabetes in patients with hyperthyroidism. It should be noted that hyperthyroidism may worsen glycemic control in patients with diabetes by increasing hexose intestinal absorption, decreasing insulin sensitivity, and increasing glucose production (165).


T1D and Grave’s disease can occur together as part of the autoimmune polyglandular syndrome (166).


Glucagonoma


Glucagonomas are extremely rare and are associated with a characteristic rash termed necrolytic migratory erythema (82% of patients), painful glossitis, cheilitis, angular stomatitis, normochromic normocytic anemia (50-60%), weight loss (60-90%), mild diabetes mellitus (68-80%), hypoaminoacidemia, low zinc levels, deep vein thrombosis (50%), and depression (50%) (167,168). Glucagon stimulates hepatic glucose production by increasing gluconeogenesis and glycogenolysis leading to an increase in plasma glucose levels (169). Removal of the tumor results in remission of the diabetes.


Somatostatinoma


Somatostatinomas are extremely rare tumors that may present with a triad of diabetes mellitus, diarrhea/steatorrhea, and gallstones, but weight loss and hypochlorhydria also occur (170). Approximately seventy-five percent of patients with pancreatic somatostatinomas have diabetes mellitus while diabetes occurs in only approximately 10% of patients with intestinal tumors. Typically, the diabetes is relatively mild and can be controlled with diet, oral hypoglycemic agents or small doses of insulin (170). Somatostatin inhibits insulin secretion which can result in elevations in plasma glucose levels (139). Increased secretion of somatostatin by cells in the pancreas may be in closer proximity to beta cells and more effective in inhibiting insulin secretion. Somatostatin also inhibits glucagon secretion and therefore diabetic ketoacidosis is very unusual but has been reported (171). Additionally, replacement of functional islet cell tissue by pancreatic tumor may also contribute to the development of diabetes in patients with a pancreatic somatostatinoma (170). Removal of the tumor results in remission of the diabetes.


Primary Hyperaldosteronism


Hypokalemia secondary to hyperaldosteronism can impair insulin secretion and result in diabetes. Potassium replacement will improve glucose homeostasis.


Additionally, in a large meta-analysis the risk of diabetes (OR 1.33, 95% CI 1.01–1.74) and the metabolic syndrome (OR 1.53, 95% CI 1.22–1.91) was modestly increased in patients with primary hyperaldosteronism (172). Studies have shown that aldosterone independent of potassium levels reduces insulin secretion and induces insulin resistance via the impairment of post-receptor signaling (173).


DRUG- INDUCED DIABETES


A large number of different drugs have been shown to adversely affect glucose homeostasis (Table 1). Most of these drug’s act in conjunction with other risk factors for T2D and are usually not the sole cause of diabetes. Drug-induced hyperglycemia is often mild and may be clinically asymptomatic, but in some instances can result in the development of severe hyperglycemia manifesting as diabetic ketoacidosis. There are a number of mechanisms by which drugs induce alterations in glucose metabolism including inducing insulin resistance or inhibiting insulin secretion. In most cases the diabetes remits when the drug is stopped but in some instances the diabetes can be permanent. Use of a rodenticide (N-3 pyridylmethyl-N’4 nitrophenylurea, VacorÒ), structurally related to streptozotocin, was removed from the market in the 1980s because the ingestion of this compound resulted in insulin-dependent diabetes due to beta cell destruction (174). In this section we will focus on drugs that cause major changes in glucose homeostasis or drugs that are commonly used in clinical practice.


Antihypertensive Drugs


In a meta-analysis the risk of developing diabetes varied between different classes of antihypertensive drugs (175).  The odds ratios were: ARB 0.57; ACE inhibitor 0.67; CCB: 0.75; placebo 0.77; beta blocker 0.90 with the thiazide group set at 1.00. Similarly, in the ALLHAT study the risk of developing diabetes was greater in the thiazide group than in patients treated with an ACE inhibitor or a calcium channel blocker (176). In a meta-analysis of 10 studies of beta-blockers and 12 studies of diuretics in patients without diabetes it was found that beta-blockers increased fasting blood glucose concentrations by 11.5 mg/dL and diuretics by 13.9 mg/dl (177). In a meta-analysis of twelve studies with 94,492 patients beta-blocker therapy resulted in a 22% increased risk for new-onset diabetes compared with nondiuretic antihypertensive agents (178). Thus, both thiazide diuretics and beta blockers increase the risk of developing diabetes while ARBs and ACE inhibitors reduce the risk (179).


The hyperglycemia secondary to thiazide diuretics may in some instances be due to decreased insulin secretion secondary to potassium loss, which can be improved with potassium replacement (180). In addition, thiazides may directly affect insulin secretion similar to diazoxide (see below). Finally, thiazides also increase insulin resistance and enhance hepatic glucose production (180).


The effect on glucose metabolism differs between different beta-blockers and carvedilol, the third-generation beta-blocker has beneficial effects on glucose metabolism (179,180). A greater inhibition of insulin secretion occurs with non-selective beta-blocking agents (180). Beta blockers decrease insulin secretion and increase insulin resistance (179,180). In addition, beta-blockers increase weight, which could also adversely affect glucose homeostasis (181). Finally, beta-blockers increase the risk of severe hypoglycemia by decreasing the recovery from hypoglycemia and masking the symptoms of hypoglycemia (182).


Diazoxide


Diazoxide is a non-diuretic benzothiadiazine derivative, which increases plasma glucose levels by inhibiting insulin secretion through opening the potassium/ATP channels in beta cells (183). Diazoxide is used to control hypoglycemia in patients with insulinomas (184).


Statins


In a meta-analysis of 13 trials with over 90,000 subjects, there was a 9% increase in the incidence of diabetes during follow-up among subjects receiving statin therapy (185). All statins appear to increase the risk of developing diabetes. In comparisons of intensive vs. moderate statin therapy, Preiss et al observed that patients treated with intensive statin therapy had a 12% greater risk of developing diabetes compared to subjects treated with moderate dose statin therapy (186). Older subjects, obese subjects, and subjects with high glucose levels were at a higher risk of developing diabetes while on statin therapy (187). Thus, statins may be unmasking and accelerating the development of diabetes that would have occurred naturally in these subjects at some point in time. In patients without risk factors for developing diabetes, treatment with statins does not appear to increase the risk of developing diabetes.


The mechanism by which statins increase the risk of developing diabetes is unknown (187). Studies suggest that the inhibition of HMG-CoA reductase per se may be leading to the statin induced increased risk of diabetes via weight gain (187). However, a large number of studies have now shown that polymorphisms in a variety of different genes that lead to a decrease in LDL cholesterol levels are also associated with an increase in diabetes suggesting that decreases in LDL cholesterol levels per se alter glucose metabolism and increase the risk of diabetes (187). How decreased LDL cholesterol levels effect glucose metabolism is unknown.


In some studies statins have been shown to increase insulin resistance (188) and in some studies to decrease insulin secretion (189,190). Clearly further studies are required to understand the mechanisms by which statins increase the risk of developing diabetes.


Niacin


A recent meta-analysis examined the effect of niacin therapy on the development of new onset diabetes (191). In 11 trials with 26,340 non-diabetic participants, niacin therapy was associated with a 34% increased risk of developing diabetes (RR of 1.34; 95% CIs 1.21 to 1.49). This increased risk results in one additional case of diabetes per 43 initially non-diabetic individuals who are treated with niacin for 5 years (0.47% ten-year risk or 4.7 per 1000 patient years). Results were similar in patients who were receiving niacin therapy in combination with statin therapy. It has been recognized for many years that niacin induces insulin resistance (192). The mechanisms by which niacin induces insulin resistance are unknown but possible mechanisms include a rebound increase in free fatty acids with niacin therapy or the accumulation of diacylglycerol (192).


Pentamidine


Pentamidine is an antiprotozoal agent known to cause hypoglycemia and hyperglycemia (180). Pentamidine induces a direct cytolytic effect on pancreatic beta cells leading to insulin release and hypoglycemia, which is then followed by beta cell destruction and insulin deficiency resulting in diabetes (193,194).


Dilantin


Dilantin can cause hyperglycemia and there have been cases of diabetic ketoacidosis (195,196). The adverse effect of dilantin on glucose metabolism is mediated primarily by an inhibition of insulin secretion (180).


Alpha Interferon


Treatment with alpha interferon in rare instances can cause T1D. Of 987 patients treated with alpha interferon for chronic hepatitis C, 5 patients developed T1D (197). The clinical course is characterized by the abrupt development of severe hyperglycemia at times with ketoacidosis (198). High titers of anti-islet autoantibodies are present and almost all patients require permanent insulin therapy (198). Treatment with interferon alpha facilitates the development of autoimmune disorders including T1D (199). Other autoimmune disorders frequently occur, particularly thyroid dysfunction.


Checkpoint Inhibitors


There are several checkpoint inhibitors; ipilimumab a cytotoxic T-lymphocyte-associated protein 4 inhibitor (CTLA-4 inhibitor); nivolumab and pembrolizumab, programmed cell death protein 1 inhibitors (PD-1 inhibitors); atezolizumab, avelumab, and durvalumab. programmed cell death 1 ligand inhibitors (PD-L1 inhibitors) (200). Both CTLA-4 and PD-1 play a key role in the maintenance of immunological tolerance to self-antigens thereby preventing autoimmune disorders (200). Immune mediated hypothyroidism, hyperthyroidism, hypophysitis, primary adrenal insufficiency, hypoparathyroidism, and insulin-deficient diabetes have been reported as a complication of the use of these drugs (200,201). In a meta-analysis of 38 randomized clinical trials with 7551 patients, autoimmune diabetes occurred in only 0.2% of the patients and was primarily seen with the use of PD-1 inhibitors (200). In another meta-analysis of 101 studies with 19,922 patients the incidence of autoimmune diabetes was 2.0% (95% CI, 0.7–5.8) for nivolumab and 0.4% (95% CI, 0.2–1.3) for pembrolizumab (201). The occurrence of autoimmune diabetes with other checkpoint inhibitors was rare (201).


The onset of diabetes ranges from a few weeks up to one year after initiating therapy and typically presents with polyuria, polydipsia, weight loss and dehydration (201,202). Severe hyperglycemia and ketoacidosis is commonly observed (202). Because of the acute occurrence A1c levels may not be elevated. C-peptide levels are very low and approximately 50% of patients have islet cell antibodies (GAD, ICA, IAA or IA-2; GAD antibodies are the most commonly observed) (201,202). Insulin treatment is required and it is likely that the diabetes will be irreversible (201,202).


For additional information on the checkpoint inhibitor associated diabetes see the Endotext chapter “Immune Checkpoint Inhibitors Related Endocrine Adverse Events” in the Disorders that Affect Multiple Organs section (203).


Antipsychotic Drugs


A large number of studies have linked second generation antipsychotic medications with the development of T2D (Table 5) (204,205). In a meta-analysis of a large number of studies it was reported that olanzapine and clozapine treatment resulted in a greater increase in glucose than aripiprazole, quetiapine, risperidone and ziprasidone (206). Another meta-analysis has further shown that aripiprazole has a reduced risk of T2D compared to other antipsychotic agents (207). With regards to first generation antipsychotic drugs, chlorpromazine has a high risk of disrupting glucose metabolism while haloperidol, fluphenazine, and perphenazine have a low risk (204). It is thought that antipsychotic drugs induce diabetes by multiple mechanisms: (1) they inhibit insulin signalling in muscle cells, hepatocytes and adipocytes thereby causing insulin resistance; (2) they induce obesity, which can also cause insulin resistance; and (3) they cause direct damage to β-cells, leading to dysfunction and apoptosis of β-cells (205,208).


Table 5. Risk of Diabetes of Selected First- and Second-Generation Antipsychotics


Risk of diabetes*

First-generation antipsychotic

  Chlorpromazine

  Fluphenazine

  Perphenazine          

  Haloperidol  


+++

+

+

+

Second-generation antipsychotic

  Clozapine     

  Olanzapine  

  Quetiapine   

  Risperidone 

  Ziprasidone  

  Aripiprazole  

  Paliperidone 

  Lurasidone   


+++

+++

++

++

+

+

+

+

*Relative to other antipsychotics. Not all the risk of diabetes or weight gain is related to the antipsychotic. Table modified from (205)


Androgen Deprivation Therapy


A number of studies have shown that androgen deprivation therapy increases the risk of developing diabetes (209). For example, a study by Tsai reported that androgen deprivation therapy was associated with a 1.61-fold increased diabetes risk (95% CI 1.38-1.88) and the number needed to harm was 29 (210). The androgen deprivation induced diabetes typically develops after a year of treatment (209). Androgen deprivation therapy induces insulin resistance (209). The increase in insulin resistance may be due to an increase in visceral fat mass and/or an increase in pro-inflammatory adipokines such as TNF-a, IL-6, and resistin (209).


Immunosuppressive Drugs


Immunosuppressive drugs used after organ transplantations increase the risk of diabetes (211). In general, tacrolimus has been associated with a greater risk of developing diabetes compared to cyclosporine (211,212). The calcineurin inhibitors, tacrolimus and cyclosporine, decrease insulin secretion and synthesis (211,212). Additionally, tacrolimus and cyclosporine inhibit glucose uptake in human subcutaneous and omental adipocytes (212).


Mechanistic Target of Rapamycin Inhibitors (mTOR inhibitors)


mTOR inhibitors, sirolimus and everolimus, can induce diabetes (213).  The adverse effect of mTOR inhibitors on glucose metabolism is due to insulin resistance secondary to a reduction of the post receptor insulin signalling pathway and a reduction of insulin secretion via a direct effect on the pancreatic beta cells (211,213).


Asparaginase


Hyperglycemia is common with the use of asparaginase treatment ranging from 2.5% to 23% in the pediatric population and as high as 76% in adults with PEG-asparaginase use (214,215). Hyperglycemia usually resolves within 12 days after the last dose (214). Risk factors predisposing to hyperglycemia with asparaginase treatment include a history of impaired glucose tolerance, age >10 years, obesity, family history of diabetes mellitus, and history of Down syndrome (214,215). Diabetic ketoacidosis has been described with asparaginase treatment but is not a common occurrence (214). Decreased insulin secretion, increased insulin resistance, and increased glucagon secretion may contribute to the hyperglycemia observed with asparaginase. Additionally, asparaginase can induce pancreatitis, which can also lead to hyperglycemia (214).


Glucocorticoids, Somatostatin, and Glucagon


The effects of these hormones on glucose metabolism were discussed in the section on Endocrinopathies.


HIV Antiretroviral Therapy


The effect of the drugs used to treat patients living with HIV on the development of diabetes is discussed in the Endotext chapter “Diabetes in People Living with HIV” in the Diabetes section (6).


IMMUNE-MEDIATED


Latent Autoimmune Diabetes in Adults (LADA)


LADA is an autoimmune disorder that resembles T1D but shows a later onset and slower progression towards requiring insulin therapy (216-218). The ADA includes LADA as T1D whereas WHO classifies LADA as a hybrid form of diabetes (T1D and T2D) (84) (https://www.who.int/publications/i/item/classification-of-diabetes-mellitus). Epidemiological studies suggest that LADA may account for 2–12% of all cases of diabetes in the adult population (216,217,219). To differentiate LADA from T1D and T2D, the Immunology of Diabetes Society has proposed three criteria: (a) adult age of onset (> 30 years of age); (b) presence of at least one circulating autoantibody (GAD, ICA, IAA or IA-2) and; (c) insulin independence for the first 6 months after the time of diagnosis (216,217). Of the various antibodies associated with autoimmune diabetes GAD antibodies are present in most patients with LADA (216,217,219). Patients with high titers of GAD antibodies progress to requiring insulin more rapidly (218). LADA subjects appear to have a faster decline in C-peptide levels compared to autoantibody negative patients with T2D (219). It should be noted that classic T1D can occur in adults and this is defined as those adult patients with antibodies (GAD, ICA, IAA or IA-2) that require insulin therapy at diagnosis or soon after diagnosis (217,219). In contrast, patients with LADA can often go many years before requiring insulin therapy (217). Whether LADA is just a slowly progressing form of T1D or a hybrid T1D and T2D is unclear (Table 6).


Table 6. Comparison of T1D, LADA, and T2D


T1D

LADA

T2D

Age

Tend to be young

>age 25

Tend to be adult

Family history

Occasional

Occasional

Usually

C-peptide

Low, often undetectable

Varies

Normal or high

Auto-ab

+

+

-

Weight

Tend to be lean

Tend to be lean

Usually overweight

Metabolic syndrome

No

Varies

Usually

Insulin requirement

Yes

Varies, rapid progression

Varies

Genetic risk

HLA

PTPN22

INS

SH283

PFKFB3

Intermediate between T1D & T2D

TCF7L2

FTO

SLC30A8


In a retrospective study, Fourlanos and colleagues pointed out several features that increase the likelihood of a patient with “T2D” having LADA (220). These features include age of onset <50 years of age,  acute symptoms (polyuria, polydipsia, weight loss), BMI <25 kg/m2, personal history of autoimmune disease, and family history of autoimmune disease (220). The presence of at least two of these clinical features indicated a 90% sensitivity and 71% specificity for identifying a patient with LADA (220). As compared to patients with T2D, LADA patients have a lower rate of hypertension, lower total cholesterol levels, higher HDL cholesterol levels, and a decreased frequency of the metabolic syndrome (217,219). HLA-DQB1 risk genotypes have been consistently positively associated and protective genotypes have been negatively associated with LADA (218). However, in addition to genotypes that associate with T1D, patients with LADA also have an increased frequency of genotypes that associate with T2D (TCF7L2, FTO, and SLC30A8) (218).


Some have proposed GAD antibody testing all patients with T2D (221) to diagnose LADA but given the given the increased costs and the relatively frequent occurrence of false positive tests compared to true positives in a low-risk population this strategy is not widely accepted (222). The ADA suggests selective testing in adults without traditional risk factors for T2D and/or younger age (84). 


In LADA patients initially glycemic control can be achieved with hypoglycemic agents other than insulin but overtime patients progress to requiring insulin therapy. Sulfonylureas seem to accelerate the progress to requiring insulin therapy and therefore should be avoided (223). Because of the progressive loss of beta cell function there is an increased risk of diabetic ketoacidosis with SGLT2 inhibitors and therefore these drugs should be used with caution. Monitoring ketone levels in patient with LADA treated with SGLT2 inhibitors would be prudent. Novel therapies to preserve beta cell function would be ideal in patients with LADA but at this time there are no proven strategies to preserve beta cell function.


In a long- term follow-up (median 17.3 years) comparing microvascular outcomes in patients with LADA or T2D it was observed that the risk of renal failure/death, blindness, vitreous hemorrhage, or retinal photocoagulation was decreased in the patients with LADA during the first 9 years (adjusted HR 0.45; p<0.0001), whereas in subsequent years their risk was higher (HR 1·25; p=0.047) (224). This difference was attributed to higher A1c levels in the LADA patients. The prevalence of coronary heart disease and cardiovascular mortality is similar in patients with LADA and T2D (225,226).


Autoimmune Polyglandular Syndromes


T1D can occur as part of the autoimmune polyglandular syndromes. These disorders are discussed in the Endotext chapter “Autoimmune Polyglandular Syndromes” in the Disorders that Affect Multiple Organs section (4).


Stiff-person syndrome


Stiff-person syndrome is a rare autoimmune disorder of the nervous system with fluctuating stiffness and spasm of the skeletal muscles that occurs more frequently in females than males (approximately 2/3 women) (227). Muscle involvement is symmetrical and the lower extremities are affected more commonly than the upper extremities and proximal limb and axial muscles are affected more severely than distal muscles (227). Most patients have very high levels of anti-glutamic acid decarboxylase (GAD) antibodies (227). 30-65% of these individuals also develop beta cell destruction and T1D (228). Diabetes may occur several years prior to the development of the stiff person syndrome (60%) or after the development of the stiff person syndrome (227,228). The stiff person syndrome without GAD antibodies is not associated with diabetes (228). Other autoimmune manifestations are also common, particularly thyroid disorders and pernicious anemia (227,228).


Autoimmune Insulin Resistance Type B Syndrome


Insulin resistance can result from autoantibodies directed against the insulin receptor, which either inhibit insulin from binding to the receptor or stimulate the receptor (229). Thus, they can cause either hyperglycemia or hypoglycemia, even alternating in the same patient. The patients usually present with very high glucose levels and significant weight loss (229). The diagnosis can be confirmed by demonstrating the presence of autoantibodies to the insulin receptor. The prevalence of type B insulin resistance syndrome is unknown but is quite rare (229). Middle-aged women are most often affected and often have other manifestations of autoimmune disease such as SLE or Sjogren’s. However, this disorder can also affect males and younger patients. Patients may have signs of insulin resistance including acanthosis nigricans and ovarian hyperandrogenism. Of note the acanthosis nigricans may involve the lips and the periocular region resulted in a typical facial appearance (229). Serum testosterone levels are often elevated in females (229). Patients often need excessive amounts of insulin (1,000 U or more per day). One can add insulin sensitizers such as metformin and/or thiazolidinediones to try to reduce the insulin dose, which can in some patients be greater than 10,000U per day (229). Treatment includes immunosuppression and/or plasmapheresis to halt the autoantibody production and decrease antibody levels (230). Approximately 1/3 of patients will undergo a spontaneous remission with reversal of the hyperglycemia/hypoglycemia and the clinical manifestations (229).


DIABETES OF UNKNOWN CAUSE


Ketosis-Prone Diabetes in Adults (Flatbush Diabetes)


This syndrome is characterized by the acute onset of severe hyperglycemia with or without ketoacidosis, which after several weeks to months no longer requires insulin therapy and can be treated with diet or oral hypoglycemic agents (231,232). These patients typically have a history of polyuria, polydipsia, and weight loss for less than 4 to 6 weeks indicating an abrupt onset of the disorder in glucose metabolism and no history of an event that could have precipitated the hyperglycemia (232). The initial presentation is suggestive of T1D. While in most patients insulin therapy can be stopped there are some patients who continue to require insulin treatment (231). This syndrome occurs in black populations (African American, African-Caribbean, sub-Saharan African), Hispanic populations, and Asian (Chinese, Indian, and Japanese) populations but is not typically seen in Caucasians (231,232).  The typical patient is male, middle-aged, overweight or modestly obese with a strong family history of diabetes (231,232). Patients are negative when tested for islet cell antibodies (GAD, ICA, IAA or IA-2) (231). Recurrent episodes of ketoacidosis can occur but the clinical course is typical of patients with T2D (231,232). Treatment with hypoglycemic agents reduces the risk of recurrence (232,233). With long-term follow-up many patients eventually require insulin therapy similar to what is observed in patients with T2D (233).


During the episode of severe hyperglycemia patients with ketosis-prone diabetes have lost the ability of glucose to stimulate beta cell insulin secretion but nonglycemic pharmacologic agents (glucagon and arginine) can stimulate insulin secretion (231). After restoration of normal glycemia the ability of glucose to stimulate insulin secretion returns towards normal and by 8-12 weeks has maximally improved (231). Usually patients with this syndrome have a modest reduction in stimulated insulin secretion (231). Why these patients temporarily lose the ability for glucose to stimulate insulin secretion is unknown. Additionally, during the acute episode of hyperglycemia the patients are severely insulin resistant, which improves during a period of euglycemia (232,233).


Clinically, it is important to recognize this syndrome as some patients presenting with diabetic ketoacidosis, particularly if they are non-Caucasians, may not have T1D but rather have ketosis-prone diabetes. It is estimated that between 20% and 50% of African-American and Hispanic patients with a new diagnosis of diabetic ketoacidosis have ketosis-prone diabetes (232). After restoration of euglycemia the management of these patients is similar to the management of patients with T2D and they frequently do not require permanent insulin treatment.


OTHER GENETIC SYNDROMES SOMETIMES ASSOCIATED WITH DIABETES


There are a number of inherited monogenic disorders that secondarily can be associated with diabetes. The mechanisms linking these disorders with diabetes is often not clear.


Chromosomal Abnormalities


DOWN’S SYNDROME


Down’s syndrome is due to trisomy of chromosome 21 and occurs in 1 in every 787 liveborn babies (234). Down’s syndrome is often associated with autoimmune disorders like T1D and thyroiditis (234,235). The prevalence rate of T1D in patients with Down's syndrome has been estimated to be between 1.4 and 10.6%, which is higher than in the general population (236). In another study there was a 4-fold increased prevalence of diabetes in patients with Down’s syndrome (237). Diabetes in patients with Down’s syndrome often presents earlier in life with 22% of participants developing diabetes by 2 years of age (238). The presence of diabetes is often associated with other autoimmune disorders, particularly hypothyroidism and celiac disease (235). Anti-glutamic acid decarboxylase antibodies (GAD antibodies) are very frequently present in Down’s syndrome subjects developing diabetes (235). Down’s syndrome patients with diabetes have similar HLA genotypes as non-Down’s syndrome patients with T1D (235). Interestingly, while patients with Down’s syndrome and diabetes are typically treated with simpler regimens their glycemic control tends to be as good or better than the usual patient with T1D, perhaps related to a simpler lifestyle and acceptance of routine (235). The cause of the increased autoimmunity in patients with Down’s syndrome may be due to the abnormal expression of the AIRE gene, which regulates T-cell function and self-recognition and is located on chromosome 21 (21q22.3 region) (234,235).


KLINEFELTER SYNDROME


Klinefelter syndrome is due to an extra X chromosome in men (XXY) resulting in hypergonadotropic hypogonadism and low testosterone levels (239). The prevalence of Klinefelter syndrome is approximately 1 in 500 to 1 in 1000 males (239). Patients with Klinefelter syndrome are frequently obese, insulin resistant, and at increased risk to develop T2D (240). The prevalence of overt diabetes in Klinefelter syndrome is estimated to be between 10-39% (240,241). Additionally, the prevalence of diabetes is even higher (up to 57%) in patients with the more severe karyotypes (48, or 49 chromosomes) (240). Klinefelter syndrome patients develop diabetes earlier in life (onset around 30 years) and their BMI is lower than what is usually observed in patients with T2D (240). Whether testosterone therapy will be of benefit in preventing or treating diabetes in patients with Klinefelter syndrome is uncertain (241). Given the increased risk of developing T2D patients with Klinefelter syndrome should be periodically screened for diabetes.


Interestingly, one study reported an increased prevalence of T1D in patients with Klinefelter syndrome (242). Furthermore, a recent study reported that 8.2% of patients with Klinefelter syndrome had autoantibodies specific to T1D (Insulin Abs, GAD Abs, IA-2 Abs, Znt8 Abs) (243). Additional studies are required to better elucidate whether Klinefelter syndrome increases the risk of developing T1D.


TURNER SYNDROME


Turner syndrome is the most common chromosomal abnormality in girls, affecting approximately 1:2,500 of female live births (244). The condition is caused by complete or partial deletion of an X chromosome (244). The incidence of both T1D and T2D has been reported to be increased in patients with Turner syndrome (245). However, the link between T1D and Turner syndrome is not well characterized while the link with T2D is clearly established (246,247). For example, in a study of 224 patients with Turner syndrome 56 (25%) had T2D whereas only 1 patient (<0.5%) had T1D (248). Patients with Turner syndrome have an increased risk of autoimmune disorders, particularly hypothyroidism and celiac disease, but the risk of autoimmune T1D is much less (247,249). Four percent of patients with Turner syndrome have been shown to have GAD antibodies, which is greater than the 1% prevalence seen in the general population (249).


The prevalence of glucose intolerance is estimated to be from 15-50% while the prevalence of T2D is estimated to be approximately 10-25% (247,248). T2D occurs at a relatively young age in patients with Turner syndrome. Decreased beta cell function and decreased insulin sensitivity was observed in teenagers with Turner syndrome and was accompanied by an increased prevalence of impaired fasting glucose and impaired glucose tolerance compared to controls (250). Increased obesity is common in patients with Turner syndrome, which likely contributes to the abnormalities in glucose metabolism (246). Both insulin resistance and decreased insulin secretion are present in patients with Turner syndrome but the development of hyperglycemia in patients with T2D appears to be driven by decreased insulin secretion (246,247). Because of the high prevalence of diabetes, it is recommended to screen A1c with or without fasting glucose levels annually beginning at 10 years of age (247). Growth hormone therapy does not appear to increase the risk or worsen diabetes (246,247). Growth hormone therapy may lead to a decrease in adiposity and impaired glucose tolerance, which suggests it may actually improve glucose homeostasis (247). Similarly, sex steroid hormone replacement therapy also does not appear to have major adverse effects on glucose metabolism in patients with Turner syndrome (246).


WILLIAMS SYNDROME


Williams syndrome (Williams-Beuren syndrome) is a multisystem disorder characterized by transient infantile hypercalcemia, distinctive facial dysmorphism, and supravalvular aortic stenosis (251,252). In addition, gastrointestinal problems, dental anomalies, developmental delay/intellectual disability, anxiety disorders, and attention deficit disorder may occur as well as a variety of endocrine abnormalities including reduced statural growth, obesity, dyslipidemia, early pubertal development, hypothyroidism, and decreased bone density (251,253). Williams syndrome is due to a deletion on chromosome 7q, leading to the loss of 25–27 contiguous genes and thus individuals with Williams syndrome have only a single copy of these genes (252). This deletion almost always arises de novo in the affected individual. The estimated prevalence of Williams syndrome is ~1/7,500 and effects both males and females (252).


Numerous studies have shown a high prevalence of T2D and impaired glucose tolerance in patients with Williams syndrome (251). The abnormalities in glucose metabolism occur during adolescence and are not necessarily associated with obesity (251). Of note insulin resistance is observed initially followed by a loss of insulin secretion (251). Markers of islet autoimmunity are not observed (251). In a review of 7 studies with 154 participants with Williams syndrome and an average age ranging from 13 to 35 years of age it was observed that 18% had diabetes and 42% impaired glucose tolerance (251). Because of this high risk for diabetes, it is recommended that patients with Williams syndrome be screened for diabetes beginning in adolescence (251). Note-worthy is that A1c was frequently not abnormal and therefore screening should be with fasting glucose levels or an oral glucose tolerance test (251).


Diseases of the Endoplasmic Reticulum


The endoplasmic reticulum folds and modifies newly formed proteins to make them function properly. Therefore, diseases affecting the endoplasmic reticulum usually affect many organs.


WOLFRAM SYNDROME 


Wolfram syndrome is a rare autosomal recessive genetic disorder characterized by T1D, diabetes insipidus, optic nerve atrophy, hearing loss, and neurodegeneration (254,255). There are also rare autosomal dominant forms of this disorder (255). This syndrome is sometimes called DIDMOAD (diabetes insipidus, diabetes mellitus, optic atrophy, and deafness). The prevalence is approximately one per 770,000 but varies depending upon the specific population (254,255). The onset of the clinical picture is highly variable in both severity and clinical manifestations (255). This disorder typically has a very poor prognosis with the median age at death being 30 years (254). Diabetes mellitus is usually the first manifestation, typically diagnosed around age 6 (254). The diabetes is not immune mediated but is characterized by insulin deficiency (255). Almost all patients require insulin therapy (255). Residual beta cell function persists and therefore good glycemic control tends to be easier to achieve in Wolfram syndrome than immune mediated T1D (255). However, over time C-peptide levels decrease (256). The development of optic atrophy and hearing loss in children with diabetes are clues to the presence of this syndrome. Until the onset of optic atrophy and hearing loss these patients are usually thought to have typical T1D with an absence of antibodies (255). Confirmation of the diagnosis can be made by identifying mutations in the WFS1 gene (Wolfram syndrome type 1) (254). The WFS1 gene encodes a transmembrane protein (wolframin) localized to the ER (endoplasmic reticulum) and mutations result in ER stress leading to beta cell dysfunction and death (254).


Mutations in CISD2 gene cause a similar recessive type of Wolfram syndrome (Wolfram syndrome type 2) with patients exhibiting bleeding from upper intestinal ulcers and defective platelet aggregation without diabetes insipidus and psychiatric disorders (255). CISD2 encodes for a protein that moves between the ER and mitochondrial outer membrane (255).  


Unfortunately, there are currently no specific treatments to restore ER function and prevent the complications of this disorder.


Base Pair Repeat Syndromes     


FRIEDRICHS ATAXIA


Friedreich ataxia is a rare recessive disorder caused by triplet repeats (GAA) in the mitochondrial frataxin gene characterized by slowly progressive ataxia associated with dysarthria, muscle weakness, spasticity particularly in the lower limbs, scoliosis, bladder dysfunction, absent lower limb reflexes, and loss of position and vibration sense (257). The onset usually occurs before 25 years of age (257). Cardiomyopathy occurs in 2/3 of patients and up to 30% of patients have diabetes (257). The disorder effects approximately 1 in 30,000 Caucasians.


Diabetes occurs in 8-32% of patients with Friedrichs ataxia and an even higher percentage have impaired glucose tolerance (258,259). Hyperglycemia commonly develops approximately 15 years after the manifestation of neurological symptoms often presenting acutely with patients requiring insulin therapy (258,259). In a number of instances patients presented with ketoacidosis (259). Both insulin deficiency and insulin resistance have been reported in patients with Friedreich ataxia (259). It is hypothesized that mutations in frataxin result in alterations in mitochondria function that impair the ability of beta cells to secrete insulin in response to glucose and increase the risk of beta cell death (259).


There are no controlled studies comparing different diabetes therapies in patients with Friedreich ataxia. Metformin and thiazolidinediones inhibit the mitochondrial respiratory chain and therefore they should probably be used with caution in patients with mitochondrial disease (259). Additionally, thiazolidinediones increase the risk of congestive heart failure and patients with Friedreich ataxia have a high risk of cardiomyopathies and therefore should be avoided. Insulin is often required to achieve glycemic control.


HUNTINGTON’S DISEASE


Huntington’s disease is an autosomal dominant disorder that begins in adulthood (usually 30-50 years of age) and has distinctive motor defects (chorea, dystonia, and dyskinesia), psychiatric symptoms (depression and anxiety), and cognitive decline (260). This disorder is due to an unstable expansion of CAG repeats in the first exon of the gene that encodes the protein huntingtin (260). The prevalence of this disorder is approximately 5-12 per 100,000 (260,261). While an early study reported that approximately 10% of patients with Huntington’s disease have diabetes a careful review of recent studies reached the conclusion that the prevalence of diabetes in patients with Huntington’s disease is not increased and might actually be decreased (261,262).


MYOTONIC DYSTROPHY


Myotonic dystrophy type 1 is an autosomal-dominantly inherited disease characterized by myotonia, distal muscular dystrophy, cataracts, hypogonadism, and frontal hair loss that occurs in middle age (263). The disease is due to a CTG triplet repeat expansion in the myotonic dystrophy protein kinase gene (263). Diabetes is not a characteristic finding in myotonic dystrophy type 1 but the prevalence is increased 2-4-fold in patients with this disorder compared to the general population (263-265). A large study in Korea with 387 patients with myotonic dystrophy type 1 found that 27% had diabetes (266). Patients with myotonic dystrophy type 1 and diabetes have elevated insulin levels suggesting insulin resistance (263,264). Pioglitazone alone and in combination with metformin has been reported to improve glycemic control in patients with myotonic dystrophy and diabetes (267,268).


Obesity Syndromes


BARDET-BIEDLE SYNDROME (BBS)


Bardet-Biedl syndrome (BBS), also earlier referred to as Laurence Moon Biedl syndrome, is a rare autosomal recessive disease with a prevalence of about 1/125,000 (269,270). BBS belongs to the group of ciliopathies characterized by obesity, retinal degeneration, finger anomalies, hypogonadism, renal abnormalities, and intellectual impairment (269,270). It can result from autosomal recessive mutations in at least 22 genes (BBS), which play a key role in structure and function of cilia (269,270). In a study of 152 patients with BBS it was reported that approximately 75% were obese and the average BMI was 35.7kg/m2 (270). Twenty-five of these patients with BBS had diabetes (16.4%) with 24 having T2D and 1 having T1D (270). Of the 24 patients with T2D six patients were diet controlled, eight were taking metformin, and 10 were on insulin therapy. The mean A1c of subjects with T2D was 7.8 (270). In a smaller series of 46 patients, it was reported that 22 had T2D (46%) and the median age of onset of diabetes mellitus was 43 years (217). The risk of developing diabetes increases with age. In the BBS patients without diabetes fasting glucose, insulin levels, and HOMA-IR were significantly increased in the BBS group compared with an age and BMI matched control group (270). The metabolic syndrome was present in 54% of the patients with BBS (270).


PRADER WILLI SYNDROME (PWS)


PWS is a rare autosomal dominant disorder due to a mutation or deletion of several genes in an imprinting region on chromosome 15 (271). PWS in children is associated with excessive eating and morbid obesity, hypogonadism, low muscle tone, and short stature (271). The hyperphagia that occurs in PWS is believed to be due to a hypothalamic abnormality resulting in lack of satiety. This leads to excessive obesity in children, which is often associated with T2D due to severe insulin resistance (271). Approximately 20- 25% of adults with PWS have T2D with a mean age of onset of 20 years (271,272). Individuals with PWS who develop early diabetes have severe obesity, a high prevalence of psychiatric and metabolic disorders, and a family history of overweight and T2D (272). In recent years the earlier diagnosis and education of parents, use of growth hormone therapy, and the frequency of group homes specific for PWS have led to a reduction in the development of morbid obesity resulting in a decrease in the development of T2D among individuals with PWS (271). Metformin has been shown to be effective in the treatment of PWS patients with diabetes (273). Studies of GLP1 receptor agonists demonstrated lowering of A1c levels but effects on weight loss have been inconsistent (274).


ALSTROM SYNDROME


Alstrom syndrome is a rare autosomal recessive disorder with a prevalence of less than one per million characterized by retinal dystrophy, hearing loss, childhood truncal obesity, insulin resistance and hyperinsulinemia, T2D, hypertriglyceridemia, short stature in adulthood, cardiomyopathy, and progressive pulmonary, hepatic, and renal dysfunction (275-277). Symptoms appear in infancy and multi-organ pathology leads to a decreased life expectancy (275,276). The syndrome is caused by mutations in ALMS1, which is a ciliary protein and hence many of the features of Alstrom syndrome resemble those seen in the Bardet-Biedl syndrome (275-277). Diagnosis is confirmed by finding biallelic pathogenic variants in ALMS1 gene.


Severe insulin resistance secondary to abnormalities in GLUT4 trafficking, hyperinsulinemia, and impaired glucose tolerance frequently present in early childhood and are often accompanied by acanthosis nigricans (275,277). T2D develops early in life with a mean age of onset at 16 years (275). In one study 82% of patients with Alstrom syndrome older than 16 years of age have T2D (278). Weight loss with diet, exercise, and medications is indicated (279). Therapy with oral agents, particularly insulin sensitizing agents, may be effective but insulin therapy may be required (275,279).


Miscellaneous


PORPHYRIA


Porphyria cutanea tarda has been associated with diabetes (280), but given that many patients with this disorder also have iron overload, genes for hemochromatosis, and HCV and HIV infection it is very difficult to tell if porphyria cutanea tarda per se is responsible for the association with diabetes (281,282).


REFERENCES


  1. Akinci B, Sahinoz M, Oral E. Lipodystrophy Syndromes: Presentation and Treatment. In: Feingold KR, Anawalt B, Boyce A, Chrousos G, Dungan K, Grossman A, Hershman JM, Kaltsas G, Koch C, Kopp P, Korbonits M, McLachlan R, Morley JE, New M, Perreault L, Purnell J, Rebar R, Singer F, Trence DL, Vinik A, Wilson DP, eds. Endotext. South Dartmouth (MA)2018.
  2. Naylor RN, Philipson LH. Diagnosis and Clinical Management of Monogenic Diabetes. In: Feingold KR, Anawalt B, Boyce A, Chrousos G, de Herder WW, Dhatariya K, Dungan K, Grossman A, Hershman JM, Hofland J, Kalra S, Kaltsas G, Koch C, Kopp P, Korbonits M, Kovacs CS, Kuohung W, Laferrere B, McGee EA, McLachlan R, Morley JE, New M, Purnell J, Sahay R, Singer F, Stratakis CA, Trence DL, Wilson DP, eds. Endotext. South Dartmouth (MA)2020.
  3. Pham PT, Sidhu HS, Pham PM, Pham PC. Diabetes Mellitus After Solid Organ Transplantation. In: Feingold KR, Anawalt B, Boyce A, Chrousos G, de Herder WW, Dhatariya K, Dungan K, Hershman JM, Hofland J, Kalra S, Kaltsas G, Koch C, Kopp P, Korbonits M, Kovacs CS, Kuohung W, Laferrere B, Levy M, McGee EA, McLachlan R, Morley JE, New M, Purnell J, Sahay R, Singer F, Sperling MA, Stratakis CA, Trence DL, Wilson DP, eds. Endotext. South Dartmouth (MA)2019.
  4. Sperling MA, Angelousi A, Yau M. Autoimmune Polyglandular Syndromes. In: Feingold KR, Anawalt B, Boyce A, Chrousos G, de Herder WW, Dhatariya K, Dungan K, Hershman JM, Hofland J, Kalra S, Kaltsas G, Koch C, Kopp P, Korbonits M, Kovacs CS, Kuohung W, Laferrere B, Levy M, McGee EA, McLachlan R, Morley JE, New M, Purnell J, Sahay R, Singer F, Sperling MA, Stratakis CA, Trence DL, Wilson DP, eds. Endotext. South Dartmouth (MA)2021.
  5. Cleary EM, Thung SF, Buschur EO. Gestational Diabetes. In: Feingold KR, Anawalt B, Boyce A, Chrousos G, de Herder WW, Dhatariya K, Dungan K, Hershman JM, Hofland J, Kalra S, Kaltsas G, Koch C, Kopp P, Korbonits M, Kovacs CS, Kuohung W, Laferrere B, Levy M, McGee EA, McLachlan R, Morley JE, New M, Purnell J, Sahay R, Singer F, Sperling MA, Stratakis CA, Trence DL, Wilson DP, eds. Endotext. South Dartmouth (MA)2021.
  6. Sarkar S, Brown TT. Lipid Disorders in People with HIV. In: Feingold KR, Anawalt B, Boyce A, Chrousos G, de Herder WW, Dhatariya K, Dungan K, Hershman JM, Hofland J, Kalra S, Kaltsas G, Koch C, Kopp P, Korbonits M, Kovacs CS, Kuohung W, Laferrere B, Levy M, McGee EA, McLachlan R, Morley JE, New M, Purnell J, Sahay R, Singer F, Sperling MA, Stratakis CA, Trence DL, Wilson DP, eds. Endotext. South Dartmouth (MA)2021.
  7. Unnikrishnan AG, Kumaran S, Kalra S. Fibrocalculous Pancreatic Diabetes. In: Feingold KR, Anawalt B, Boyce A, Chrousos G, de Herder WW, Dhatariya K, Dungan K, Hershman JM, Hofland J, Kalra S, Kaltsas G, Koch C, Kopp P, Korbonits M, Kovacs CS, Kuohung W, Laferrere B, Levy M, McGee EA, McLachlan R, Morley JE, New M, Purnell J, Sahay R, Singer F, Sperling MA, Stratakis CA, Trence DL, Wilson DP, eds. Endotext. South Dartmouth (MA)2022.
  8. Li HZ, Li RY, Li M. A review of maternally inherited diabetes and deafness. Front Biosci (Landmark Ed) 2014; 19:777-782
  9. Murphy R, Turnbull DM, Walker M, Hattersley AT. Clinical features, diagnosis and management of maternally inherited diabetes and deafness (MIDD) associated with the 3243A>G mitochondrial point mutation. Diabet Med 2008; 25:383-399
  10. Maassen JA, Jahangir Tafrechi RS, Janssen GM, Raap AK, Lemkes HH, t Hart LM. New insights in the molecular pathogenesis of the maternally inherited diabetes and deafness syndrome. Endocrinol Metab Clin North Am 2006; 35:385-396, x-xi
  11. Parikh S, Goldstein A, Koenig MK, Scaglia F, Enns GM, Saneto R, Anselm I, Cohen BH, Falk MJ, Greene C, Gropman AL, Haas R, Hirano M, Morgan P, Sims K, Tarnopolsky M, Van Hove JL, Wolfe L, DiMauro S. Diagnosis and management of mitochondrial disease: a consensus statement from the Mitochondrial Medicine Society. Genet Med 2015; 17:689-701
  12. Semple RK, Savage DB, Cochran EK, Gorden P, O'Rahilly S. Genetic syndromes of severe insulin resistance. Endocr Rev 2011; 32:498-514
  13. Taylor SI. Lilly Lecture: molecular mechanisms of insulin resistance. Lessons from patients with mutations in the insulin-receptor gene. Diabetes 1992; 41:1473-1490
  14. Musso C, Cochran E, Moran SA, Skarulis MC, Oral EA, Taylor S, Gorden P. Clinical course of genetic diseases of the insulin receptor (type A and Rabson-Mendenhall syndromes): a 30-year prospective. Medicine (Baltimore) 2004; 83:209-222
  15. Stears A, O'Rahilly S, Semple RK, Savage DB. Metabolic insights from extreme human insulin resistance phenotypes. Best Pract Res Clin Endocrinol Metab 2012; 26:145-157
  16. Cochran E, Young JR, Sebring N, DePaoli A, Oral EA, Gorden P. Efficacy of recombinant methionyl human leptin therapy for the extreme insulin resistance of the Rabson-Mendenhall syndrome. J Clin Endocrinol Metab2004; 89:1548-1554
  17. Okawa MC, Cochran E, Lightbourne M, Brown RJ. Long-term effects of metreleptin in Rabson-Mendenhall Syndrome on glycemia, growth, and kidney function. J Clin Endocrinol Metab 2021;
  18. Ewald N, Bretzel RG. Diabetes mellitus secondary to pancreatic diseases (Type 3c)--are we neglecting an important disease? Eur J Intern Med 2013; 24:203-206
  19. Ewald N, Kaufmann C, Raspe A, Kloer HU, Bretzel RG, Hardt PD. Prevalence of diabetes mellitus secondary to pancreatic diseases (type 3c). Diabetes Metab Res Rev 2012; 28:338-342
  20. Hart PA, Bellin MD, Andersen DK, Bradley D, Cruz-Monserrate Z, Forsmark CE, Goodarzi MO, Habtezion A, Korc M, Kudva YC, Pandol SJ, Yadav D, Chari ST, Consortium for the Study of Chronic Pancreatitis D, Pancreatic C. Type 3c (pancreatogenic) diabetes mellitus secondary to chronic pancreatitis and pancreatic cancer. Lancet Gastroenterol Hepatol 2016; 1:226-237
  21. Pendharkar SA, Mathew J, Petrov MS. Age- and sex-specific prevalence of diabetes associated with diseases of the exocrine pancreas: A population-based study. Dig Liver Dis 2017; 49:540-544
  22. Ewald N, Hardt PD. Diagnosis and treatment of diabetes mellitus in chronic pancreatitis. World J Gastroenterol2013; 19:7276-7281
  23. Salvatore T, Marfella R, Rizzo MR, Sasso FC. Pancreatic cancer and diabetes: A two-way relationship in the perspective of diabetologist. Int J Surg 2015; 21 Suppl 1:S72-77
  24. Ebert R, Creutzfeldt W. Reversal of impaired GIP and insulin secretion in patients with pancreatogenic steatorrhea following enzyme substitution. Diabetologia 1980; 19:198-204
  25. Petrov MS. DIAGNOSIS OF ENDOCRINE DISEASE: Post-pancreatitis diabetes mellitus: prime time for secondary disease. Eur J Endocrinol 2021; 184:R137-R149
  26. Hart PA, Bradley D, Conwell DL, Dungan K, Krishna SG, Wyne K, Bellin MD, Yadav D, Andersen DK, Serrano J, Papachristou GI. Diabetes following acute pancreatitis. Lancet Gastroenterol Hepatol 2021; 6:668-675
  27. Goodarzi MO, Petrov MS, Andersen DK, Hart PA. Diabetes in chronic pancreatitis: risk factors and natural history. Curr Opin Gastroenterol 2021; 37:526-531
  28. Woodmansey C, McGovern AP, McCullough KA, Whyte MB, Munro NM, Correa AC, Gatenby PAC, Jones SA, de Lusignan S. Incidence, Demographics, and Clinical Characteristics of Diabetes of the Exocrine Pancreas (Type 3c): A Retrospective Cohort Study. Diabetes Care 2017; 40:1486-1493
  29. Rickels MR, Bellin M, Toledo FG, Robertson RP, Andersen DK, Chari ST, Brand R, Frulloni L, Anderson MA, Whitcomb DC. Detection, evaluation and treatment of diabetes mellitus in chronic pancreatitis: recommendations from PancreasFest 2012. Pancreatology 2013; 13:336-342
  30. Hardt PD, Krauss A, Bretz L, Porsch-Ozcurumez M, Schnell-Kretschmer H, Maser E, Bretzel RG, Zekhorn T, Klor HU. Pancreatic exocrine function in patients with type 1 and type 2 diabetes mellitus. Acta Diabetol 2000; 37:105-110
  31. Noel RA, Braun DK, Patterson RE, Bloomgren GL. Increased risk of acute pancreatitis and biliary disease observed in patients with type 2 diabetes: a retrospective cohort study. Diabetes Care 2009; 32:834-838
  32. Wang Z, Lai ST, Xie L, Zhao JD, Ma NY, Zhu J, Ren ZG, Jiang GL. Metformin is associated with reduced risk of pancreatic cancer in patients with type 2 diabetes mellitus: a systematic review and meta-analysis. Diabetes Res Clin Pract 2014; 106:19-26
  33. Lowenfels AB, Maisonneuve P, Cavallini G, Ammann RW, Lankisch PG, Andersen JR, Dimagno EP, Andren-Sandberg A, Domellof L. Pancreatitis and the risk of pancreatic cancer. International Pancreatitis Study Group. N Engl J Med 1993; 328:1433-1437
  34. Magruder JT, Elahi D, Andersen DK. Diabetes and pancreatic cancer: chicken or egg? Pancreas 2011; 40:339-351
  35. Cho J, Scragg R, Petrov MS. Postpancreatitis Diabetes Confers Higher Risk for Pancreatic Cancer Than Type 2 Diabetes: Results From a Nationwide Cancer Registry. Diabetes Care 2020; 43:2106-2112
  36. Couet C, Genton P, Pointel JP, Louis J, Gross P, Saudax E, Debry G, Drouin P. The prevalence of retinopathy is similar in diabetes mellitus secondary to chronic pancreatitis with or without pancreatectomy and in idiopathic diabetes mellitus. Diabetes Care 1985; 8:323-328
  37. Tiengo A, Segato T, Briani G, Setti A, Del Prato S, Devide A, Padovan D, Virgili F, Crepaldi G. The presence of retinopathy in patients with secondary diabetes following pancreatectomy or chronic pancreatitis. Diabetes Care 1983; 6:570-574
  38. Briani G, Riva F, Midena E, Trevisan R, Sgnaolin E, Jori E, Munari R, Bruttomesso D, Segato T, Tiengo A. Prevalence of microangiopathic complications in hyperglycemia secondary to pancreatic disease. J Diabet Complications 1988; 2:50-52
  39. Ziegler O, Candiloros H, Guerci B, Got I, Crea T, Drouin P. Lower-extremity arterial disease in diabetes mellitus due to chronic pancreatitis. Diabete Metab 1994; 20:540-545
  40. Kuo P, Stevens JE, Russo A, Maddox A, Wishart JM, Jones KL, Greville H, Hetzel D, Chapman I, Horowitz M, Rayner CK. Gastric emptying, incretin hormone secretion, and postprandial glycemia in cystic fibrosis--effects of pancreatic enzyme supplementation. J Clin Endocrinol Metab 2011; 96:E851-855
  41. Mezza T, Cefalo CMA, Cinti F, Quero G, Pontecorvi A, Alfieri S, Holst JJ, Giaccari A. Endocrine and Metabolic Insights from Pancreatic Surgery. Trends Endocrinol Metab 2020; 31:760-772
  42. Suto H, Kamei K, Kato H, Misawa T, Unno M, Nitta H, Satoi S, Kawabata Y, Ohtsuka M, Rikiyama T, Sudo T, Matsumoto I, Hirao T, Okano K, Suzuki Y, Sata N, Isaji S, Sugiyama M, Takeyama Y. Diabetic control and nutritional status up to 1 year after total pancreatectomy: a nationwide multicentre prospective study. Br J Surg2021; 108:e237-e238
  43. Chaouch MA, Leon P, Cassese G, Aguilhon C, Khayat S, Panaro F. Total pancreatectomy with intraportal islet autotransplantation for pancreatic malignancies: a literature overview. Expert Opin Biol Ther 2021:1-7
  44. Robertson GS, Dennison AR, Johnson PR, London NJ. A review of pancreatic islet autotransplantation. Hepatogastroenterology 1998; 45:226-235
  45. Jablonska B, Mrowiec S. Total Pancreatectomy with Autologous Islet Cell Transplantation-The Current Indications. J Clin Med 2021; 10
  46. Andersen DK, Korc M, Petersen GM, Eibl G, Li D, Rickels MR, Chari ST, Abbruzzese JL. Diabetes, Pancreatogenic Diabetes, and Pancreatic Cancer. Diabetes 2017; 66:1103-1110
  47. Aggarwal G, Kamada P, Chari ST. Prevalence of diabetes mellitus in pancreatic cancer compared to common cancers. Pancreas 2013; 42:198-201
  48. Pannala R, Leirness JB, Bamlet WR, Basu A, Petersen GM, Chari ST. Prevalence and clinical profile of pancreatic cancer-associated diabetes mellitus. Gastroenterology 2008; 134:981-987
  49. Chari ST, Leibson CL, Rabe KG, Ransom J, de Andrade M, Petersen GM. Probability of pancreatic cancer following diabetes: a population-based study. Gastroenterology 2005; 129:504-511
  50. Damiano J, Bordier L, Le Berre JP, Margery J, Dupuy O, Mayaudon H, Bauduceau B. Should pancreas imaging be recommanded in patients over 50 years when diabetes is discovered because of acute symptoms? Diabetes Metab 2004; 30:203-207
  51. Hart PA, Kamada P, Rabe KG, Srinivasan S, Basu A, Aggarwal G, Chari ST. Weight loss precedes cancer-specific symptoms in pancreatic cancer-associated diabetes mellitus. Pancreas 2011; 40:768-772
  52. Song S, Wang B, Zhang X, Hao L, Hu X, Li Z, Sun S. Long-Term Diabetes Mellitus Is Associated with an Increased Risk of Pancreatic Cancer: A Meta-Analysis. PLoS One 2015; 10:e0134321
  53. Roy A, Sahoo J, Kamalanathan S, Naik D, Mohan P, Kalayarasan R. Diabetes and pancreatic cancer: Exploring the two-way traffic. World J Gastroenterol 2021; 27:4939-4962
  54. Permert J, Ihse I, Jorfeldt L, von Schenck H, Arnquist HJ, Larsson J. Improved glucose metabolism after subtotal pancreatectomy for pancreatic cancer. Br J Surg 1993; 80:1047-1050
  55. Litwin J, Dobrowolski S, Orlowska-Kunikowska E, Sledzinski Z. Changes in glucose metabolism after Kausch-Whipple pancreatectomy in pancreatic cancer and chronic pancreatitis patients. Pancreas 2008; 36:26-30
  56. Gardner TB, Hessami N, Smith KD, Ripple GH, Barth RJ, Klibansky DA, Colacchio TA, Zaki B, Tsapakos MJ, Suriawinata AA, Putra J, Tsongalis GJ, Mody K, Gordon SR, Pipas JM. The effect of neoadjuvant chemoradiation on pancreatic cancer-associated diabetes mellitus. Pancreas 2014; 43:1018-1021
  57. Zhou PT, Li B, Liu FR, Zhang MC, Wang Q, Li YY, Xu C, Liu YH, Yao Y, Li D. Metformin is associated with survival benefit in pancreatic cancer patients with diabetes: a systematic review and meta-analysis. Oncotarget2017; 8:25242-25250
  58. Jian-Yu E, Graber JM, Lu SE, Lin Y, Lu-Yao G, Tan XL. Effect of Metformin and Statin Use on Survival in Pancreatic Cancer Patients: a Systematic Literature Review and Meta-analysis. Curr Med Chem 2018; 25:2595-2607
  59. Wan G, Sun X, Li F, Wang X, Li C, Li H, Yu X, Cao F. Survival Benefit of Metformin Adjuvant Treatment For Pancreatic Cancer Patients: a Systematic Review and Meta-Analysis. Cell Physiol Biochem 2018; 49:837-847
  60. Reni M, Dugnani E, Cereda S, Belli C, Balzano G, Nicoletti R, Liberati D, Pasquale V, Scavini M, Maggiora P, Sordi V, Lampasona V, Ceraulo D, Di Terlizzi G, Doglioni C, Falconi M, Piemonti L. (Ir)relevance of Metformin Treatment in Patients with Metastatic Pancreatic Cancer: An Open-Label, Randomized Phase II Trial. Clin Cancer Res 2016; 22:1076-1085
  61. Kordes S, Pollak MN, Zwinderman AH, Mathot RA, Weterman MJ, Beeker A, Punt CJ, Richel DJ, Wilmink JW. Metformin in patients with advanced pancreatic cancer: a double-blind, randomised, placebo-controlled phase 2 trial. Lancet Oncol 2015; 16:839-847
  62. Kawabata H. The mechanisms of systemic iron homeostasis and etiology, diagnosis, and treatment of hereditary hemochromatosis. Int J Hematol 2018; 107:31-43
  63. Pelusi C, Gasparini DI, Bianchi N, Pasquali R. Endocrine dysfunction in hereditary hemochromatosis. J Endocrinol Invest 2016; 39:837-847
  64. Barton JC, Acton RT. Diabetes in HFE Hemochromatosis. J Diabetes Res 2017; 2017:9826930
  65. O'Sullivan EP, McDermott JH, Murphy MS, Sen S, Walsh CH. Declining prevalence of diabetes mellitus in hereditary haemochromatosis--the result of earlier diagnosis. Diabetes Res Clin Pract 2008; 81:316-320
  66. McClain DA, Abraham D, Rogers J, Brady R, Gault P, Ajioka R, Kushner JP. High prevalence of abnormal glucose homeostasis secondary to decreased insulin secretion in individuals with hereditary haemochromatosis. Diabetologia 2006; 49:1661-1669
  67. Simcox JA, McClain DA. Iron and diabetes risk. Cell Metab 2013; 17:329-341
  68. Toumba M, Sergis A, Kanaris C, Skordis N. Endocrine complications in patients with Thalassaemia Major. Pediatr Endocrinol Rev 2007; 5:642-648
  69. Gamberini MR, De Sanctis V, Gilli G. Hypogonadism, diabetes mellitus, hypothyroidism, hypoparathyroidism: incidence and prevalence related to iron overload and chelation therapy in patients with thalassaemia major followed from 1980 to 2007 in the Ferrara Centre. Pediatr Endocrinol Rev 2008; 6 Suppl 1:158-169
  70. Nelson RL, Baldus WP, Rubenstein AH, Go VL, Service FJ. Pancreatic alpha-cell function in diabetic hemochromatotic subjects. J Clin Endocrinol Metab 1979; 49:412-416
  71. Passa P, Luyckx AS, Carpentier JL, Lefebvre PJ, Canivet J. Glucagon secretion in diabetic patients with idiopathic haemochromatosis. Diabetologia 1977; 13:509-513
  72. Lassmann V, Passa P, Vague P, Vialettes B. Pancreatic polypeptide secretion in diabetic patients with idiopathic haemochromatosis. Diabete Metab 1987; 13:106-109
  73. Dymock IW, Cassar J, Pyke DA, Oakley WG, Williams R. Observations on the pathogenesis, complications and treatment of diabetes in 115 cases of haemochromatosis. Am J Med 1972; 52:203-210
  74. Griffiths JD, Dymock IW, Davies EW, Hill DW, Williams R. Occurrence and prevalence of diabetic retinopathy in hemochromatosis. Diabetes 1971; 20:766-770
  75. Becker D, Miller M. Presence of diabetic glomerulosclerosis in patients with hemochromatosis. N Engl J Med1960; 263:367-373
  76. Hatunic M, Finucane FM, Norris S, Pacini G, Nolan JJ. Glucose metabolism after normalization of markers of iron overload by venesection in subjects with hereditary hemochromatosis. Metabolism 2010; 59:1811-1815
  77. Buysschaert M, Paris I, Selvais P, Hermans MP. Clinical aspects of diabetes secondary to idiopathic haemochromatosis in French-speaking Belgium. Diabetes Metab 1997; 23:308-313
  78. Bomford A, Williams R. Long term results of venesection therapy in idiopathic haemochromatosis. Q J Med1976; 45:611-623
  79. Sferra TJ, Collins FS. The molecular biology of cystic fibrosis. Annu Rev Med 1993; 44:133-144
  80. Moran A, Becker D, Casella SJ, Gottlieb PA, Kirkman MS, Marshall BC, Slovis B, Committee CCC. Epidemiology, pathophysiology, and prognostic implications of cystic fibrosis-related diabetes: a technical review. Diabetes Care 2010; 33:2677-2683
  81. Yoon JC. Evolving Mechanistic Views and Emerging Therapeutic Strategies for Cystic Fibrosis-Related Diabetes. J Endocr Soc 2017; 1:1386-1400
  82. Kayani K, Mohammed R, Mohiaddin H. Cystic Fibrosis-Related Diabetes. Front Endocrinol (Lausanne) 2018; 9:20
  83. Bridges N, Rowe R, Holt RIG. Unique challenges of cystic fibrosis-related diabetes. Diabet Med 2018;
  84. American Diabetes Association Professional Practice Committee, Draznin B, Aroda VR, Bakris G, Benson G, Brown FM, Freeman R, Green J, Huang E, Isaacs D, Kahan S, Leon J, Lyons SK, Peters AL, Prahalad P, Reusch JEB, Young-Hyman D, Das S, Kosiborod M. 2. Classification and Diagnosis of Diabetes: Standards of Medical Care in Diabetes-2022. Diabetes Care 2022; 45:S17-S38
  85. Moran A, Brunzell C, Cohen RC, Katz M, Marshall BC, Onady G, Robinson KA, Sabadosa KA, Stecenko A, Slovis B. Clinical care guidelines for cystic fibrosis-related diabetes: a position statement of the American Diabetes Association and a clinical practice guideline of the Cystic Fibrosis Foundation, endorsed by the Pediatric Endocrine Society. Diabetes Care 2010; 33:2697-2708
  86. Moran A, Dunitz J, Nathan B, Saeed A, Holme B, Thomas W. Cystic fibrosis-related diabetes: current trends in prevalence, incidence, and mortality. Diabetes Care 2009; 32:1626-1631
  87. Hayes D, Jr., McCoy KS, Sheikh SI. Resolution of cystic fibrosis-related diabetes with ivacaftor therapy. Am J Respir Crit Care Med 2014; 190:590-591
  88. Gaines H, Jones KR, Lim J, Medhi NF, Chen S, Scofield RH. Effect of CFTR modulator therapy on cystic fibrosis-related diabetes. J Diabetes Complications 2021; 35:107845
  89. Volkova N, Moy K, Evans J, Campbell D, Tian S, Simard C, Higgins M, Konstan MW, Sawicki GS, Elbert A, Charman SC, Marshall BC, Bilton D. Disease progression in patients with cystic fibrosis treated with ivacaftor: Data from national US and UK registries. J Cyst Fibros 2020; 19:68-79
  90. Bellin MD, Laguna T, Leschyshyn J, Regelmann W, Dunitz J, Billings J, Moran A. Insulin secretion improves in cystic fibrosis following ivacaftor correction of CFTR: a small pilot study. Pediatr Diabetes 2013; 14:417-421
  91. Richardson SJ, Morgan NG. Enteroviral infections in the pathogenesis of type 1 diabetes: new insights for therapeutic intervention. Curr Opin Pharmacol 2018; 43:11-19
  92. Principi N, Berioli MG, Bianchini S, Esposito S. Type 1 diabetes and viral infections: What is the relationship? J Clin Virol 2017; 96:26-31
  93. Rodriguez-Calvo T, Sabouri S, Anquetil F, von Herrath MG. The viral paradigm in type 1 diabetes: Who are the main suspects? Autoimmun Rev 2016; 15:964-969
  94. Michels A, Gottlieb P. Pathogenesis of Type 1A Diabetes. In: Feingold KR, Anawalt B, Boyce A, Chrousos G, Dungan K, Grossman A, Hershman JM, Kaltsas G, Koch C, Kopp P, Korbonits M, McLachlan R, Morley JE, New M, Perreault L, Purnell J, Rebar R, Singer F, Trence DL, Vinik A, Wilson DP, eds. Endotext. South Dartmouth (MA)2000.
  95. VanBuecken D, Lord S, Greenbaum CJ. Changing the Course of Disease in Type 1 Diabetes. In: Feingold KR, Anawalt B, Boyce A, Chrousos G, Dungan K, Grossman A, Hershman JM, Kaltsas G, Koch C, Kopp P, Korbonits M, McLachlan R, Morley JE, New M, Perreault L, Purnell J, Rebar R, Singer F, Trence DL, Vinik A, Wilson DP, eds. Endotext. South Dartmouth (MA)2022.
  96. Yoon JW, Austin M, Onodera T, Notkins AL. Isolation of a virus from the pancreas of a child with diabetic ketoacidosis. N Engl J Med 1979; 300:1173-1179
  97. Gale EA. Congenital rubella: citation virus or viral cause of type 1 diabetes? Diabetologia 2008; 51:1559-1566
  98. Burgess MA, Forrest JM. Congenital rubella and diabetes mellitus. Diabetologia 2009; 52:369-370; author reply 373
  99. White DL, Ratziu V, El-Serag HB. Hepatitis C infection and risk of diabetes: a systematic review and meta-analysis. J Hepatol 2008; 49:831-844
  100. Fabiani S, Fallahi P, Ferrari SM, Miccoli M, Antonelli A. Hepatitis C virus infection and development of type 2 diabetes mellitus: Systematic review and meta-analysis of the literature. Rev Endocr Metab Disord 2018; 19:405-420
  101. Choi HY, Kim Y, Cho H, Kim BH, Ki M. Risk of diabetes in viral hepatitis B or C patients compared to that in noninfected individuals in Korea, 2002-2013: A population-based cohort study. J Viral Hepat 2018; 25:272-280
  102. Naing C, Mak JW, Ahmed SI, Maung M. Relationship between hepatitis C virus infection and type 2 diabetes mellitus: meta-analysis. World J Gastroenterol 2012; 18:1642-1651
  103. Lin YJ, Shaw TG, Yang HI, Lu SN, Jen CL, Wang LY, Wong KH, Chan SY, Yuan Y, L'Italien G, Chen CJ, Lee MH. Chronic hepatitis C virus infection and the risk for diabetes: a community-based prospective study. Liver Int 2017; 37:179-186
  104. Gastaldi G, Goossens N, Clement S, Negro F. Current level of evidence on causal association between hepatitis C virus and type 2 diabetes: A review. J Adv Res 2017; 8:149-159
  105. Guo X, Jin M, Yang M, Liu K, Li JW. Type 2 diabetes mellitus and the risk of hepatitis C virus infection: a systematic review. Sci Rep 2013; 3:2981
  106. Li X, Gao Y, Xu H, Hou J, Gao P. Diabetes mellitus is a significant risk factor for the development of liver cirrhosis in chronic hepatitis C patients. Sci Rep 2017; 7:9087
  107. Li X, Xu H, Gao Y, Pan M, Wang L, Gao P. Diabetes mellitus increases the risk of hepatocellular carcinoma in treatment-naive chronic hepatitis C patients in China. Medicine (Baltimore) 2017; 96:e6508
  108. Cao LH, Lu FM, Lu XJ, Zhu LY. Study on the relationship between insulin growth factor 1 and liver fibrosis in patients with chronic hepatitis C with type 2 diabetes mellitus. J Cell Biochem 2018; 119:9513-9518
  109. Colaci M, Malatino L, Antonelli A, Fallahi P, Giuggioli D, Ferri C. Endocrine disorders associated with hepatitis C virus chronic infection. Rev Endocr Metab Disord 2018; 19:397-403
  110. Vanni E, Bugianesi E, Saracco G. Treatment of type 2 diabetes mellitus by viral eradication in chronic hepatitis C: Myth or reality? Dig Liver Dis 2016; 48:105-111
  111. Delgado-Borrego A, Jordan SH, Negre B, Healey D, Lin W, Kamegaya Y, Christofi M, Ludwig DA, Lok AS, Chung RT, Halt CTG. Reduction of insulin resistance with effective clearance of hepatitis C infection: results from the HALT-C trial. Clin Gastroenterol Hepatol 2010; 8:458-462
  112. Hum J, Jou JH, Green PK, Berry K, Lundblad J, Hettinger BD, Chang M, Ioannou GN. Improvement in Glycemic Control of Type 2 Diabetes After Successful Treatment of Hepatitis C Virus. Diabetes Care 2017; 40:1173-1180
  113. Hsu YC, Lin JT, Ho HJ, Kao YH, Huang YT, Hsiao NW, Wu MS, Liu YY, Wu CY. Antiviral treatment for hepatitis C virus infection is associated with improved renal and cardiovascular outcomes in diabetic patients. Hepatology 2014; 59:1293-1302
  114. Lai SW, Chen PC, Liao KF, Muo CH, Lin CC, Sung FC. Risk of hepatocellular carcinoma in diabetic patients and risk reduction associated with anti-diabetic therapy: a population-based cohort study. Am J Gastroenterol2012; 107:46-52
  115. Nkontchou G, Cosson E, Aout M, Mahmoudi A, Bourcier V, Charif I, Ganne-Carrie N, Grando-Lemaire V, Vicaut E, Trinchet JC, Beaugrand M. Impact of metformin on the prognosis of cirrhosis induced by viral hepatitis C in diabetic patients. J Clin Endocrinol Metab 2011; 96:2601-2608
  116. Khunti K, Del Prato S, Mathieu C, Kahn SE, Gabbay RA, Buse JB. COVID-19, Hyperglycemia, and New-Onset Diabetes. Diabetes Care 2021; 44:2645-2655
  117. Sathish T, Kapoor N, Cao Y, Tapp RJ, Zimmet P. Proportion of newly diagnosed diabetes in COVID-19 patients: A systematic review and meta-analysis. Diabetes Obes Metab 2021; 23:870-874
  118. Carroll PV, Jenkins PJ. Acromegaly. In: Feingold KR, Anawalt B, Boyce A, Chrousos G, Dungan K, Grossman A, Hershman JM, Kaltsas G, Koch C, Kopp P, Korbonits M, McLachlan R, Morley JE, New M, Perreault L, Purnell J, Rebar R, Singer F, Trence DL, Vinik A, Wilson DP, eds. Endotext. South Dartmouth (MA)2000.
  119. Hannon AM, Thompson CJ, Sherlock M. Diabetes in Patients With Acromegaly. Curr Diab Rep 2017; 17:8
  120. Baroni MG, Giorgino F, Pezzino V, Scaroni C, Avogaro A. Italian Society for the Study of Diabetes (SID)/Italian Endocrinological Society (SIE) guidelines on the treatment of hyperglycemia in Cushing's syndrome and acromegaly. J Endocrinol Invest 2016; 39:235-255
  121. Frara S, Maffezzoni F, Mazziotti G, Giustina A. Current and Emerging Aspects of Diabetes Mellitus in Acromegaly. Trends Endocrinol Metab 2016; 27:470-483
  122. Alexopoulou O, Bex M, Kamenicky P, Mvoula AB, Chanson P, Maiter D. Prevalence and risk factors of impaired glucose tolerance and diabetes mellitus at diagnosis of acromegaly: a study in 148 patients. Pituitary2014; 17:81-89
  123. Lim CT, Khoo B. Normal Physiology of ACTH and GH Release in the Hypothalamus and Anterior Pituitary in Man. In: Feingold KR, Anawalt B, Boyce A, Chrousos G, Dungan K, Grossman A, Hershman JM, Kaltsas G, Koch C, Kopp P, Korbonits M, McLachlan R, Morley JE, New M, Perreault L, Purnell J, Rebar R, Singer F, Trence DL, Vinik A, Wilson DP, eds. Endotext. South Dartmouth (MA)2020.
  124. Yuen KCJ. Growth hormone Stimulation Tests in Assessing Adult Growth Hormone Deficiency. In: Feingold KR, Anawalt B, Boyce A, Chrousos G, Dungan K, Grossman A, Hershman JM, Kaltsas G, Koch C, Kopp P, Korbonits M, McLachlan R, Morley JE, New M, Perreault L, Purnell J, Rebar R, Singer F, Trence DL, Vinik A, Wilson DP, eds. Endotext. South Dartmouth (MA)2019.
  125. Gunawardane K, Krarup Hansen T, Sandahl Christiansen J, Lunde Jorgensen JO. Normal Physiology of Growth Hormone in Adults. In: Feingold KR, Anawalt B, Boyce A, Chrousos G, Dungan K, Grossman A, Hershman JM, Kaltsas G, Koch C, Kopp P, Korbonits M, McLachlan R, Morley JE, New M, Perreault L, Purnell J, Rebar R, Singer F, Trence DL, Vinik A, Wilson DP, eds. Endotext. South Dartmouth (MA)2000.
  126. Dutta P, Hajela A, Gupta P, Rai A, Sachdeva N, Mukherjee KK, Pathak A, Dhandapani S. The predictors of recovery from diabetes mellitus following neurosurgical treatment of acromegaly: A prospective study over a decade. Neurol India 2019; 67:757-762
  127. Mazziotti G, Floriani I, Bonadonna S, Torri V, Chanson P, Giustina A. Effects of somatostatin analogs on glucose homeostasis: a metaanalysis of acromegaly studies. J Clin Endocrinol Metab 2009; 94:1500-1508
  128. Gadelha MR, Bronstein MD, Brue T, Coculescu M, Fleseriu M, Guitelman M, Pronin V, Raverot G, Shimon I, Lievre KK, Fleck J, Aout M, Pedroncelli AM, Colao A, Pasireotide CSG. Pasireotide versus continued treatment with octreotide or lanreotide in patients with inadequately controlled acromegaly (PAOLA): a randomised, phase 3 trial. Lancet Diabetes Endocrinol 2014; 2:875-884
  129. Schmid HA, Brue T, Colao A, Gadelha MR, Shimon I, Kapur K, Pedroncelli AM, Fleseriu M. Effect of pasireotide on glucose- and growth hormone-related biomarkers in patients with inadequately controlled acromegaly. Endocrine 2016; 53:210-219
  130. Wass JA, Cudworth AG, Bottazzo GF, Woodrow JC, Besser GM. An assessment of glucose intolerance in acromegaly and its response to medical treatment. Clin Endocrinol (Oxf) 1980; 12:53-59
  131. Urbani C, Sardella C, Calevro A, Rossi G, Scattina I, Lombardi M, Lupi I, Manetti L, Martino E, Bogazzi F. Effects of medical therapies for acromegaly on glucose metabolism. Eur J Endocrinol 2013; 169:99-108
  132. Brue T, Lindberg A, Jan van der Lely A, Akerblad AC, Koltowska-Haggstrom M, Gomez R, Droste M, Hey-Hadavi J, Strasburger CJ, Camacho-Hubner C. Diabetes in patients with acromegaly treated with pegvisomant: observations from acrostudy. Endocrine 2019; 63:563-572
  133. Juszczak A, Morris D, Grossman A. Cushing's Syndrome. In: Feingold KR, Anawalt B, Boyce A, Chrousos G, de Herder WW, Dhatariya K, Dungan K, Hershman JM, Hofland J, Kalra S, Kaltsas G, Koch C, Kopp P, Korbonits M, Kovacs CS, Kuohung W, Laferrere B, Levy M, McGee EA, McLachlan R, Morley JE, New M, Purnell J, Sahay R, Singer F, Sperling MA, Stratakis CA, Trence DL, Wilson DP, eds. Endotext. South Dartmouth (MA)2021.
  134. Ferrau F, Korbonits M. Metabolic Syndrome in Cushing's Syndrome Patients. Front Horm Res 2018; 49:85-103
  135. Valassi E, Santos A, Yaneva M, Toth M, Strasburger CJ, Chanson P, Wass JA, Chabre O, Pfeifer M, Feelders RA, Tsagarakis S, Trainer PJ, Franz H, Zopf K, Zacharieva S, Lamberts SW, Tabarin A, Webb SM, Group ES. The European Registry on Cushing's syndrome: 2-year experience. Baseline demographic and clinical characteristics. Eur J Endocrinol 2011; 165:383-392
  136. Scaroni C, Zilio M, Foti M, Boscaro M. Glucose Metabolism Abnormalities in Cushing Syndrome: From Molecular Basis to Clinical Management. Endocr Rev 2017; 38:189-219
  137. Guarnotta V, Amato MC, Pivonello R, Arnaldi G, Ciresi A, Trementino L, Citarrella R, Iacuaniello D, Michetti G, Simeoli C, Colao A, Giordano C. The degree of urinary hypercortisolism is not correlated with the severity of cushing's syndrome. Endocrine 2017; 55:564-572
  138. Steffensen C, Pereira AM, Dekkers OM, Jorgensen JO. DIAGNOSIS OF ENDOCRINE DISEASE: Prevalence of hypercortisolism in type 2 diabetes patients: a systematic review and meta-analysis. Eur J Endocrinol 2016; 175:R247-R253
  139. Terzolo M, Reimondo G, Chiodini I, Castello R, Giordano R, Ciccarelli E, Limone P, Crivellaro C, Martinelli I, Montini M, Disoteo O, Ambrosi B, Lanzi R, Arosio M, Senni S, Balestrieri A, Solaroli E, Madeo B, De Giovanni R, Strollo F, Battista R, Scorsone A, Giagulli VA, Collura D, Scillitani A, Cozzi R, Faustini-Fustini M, Pia A, Rinaldi R, Allasino B, Peraga G, Tassone F, Garofalo P, Papini E, Borretta G. Screening of Cushing's syndrome in outpatients with type 2 diabetes: results of a prospective multicentric study in Italy. J Clin Endocrinol Metab 2012; 97:3467-3475
  140. Aresta C, Favero V, Morelli V, Giovanelli L, Parazzoli C, Falchetti A, Pugliese F, Gennari L, Vescini F, Salcuni A, Scillitani A, Persani L, Chiodini I. Cardiovascular complications of mild autonomous cortisol secretion. Best Pract Res Clin Endocrinol Metab 2021; 35:101494
  141. Elhassan YS, Alahdab F, Prete A, Delivanis DA, Khanna A, Prokop L, Murad MH, O'Reilly MW, Arlt W, Bancos I. Natural History of Adrenal Incidentalomas With and Without Mild Autonomous Cortisol Excess: A Systematic Review and Meta-analysis. Ann Intern Med 2019; 171:107-116
  142. Toniato A, Merante-Boschin I, Opocher G, Pelizzo MR, Schiavi F, Ballotta E. Surgical versus conservative management for subclinical Cushing syndrome in adrenal incidentalomas: a prospective randomized study. Ann Surg 2009; 249:388-391
  143. Sereg M, Szappanos A, Toke J, Karlinger K, Feldman K, Kaszper E, Varga I, Glaz E, Racz K, Toth M. Atherosclerotic risk factors and complications in patients with non-functioning adrenal adenomas treated with or without adrenalectomy: a long-term follow-up study. Eur J Endocrinol 2009; 160:647-655
  144. Chatzellis E, Kaltsas G. Adrenal Incidentalomas. In: Feingold KR, Anawalt B, Boyce A, Chrousos G, de Herder WW, Dhatariya K, Dungan K, Hershman JM, Hofland J, Kalra S, Kaltsas G, Koch C, Kopp P, Korbonits M, Kovacs CS, Kuohung W, Laferrere B, Levy M, McGee EA, McLachlan R, Morley JE, New M, Purnell J, Sahay R, Singer F, Sperling MA, Stratakis CA, Trence DL, Wilson DP, eds. Endotext. South Dartmouth (MA)2019.
  145. Yeo KT, Babic N, Hannoush ZC, Weiss RE. Endocrine Testing Protocols: Hypothalamic Pituitary Adrenal Axis. In: Feingold KR, Anawalt B, Boyce A, Chrousos G, Dungan K, Grossman A, Hershman JM, Kaltsas G, Koch C, Kopp P, Korbonits M, McLachlan R, Morley JE, New M, Perreault L, Purnell J, Rebar R, Singer F, Trence DL, Vinik A, Wilson DP, eds. Endotext. South Dartmouth (MA)2017.
  146. Gremlich S, Roduit R, Thorens B. Dexamethasone induces posttranslational degradation of GLUT2 and inhibition of insulin secretion in isolated pancreatic beta cells. Comparison with the effects of fatty acids. J Biol Chem 1997; 272:3216-3222
  147. Nicolaides NC, Pavlaki AN, Maria Alexandra MA, Chrousos GP. Glucocorticoid Therapy and Adrenal Suppression. In: Feingold KR, Anawalt B, Boyce A, Chrousos G, Dungan K, Grossman A, Hershman JM, Kaltsas G, Koch C, Kopp P, Korbonits M, McLachlan R, Morley JE, New M, Perreault L, Purnell J, Rebar R, Singer F, Trence DL, Vinik A, Wilson DP, eds. Endotext. South Dartmouth (MA)2018.
  148. Juszczak A, Morris D, Grossman A. Cushing's Syndrome. In: Feingold KR, Anawalt B, Boyce A, Chrousos G, Dungan K, Grossman A, Hershman JM, Kaltsas G, Koch C, Kopp P, Korbonits M, McLachlan R, Morley JE, New M, Perreault L, Purnell J, Rebar R, Singer F, Trence DL, Vinik A, Wilson DP, eds. Endotext. South Dartmouth (MA)2021.
  149. Feingold K, Brinton EA, Grunfeld C. The Effect of Endocrine Disorders on Lipids and Lipoproteins. In: Feingold KR, Anawalt B, Boyce A, Chrousos G, Dungan K, Grossman A, Hershman JM, Kaltsas G, Koch C, Kopp P, Korbonits M, McLachlan R, Morley JE, New M, Perreault L, Purnell J, Rebar R, Singer F, Trence DL, Vinik A, Wilson DP, eds. Endotext. South Dartmouth (MA)2020.
  150. Pacak K, Tella SH. Pheochromocytoma and Paraganglioma. In: Feingold KR, Anawalt B, Boyce A, Chrousos G, Dungan K, Grossman A, Hershman JM, Kaltsas G, Koch C, Kopp P, Korbonits M, McLachlan R, Morley JE, New M, Perreault L, Purnell J, Rebar R, Singer F, Trence DL, Vinik A, Wilson DP, eds. Endotext. South Dartmouth (MA)2018.
  151. Adlan MA, Bondugulapati LN, Premawardhana LD. Glucose intolerance and diabetes mellitus in endocrine disorders - two case reports and a review. Curr Diabetes Rev 2010; 6:266-273
  152. La Batide-Alanore A, Chatellier G, Plouin PF. Diabetes as a marker of pheochromocytoma in hypertensive patients. J Hypertens 2003; 21:1703-1707
  153. Beninato T, Kluijfhout WP, Drake FT, Lim J, Kwon JS, Xiong M, Shen WT, Gosnell JE, Liu C, Suh I, Duh QY. Resection of Pheochromocytoma Improves Diabetes Mellitus in the Majority of Patients. Ann Surg Oncol 2017; 24:1208-1213
  154. Douma S, Petidis K, Kartali N, Mahera K, Sabanis C, Zamboulis C. Pheochromocytoma presenting as diabetic ketoacidosis. J Diabetes Complications 2008; 22:295-296
  155. Deibert DC, DeFronzo RA. Epinephrine-induced insulin resistance in man. J Clin Invest 1980; 65:717-721
  156. Rizza RA, Cryer PE, Haymond MW, Gerich JE. Adrenergic mechanisms for the effects of epinephrine on glucose production and clearance in man. J Clin Invest 1980; 65:682-689
  157. Berkenstam A, Glaumann H, Martin M, Gustafsson JA, Norstedt G. Hormonal regulation of estrogen receptor messenger ribonucleic acid in T47Dco and MCF-7 breast cancer cells. Mol Endocrinol 1989; 3:22-28
  158. Halter JB, Beard JC, Porte D, Jr. Islet function and stress hyperglycemia: plasma glucose and epinephrine interaction. Am J Physiol 1984; 247:E47-52
  159. Khatiwada S, Agarwal S, Kandasamy D, Jyotsna VP, Kumar R, Kumar Bansal V, Pandey RM, Gupta N, Tandon N. Diabetes mellitus in pheochromocytoma and paraganglioma: Prevalence, dynamics of insulin secretion / sensitivity and predictors of remission. Diabetes Metab Syndr 2020; 14:2169-2175
  160. Chen Y, Hodin RA, Pandolfi C, Ruan DT, McKenzie TJ. Hypoglycemia after resection of pheochromocytoma. Surgery 2014; 156:1404-1408; discussion 1408-1409
  161. Diamanti-Kandarakis E, Zapanti E, Peridis MH, Ntavos P, Mastorakos G. Insulin resistance in pheochromocytoma improves more by surgical rather than by medical treatment. Hormones (Athens) 2003; 2:61-66
  162. Andersen OO, Friis T, Ottesen B. Glucose tolerance and insulin secretion in hyperthyroidism. Acta Endocrinol (Copenh) 1977; 84:576-587
  163. Kreines K, Jett M, Knowles HC, Jr. Observations in hyperthyroidism of abnormal glucose tolerance and other traits related to diabetes mellitus. Diabetes 1965; 14:740-744
  164. Yang L, Shen X, Yan S, Yuan X, Lu J, Wei W. HbA1c in the diagnosis of diabetes and abnormal glucose tolerance in patients with Graves' hyperthyroidism. Diabetes Res Clin Pract 2013; 101:28-34
  165. Mouradian M, Abourizk N. Diabetes mellitus and thyroid disease. Diabetes Care 1983; 6:512-520
  166. Sperling M, Angelousi A,Yau M. Autoimmune Polyglandular Syndromes. In: Feingold KR, Anawalt B, Boyce A, Chrousos G, Dungan K, Grossman A, Hershman JM, Kaltsas G, Koch C, Kopp P, Korbonits M, McLachlan R, Morley JE, New M, Perreault L, Purnell J, Rebar R, Singer F, Trence DL, Vinik A, Wilson DP, eds. Endotext. South Dartmouth (MA)2021.
  167. Zandee WT, Hofland J, de Herder WW. Glucagonoma Syndrome. In: Feingold KR, Anawalt B, Boyce A, Chrousos G, Dungan K, Grossman A, Hershman JM, Kaltsas G, Koch C, Kopp P, Korbonits M, McLachlan R, Morley JE, New M, Perreault L, Purnell J, Rebar R, Singer F, Trence DL, Vinik A, Wilson DP, eds. Endotext. South Dartmouth (MA)2020.
  168. Song X, Zheng S, Yang G, Xiong G, Cao Z, Feng M, Zhang T, Zhao Y. Glucagonoma and the glucagonoma syndrome. Oncol Lett 2018; 15:2749-2755
  169. Wewer Albrechtsen NJ, Kuhre RE, Pedersen J, Knop FK, Holst JJ. The biology of glucagon and the consequences of hyperglucagonemia. Biomark Med 2016; 10:1141-1151
  170. de Herder WW, Zandee WT, Hofland J. Somatostatinoma. In: Feingold KR, Anawalt B, Boyce A, Chrousos G, Dungan K, Grossman A, Hershman JM, Kaltsas G, Koch C, Kopp P, Korbonits M, McLachlan R, Morley JE, New M, Perreault L, Purnell J, Rebar R, Singer F, Trence DL, Vinik A, Wilson DP, eds. Endotext. South Dartmouth (MA)2021.
  171. Theodoraki A, Khoo B, Hamda A, Grillo F, Meyer T, Bouloux PM. Malignant somatostatinoma presenting with diabetic ketoacidosis and inhibitory syndrome: pathophysiologic considerations. Endocr Pract 2010; 16:835-837
  172. Monticone S, D'Ascenzo F, Moretti C, Williams TA, Veglio F, Gaita F, Mulatero P. Cardiovascular events and target organ damage in primary aldosteronism compared with essential hypertension: a systematic review and meta-analysis. Lancet Diabetes Endocrinol 2018; 6:41-50
  173. Sowers JR, Whaley-Connell A, Epstein M. Narrative review: the emerging clinical implications of the role of aldosterone in the metabolic syndrome and resistant hypertension. Ann Intern Med 2009; 150:776-783
  174. Feingold KR, Lee TH, Chung MY, Siperstein MD. Muscle capillary basement membrane width in patients with vacor-induced diabetes mellitus. J Clin Invest 1986; 78:102-107
  175. Elliott WJ, Meyer PM. Incident diabetes in clinical trials of antihypertensive drugs: a network meta-analysis. Lancet 2007; 369:201-207
  176. ALLHAT Officers, Coordinators for the Allhat Collaborative Research Group. Major outcomes in high-risk hypertensive patients randomized to angiotensin-converting enzyme inhibitor or calcium channel blocker vs diuretic: The Antihypertensive and Lipid-Lowering Treatment to Prevent Heart Attack Trial (ALLHAT). JAMA2002; 288:2981-2997
  177. Hirst JA, Farmer AJ, Feakins BG, Aronson JK, Stevens RJ. Quantifying the effects of diuretics and beta-adrenoceptor blockers on glycaemic control in diabetes mellitus - a systematic review and meta-analysis. Br J Clin Pharmacol 2015; 79:733-743
  178. Bangalore S, Parkar S, Grossman E, Messerli FH. A meta-analysis of 94,492 patients with hypertension treated with beta blockers to determine the risk of new-onset diabetes mellitus. Am J Cardiol 2007; 100:1254-1262
  179. Rizos CV, Elisaf MS. Antihypertensive drugs and glucose metabolism. World J Cardiol 2014; 6:517-530
  180. Fathallah N, Slim R, Larif S, Hmouda H, Ben Salem C. Drug-Induced Hyperglycaemia and Diabetes. Drug Saf2015; 38:1153-1168
  181. Verhaegen AA, Van Gaal LF. Drugs That Affect Body Weight, Body Fat Distribution, and Metabolism. In: Feingold KR, Anawalt B, Boyce A, Chrousos G, Dungan K, Grossman A, Hershman JM, Kaltsas G, Koch C, Kopp P, Korbonits M, McLachlan R, Morley JE, New M, Perreault L, Purnell J, Rebar R, Singer F, Trence DL, Vinik A, Wilson DP, eds. Endotext. South Dartmouth (MA)2019.
  182. Davis HA, Spanakis EK, Cryer PE, Davis SN. Hypoglycemia During Therapy of Diabetes. In: Feingold KR, Anawalt B, Boyce A, Chrousos G, Dungan K, Grossman A, Hershman JM, Kaltsas G, Koch C, Kopp P, Korbonits M, McLachlan R, Morley JE, New M, Perreault L, Purnell J, Rebar R, Singer F, Trence DL, Vinik A, Wilson DP, eds. Endotext. South Dartmouth (MA)2021.
  183. Koch-Weser J. Diazoxide. N Engl J Med 1976; 294:1271-1273
  184. de Herder WW, Zandee WT, Hofland J. Insulinoma. In: Feingold KR, Anawalt B, Boyce A, Chrousos G, Dungan K, Grossman A, Hershman JM, Kaltsas G, Koch C, Kopp P, Korbonits M, McLachlan R, Morley JE, New M, Perreault L, Purnell J, Rebar R, Singer F, Trence DL, Vinik A, Wilson DP, eds. Endotext. South Dartmouth (MA)2020.
  185. Sattar N, Preiss D, Murray HM, Welsh P, Buckley BM, de Craen AJ, Seshasai SR, McMurray JJ, Freeman DJ, Jukema JW, Macfarlane PW, Packard CJ, Stott DJ, Westendorp RG, Shepherd J, Davis BR, Pressel SL, Marchioli R, Marfisi RM, Maggioni AP, Tavazzi L, Tognoni G, Kjekshus J, Pedersen TR, Cook TJ, Gotto AM, Clearfield MB, Downs JR, Nakamura H, Ohashi Y, Mizuno K, Ray KK, Ford I. Statins and risk of incident diabetes: a collaborative meta-analysis of randomised statin trials. Lancet 2010; 375:735-742
  186. Preiss D, Seshasai SR, Welsh P, Murphy SA, Ho JE, Waters DD, DeMicco DA, Barter P, Cannon CP, Sabatine MS, Braunwald E, Kastelein JJ, de Lemos JA, Blazing MA, Pedersen TR, Tikkanen MJ, Sattar N, Ray KK. Risk of incident diabetes with intensive-dose compared with moderate-dose statin therapy: a meta-analysis. JAMA2011; 305:2556-2564
  187. Feingold KR. Cholesterol Lowering Drugs. In: Feingold KR, Anawalt B, Boyce A, Chrousos G, Dungan K, Grossman A, Hershman JM, Kaltsas G, Koch C, Kopp P, Korbonits M, McLachlan R, Morley JE, New M, Perreault L, Purnell J, Rebar R, Singer F, Trence DL, Vinik A, Wilson DP, eds. Endotext. South Dartmouth (MA)2021.
  188. Abbasi F, Lamendola C, Harris CS, Harris V, Tsai MS, Tripathi P, Abbas F, Reaven GM, Reaven PD, Snyder MP, Kim SH, Knowles JW. Statins Are Associated With Increased Insulin Resistance and Secretion. Arterioscler Thromb Vasc Biol 2021; 41:2786-2797
  189. Cederberg H, Stancakova A, Yaluri N, Modi S, Kuusisto J, Laakso M. Increased risk of diabetes with statin treatment is associated with impaired insulin sensitivity and insulin secretion: a 6 year follow-up study of the METSIM cohort. Diabetologia 2015; 58:1109-1117
  190. Carmena R, Betteridge DJ. Diabetogenic Action of Statins: Mechanisms. Curr Atheroscler Rep 2019; 21:23
  191. Goldie C, Taylor AJ, Nguyen P, McCoy C, Zhao XQ, Preiss D. Niacin therapy and the risk of new-onset diabetes: a meta-analysis of randomised controlled trials. Heart 2016; 102:198-203
  192. Feingold KR. Triglyceride Lowering Drugs. In: Feingold KR, Anawalt B, Boyce A, Chrousos G, Dungan K, Grossman A, Hershman JM, Kaltsas G, Koch C, Kopp P, Korbonits M, McLachlan R, Morley JE, New M, Perreault L, Purnell J, Rebar R, Singer F, Trence DL, Vinik A, Wilson DP, eds. Endotext. South Dartmouth (MA)2021.
  193. Shen M, Orwoll ES, Conte JE, Jr., Prince MJ. Pentamidine-induced pancreatic beta-cell dysfunction. Am J Med 1989; 86:726-728
  194. Bouchard P, Sai P, Reach G, Caubarrere I, Ganeval D, Assan R. Diabetes mellitus following pentamidine-induced hypoglycemia in humans. Diabetes 1982; 31:40-45
  195. Carter BL, Small RE, Mandel MD, Starkman MT. Phenytoin-induced hyperglycemia. Am J Hosp Pharm 1981; 38:1508-1512
  196. Gharib H, Munoz JM. Endocrine manifestations of diphenylhydantoin therapy. Metabolism 1974; 23:515-524
  197. Okanoue T, Sakamoto S, Itoh Y, Minami M, Yasui K, Sakamoto M, Nishioji K, Katagishi T, Nakagawa Y, Tada H, Sawa Y, Mizuno M, Kagawa K, Kashima K. Side effects of high-dose interferon therapy for chronic hepatitis C. J Hepatol 1996; 25:283-291
  198. Zornitzki T, Malnick S, Lysyy L, Knobler H. Interferon therapy in hepatitis C leading to chronic type 1 diabetes. World J Gastroenterol 2015; 21:233-239
  199. Lombardi A, Tsomos E, Hammerstad SS, Tomer Y. Interferon alpha: The key trigger of type 1 diabetes. J Autoimmun 2018; 94:7-15
  200. Barroso-Sousa R, Barry WT, Garrido-Castro AC, Hodi FS, Min L, Krop IE, Tolaney SM. Incidence of Endocrine Dysfunction Following the Use of Different Immune Checkpoint Inhibitor Regimens: A Systematic Review and Meta-analysis. JAMA Oncol 2018; 4:173-182
  201. de Filette J, Andreescu CE, Cools F, Bravenboer B, Velkeniers B. A Systematic Review and Meta-Analysis of Endocrine-Related Adverse Events Associated with Immune Checkpoint Inhibitors. Horm Metab Res 2019; 51:145-156
  202. Venetsanaki V, Boutis A, Chrisoulidou A, Papakotoulas P. Diabetes mellitus secondary to treatment with immune checkpoint inhibitors. Curr Oncol 2019; 26:e111-e114
  203. Elshimy G, Raj R, Akturk HK, Schriber A, Sisterna N, Ahmad I, Jacob A, Michels AW, Correa R. Immune Checkpoint Inhibitors Related Endocrine Adverse Events. In: Feingold KR, Anawalt B, Boyce A, Chrousos G, de Herder WW, Dhatariya K, Dungan K, Hershman JM, Hofland J, Kalra S, Kaltsas G, Koch C, Kopp P, Korbonits M, Kovacs CS, Kuohung W, Laferrere B, Levy M, McGee EA, McLachlan R, Morley JE, New M, Purnell J, Sahay R, Singer F, Sperling MA, Stratakis CA, Trence DL, Wilson DP, eds. Endotext. South Dartmouth (MA)2022.
  204. Whicher CA, Price HC, Holt RIG. Mechanisms in endocrinology: Antipsychotic medication and type 2 diabetes and impaired glucose regulation. Eur J Endocrinol 2018; 178:R245-R258
  205. Holt RIG. Association Between Antipsychotic Medication Use and Diabetes. Curr Diab Rep 2019; 19:96
  206. Rummel-Kluge C, Komossa K, Schwarz S, Hunger H, Schmid F, Lobos CA, Kissling W, Davis JM, Leucht S. Head-to-head comparisons of metabolic side effects of second generation antipsychotics in the treatment of schizophrenia: a systematic review and meta-analysis. Schizophr Res 2010; 123:225-233
  207. Citrome L, Kalsekar I, Baker RA, Hebden T. A review of real-world data on the effects of aripiprazole on weight and metabolic outcomes in adults. Curr Med Res Opin 2014; 30:1629-1641
  208. Chen J, Huang XF, Shao R, Chen C, Deng C. Molecular Mechanisms of Antipsychotic Drug-Induced Diabetes. Front Neurosci 2017; 11:643
  209. Tzortzis V, Samarinas M, Zachos I, Oeconomou A, Pisters LL, Bargiota A. Adverse effects of androgen deprivation therapy in patients with prostate cancer: focus on metabolic complications. Hormones (Athens)2017; 16:115-123
  210. Tsai HT, Keating NL, Van Den Eeden SK, Haque R, Cassidy-Bushrow AE, Ulcickas Yood M, Smith MR, Potosky AL. Risk of diabetes among patients receiving primary androgen deprivation therapy for clinically localized prostate cancer. J Urol 2015; 193:1956-1962
  211. Pham PT, Sidhu HS, Pham PM, Pham PC. Diabetes Mellitus After Solid Organ Transplantation. In: Feingold KR, Anawalt B, Boyce A, Chrousos G, Dungan K, Grossman A, Hershman JM, Kaltsas G, Koch C, Kopp P, Korbonits M, McLachlan R, Morley JE, New M, Perreault L, Purnell J, Rebar R, Singer F, Trence DL, Vinik A, Wilson DP, eds. Endotext. South Dartmouth (MA)2019.
  212. Chakkera HA, Kudva Y, Kaplan B. Calcineurin Inhibitors: Pharmacologic Mechanisms Impacting Both Insulin Resistance and Insulin Secretion Leading to Glucose Dysregulation and Diabetes Mellitus. Clin Pharmacol Ther 2017; 101:114-120
  213. Verges B. mTOR and Cardiovascular Diseases: Diabetes Mellitus. Transplantation 2018; 102:S47-S49
  214. Ahmad MH, Shafiq I. Diabetic ketoacidosis following PEG-asparaginase therapy. Endocrinol Diabetes Metab Case Rep 2018; 2018:18-0064
  215. Pui CH, Burghen GA, Bowman WP, Aur RJ. Risk factors for hyperglycemia in children with leukemia receiving L-asparaginase and prednisone. J Pediatr 1981; 99:46-50
  216. Guglielmi C, Palermo A, Pozzilli P. Latent autoimmune diabetes in the adults (LADA) in Asia: from pathogenesis and epidemiology to therapy. Diabetes Metab Res Rev 2012; 28 Suppl 2:40-46
  217. Kumar A, de Leiva A. Latent autoimmune diabetes in adults (LADA) in Asian and European populations. Diabetes Metab Res Rev 2017; 33
  218. Tuomi T, Santoro N, Caprio S, Cai M, Weng J, Groop L. The many faces of diabetes: a disease with increasing heterogeneity. Lancet 2014; 383:1084-1094
  219. Naik RG, Brooks-Worrell BM, Palmer JP. Latent autoimmune diabetes in adults. J Clin Endocrinol Metab 2009; 94:4635-4644
  220. Fourlanos S, Perry C, Stein MS, Stankovich J, Harrison LC, Colman PG. A clinical screening tool identifies autoimmune diabetes in adults. Diabetes Care 2006; 29:970-975
  221. Buzzetti R, Tuomi T, Mauricio D, Pietropaolo M, Zhou Z, Pozzilli P, Leslie RD. Management of Latent Autoimmune Diabetes in Adults: A Consensus Statement From an International Expert Panel. Diabetes 2020; 69:2037-2047
  222. Jones AG, McDonald TJ, Shields BM, Hagopian W, Hattersley AT. Latent Autoimmune Diabetes of Adults (LADA) Is Likely to Represent a Mixed Population of Autoimmune (Type 1) and Nonautoimmune (Type 2) Diabetes. Diabetes Care 2021; 44:1243-1251
  223. Brophy S, Davies H, Mannan S, Brunt H, Williams R. Interventions for latent autoimmune diabetes (LADA) in adults. Cochrane Database Syst Rev 2011:CD006165
  224. Maddaloni E, Coleman RL, Agbaje O, Buzzetti R, Holman RR. Time-varying risk of microvascular complications in latent autoimmune diabetes of adulthood compared with type 2 diabetes in adults: a post-hoc analysis of the UK Prospective Diabetes Study 30-year follow-up data (UKPDS 86). Lancet Diabetes Endocrinol 2020; 8:206-215
  225. Isomaa B, Almgren P, Henricsson M, Taskinen MR, Tuomi T, Groop L, Sarelin L. Chronic complications in patients with slowly progressing autoimmune type 1 diabetes (LADA). Diabetes Care 1999; 22:1347-1353
  226. Maddaloni E, Coleman RL, Pozzilli P, Holman RR. Long-term risk of cardiovascular disease in individuals with latent autoimmune diabetes in adults (UKPDS 85). Diabetes Obes Metab 2019; 21:2115-2122
  227. McKeon A, Robinson MT, McEvoy KM, Matsumoto JY, Lennon VA, Ahlskog JE, Pittock SJ. Stiff-man syndrome and variants: clinical course, treatments, and outcomes. Arch Neurol 2012; 69:230-238
  228. Rathbun JT, Imber J. Stiff Person Syndrome and Type 1 Diabetes Mellitus: a Case of the Chicken or the Egg? J Gen Intern Med 2019;
  229. Arioglu E, Andewelt A, Diabo C, Bell M, Taylor SI, Gorden P. Clinical course of the syndrome of autoantibodies to the insulin receptor (type B insulin resistance): a 28-year perspective. Medicine (Baltimore) 2002; 81:87-100
  230. Klubo-Gwiezdzinska J, Lange M, Cochran E, Semple RK, Gewert C, Brown RJ, Gorden P. Combined Immunosuppressive Therapy Induces Remission in Patients With Severe Type B Insulin Resistance: A Prospective Cohort Study. Diabetes Care 2018; 41:2353-2360
  231. Lebovitz HE, Banerji MA. Ketosis-Prone Diabetes (Flatbush Diabetes): an Emerging Worldwide Clinically Important Entity. Curr Diab Rep 2018; 18:120
  232. Umpierrez GE, Smiley D, Kitabchi AE. Narrative review: ketosis-prone type 2 diabetes mellitus. Ann Intern Med 2006; 144:350-357
  233. Smiley D, Chandra P, Umpierrez GE. Update on diagnosis, pathogenesis and management of ketosis-prone Type 2 diabetes mellitus. Diabetes Manag (Lond) 2011; 1:589-600
  234. Whooten R, Schmitt J, Schwartz A. Endocrine manifestations of Down syndrome. Curr Opin Endocrinol Diabetes Obes 2018; 25:61-66
  235. Guaraldi F, Rossetto Giaccherino R, Lanfranco F, Motta G, Gori D, Arvat E, Ghigo E, Giordano R. Endocrine Autoimmunity in Down's Syndrome. Front Horm Res 2017; 48:133-146
  236. Anwar AJ, Walker JD, Frier BM. Type 1 diabetes mellitus and Down's syndrome: prevalence, management and diabetic complications. Diabet Med 1998; 15:160-163
  237. Bergholdt R, Eising S, Nerup J, Pociot F. Increased prevalence of Down's syndrome in individuals with type 1 diabetes in Denmark: A nationwide population-based study. Diabetologia 2006; 49:1179-1182
  238. Aitken RJ, Mehers KL, Williams AJ, Brown J, Bingley PJ, Holl RW, Rohrer TR, Schober E, Abdul-Rasoul MM, Shield JP, Gillespie KM. Early-onset, coexisting autoimmunity and decreased HLA-mediated susceptibility are the characteristics of diabetes in Down syndrome. Diabetes Care 2013; 36:1181-1185
  239. Behre HM, Bergmann M, Simoni M, Tuttelmann F. Primary Testicular Failure. In: Feingold KR, Anawalt B, Boyce A, Chrousos G, Dungan K, Grossman A, Hershman JM, Kaltsas G, Koch C, Kopp P, Korbonits M, McLachlan R, Morley JE, New M, Perreault L, Purnell J, Rebar R, Singer F, Trence DL, Vinik A, Wilson DP, eds. Endotext. South Dartmouth (MA)2015.
  240. Salzano A, D'Assante R, Heaney LM, Monaco F, Rengo G, Valente P, Pasquali D, Bossone E, Gianfrilli D, Lenzi A, Cittadini A, Marra AM, Napoli R. Klinefelter syndrome, insulin resistance, metabolic syndrome, and diabetes: review of literature and clinical perspectives. Endocrine 2018; 61:194-203
  241. Gravholt CH, Chang S, Wallentin M, Fedder J, Moore P, Skakkebaek A. Klinefelter Syndrome: Integrating Genetics, Neuropsychology, and Endocrinology. Endocr Rev 2018; 39:389-423
  242. Bojesen A, Juul S, Birkebaek NH, Gravholt CH. Morbidity in Klinefelter syndrome: a Danish register study based on hospital discharge diagnoses. J Clin Endocrinol Metab 2006; 91:1254-1260
  243. Panimolle F, Tiberti C, Granato S, Semeraro A, Gianfrilli D, Anzuini A, Lenzi A, Radicioni A. Screening of endocrine organ-specific humoral autoimmunity in 47,XXY Klinefelter's syndrome reveals a significant increase in diabetes-specific immunoreactivity in comparison with healthy control men. Endocrine 2016; 52:157-164
  244. Sybert VP, McCauley E. Turner's syndrome. N Engl J Med 2004; 351:1227-1238
  245. Gravholt CH, Juul S, Naeraa RW, Hansen J. Morbidity in Turner syndrome. J Clin Epidemiol 1998; 51:147-158
  246. Sun L, Wang Y, Zhou T, Zhao X, Wang Y, Wang G, Gang X. Glucose Metabolism in Turner Syndrome. Front Endocrinol (Lausanne) 2019; 10:49
  247. Gravholt CH, Andersen NH, Conway GS, Dekkers OM, Geffner ME, Klein KO, Lin AE, Mauras N, Quigley CA, Rubin K, Sandberg DE, Sas TCJ, Silberbach M, Soderstrom-Anttila V, Stochholm K, van Alfen-van derVelden JA, Woelfle J, Backeljauw PF, International Turner Syndrome Consensus Group. Clinical practice guidelines for the care of girls and women with Turner syndrome: proceedings from the 2016 Cincinnati International Turner Syndrome Meeting. Eur J Endocrinol 2017; 177:G1-G70
  248. Bakalov VK, Cheng C, Zhou J, Bondy CA. X-chromosome gene dosage and the risk of diabetes in Turner syndrome. J Clin Endocrinol Metab 2009; 94:3289-3296
  249. Mortensen KH, Cleemann L, Hjerrild BE, Nexo E, Locht H, Jeppesen EM, Gravholt CH. Increased prevalence of autoimmunity in Turner syndrome--influence of age. Clin Exp Immunol 2009; 156:205-210
  250. Sheanon N, Elder D, Khoury J, Casnellie L, Gutmark-Little I, Cernich J, Backeljauw PF. Increased Prevalence of Beta-Cell Dysfunction despite Normal HbA1c in Youth and Young Adults with Turner Syndrome. Horm Res Paediatr 2021; 94:297-306
  251. Stanley TL, Leong A, Pober BR. Growth, body composition, and endocrine issues in Williams syndrome. Curr Opin Endocrinol Diabetes Obes 2021; 28:64-74
  252. Kozel BA, Barak B, Kim CA, Mervis CB, Osborne LR, Porter M, Pober BR. Williams syndrome. Nat Rev Dis Primers 2021; 7:42
  253. Morris CA. Williams Syndrome. In: Adam MP, Ardinger HH, Pagon RA, Wallace SE, Bean LJH, Gripp KW, Mirzaa GM, Amemiya A, eds. GeneReviews((R)). Seattle (WA)2017.
  254. Urano F. Wolfram Syndrome: Diagnosis, Management, and Treatment. Curr Diab Rep 2016; 16:6
  255. Rigoli L, Bramanti P, Di Bella C, De Luca F. Genetic and clinical aspects of Wolfram syndrome 1, a severe neurodegenerative disease. Pediatr Res 2018; 83:921-929
  256. Ray MK, Chen L, White NH, Ni R, Hershey T, Marshall BA. Longitudinal progression of diabetes mellitus in Wolfram syndrome: The Washington University Wolfram Research Clinic experience. Pediatr Diabetes 2022; 23:212-218
  257. Bidichandani SI, Delatycki MB. Friedreich Ataxia. In: Adam MP, Ardinger HH, Pagon RA, Wallace SE, Bean LJH, Stephens K, Amemiya A, eds. GeneReviews((R)). Seattle (WA)1993.
  258. Pappa A, Hausler MG, Veigel A, Tzamouranis K, Pfeifer MW, Schmidt A, Bokamp M, Haberland H, Wagner S, Bruckel J, de Sousa G, Hackl L, Bollow E, Holl RW. Diabetes mellitus in Friedreich Ataxia: A case series of 19 patients from the German-Austrian diabetes mellitus registry. Diabetes Res Clin Pract 2018; 141:229-236
  259. Cnop M, Mulder H, Igoillo-Esteve M. Diabetes in Friedreich ataxia. J Neurochem 2013; 126 Suppl 1:94-102
  260. Pandey M, Rajamma U. Huntington's disease: the coming of age. J Genet 2018; 97:649-664
  261. Montojo MT, Aganzo M, Gonzalez N. Huntington's Disease and Diabetes: Chronological Sequence of its Association. J Huntingtons Dis 2017; 6:179-188
  262. Farrer LA. Diabetes mellitus in Huntington disease. Clin Genet 1985; 27:62-67
  263. Ristow M. Neurodegenerative disorders associated with diabetes mellitus. J Mol Med (Berl) 2004; 82:510-529
  264. Winters SJ. Endocrine Dysfunction in Patients With Myotonic Dystrophy. J Clin Endocrinol Metab 2021; 106:2819-2827
  265. Alsaggaf R, Pfeiffer RM, Wang Y, St George DMM, Zhan M, Wagner KR, Amr S, Greene MH, Gadalla SM. Diabetes, metformin and cancer risk in myotonic dystrophy type I. Int J Cancer 2020; 147:785-792
  266. Lee JY, Jeong HN. Nationwide incidence of myotonic dystrophy type 1 and the status of multi-organ involvement. J Neurol 2021;
  267. Abe H, Mita T, Kudo K, Funayama T, Tokoro M, Kaga H, Ikeda F, Kanazawa A, Hirose T, Kawamori R, Watada H. Dramatic improvement of blood glucose control after pioglitazone treatment in poorly controlled over-weight diabetic patients with myotonic dystrophy. Endocr J 2009; 56:911-913
  268. Takeshima K, Ariyasu H, Ishibashi T, Kawai S, Uraki S, Koh J, Ito H, Akamizu T. Myotonic dystrophy type 1 with diabetes mellitus, mixed hypogonadism and adrenal insufficiency. Endocrinol Diabetes Metab Case Rep2018; 2018
  269. Tsang SH, Aycinena ARP, Sharma T. Ciliopathy: Bardet-Biedl Syndrome. Adv Exp Med Biol 2018; 1085:171-174
  270. Mujahid S, Hunt KF, Cheah YS, Forsythe E, Hazlehurst JM, Sparks K, Mohammed S, Tomlinson JW, Amiel SA, Carroll PV, Beales PL, Huda MSB, McGowan BM. The Endocrine and Metabolic Characteristics of a Large Bardet-Biedl Syndrome Clinic Population. J Clin Endocrinol Metab 2018; 103:1834-1841
  271. Driscoll DJ, Miller JL, Schwartz S, Cassidy SB. Prader-Willi Syndrome. In: Adam MP, Ardinger HH, Pagon RA, Wallace SE, Bean LJH, Stephens K, Amemiya A, eds. GeneReviews((R)). Seattle (WA)1993.
  272. Clerc A, Coupaye M, Mosbah H, Pinto G, Laurier V, Mourre F, Merrien C, Diene G, Poitou C, Tauber M. Diabetes Mellitus in Prader-Willi Syndrome: Natural History during the Transition from Childhood to Adulthood in a Cohort of 39 Patients. J Clin Med 2021; 10
  273. Chan NN, Feher MD, Bridges NA. Metformin therapy for diabetes in Prader-Willi syndrome. J R Soc Med1998; 91:598
  274. Ng NBH, Low YW, Rajgor DD, Low JM, Lim YY, Loke KY, Lee YS. The effects of glucagon-like peptide (GLP)-1 receptor agonists on weight and glycaemic control in Prader-Willi syndrome: A systematic review. Clin Endocrinol (Oxf) 2022; 96:144-154
  275. Marshall JD, Maffei P, Collin GB, Naggert JK. Alstrom syndrome: genetics and clinical overview. Curr Genomics 2011; 12:225-235
  276. Hearn T. ALMS1 and Alstrom syndrome: a recessive form of metabolic, neurosensory and cardiac deficits. J Mol Med (Berl) 2019; 97:1-17
  277. Dassie F, Favaretto F, Bettini S, Parolin M, Valenti M, Reschke F, Danne T, Vettor R, Milan G, Maffei P. Alstrom syndrome: an ultra-rare monogenic disorder as a model for insulin resistance, type 2 diabetes mellitus and obesity. Endocrine 2021; 71:618-625
  278. Marshall JD, Bronson RT, Collin GB, Nordstrom AD, Maffei P, Paisey RB, Carey C, Macdermott S, Russell-Eggitt I, Shea SE, Davis J, Beck S, Shatirishvili G, Mihai CM, Hoeltzenbein M, Pozzan GB, Hopkinson I, Sicolo N, Naggert JK, Nishina PM. New Alstrom syndrome phenotypes based on the evaluation of 182 cases. Arch Intern Med 2005; 165:675-683
  279. Tahani N, Maffei P, Dollfus H, Paisey R, Valverde D, Milan G, Han JC, Favaretto F, Madathil SC, Dawson C, Armstrong MJ, Warfield AT, Duzenli S, Francomano CA, Gunay-Aygun M, Dassie F, Marion V, Valenti M, Leeson-Beevers K, Chivers A, Steeds R, Barrett T, Geberhiwot T. Consensus clinical management guidelines for Alstrom syndrome. Orphanet J Rare Dis 2020; 15:253
  280. Christiansen AL, Bygum A, Hother-Nielsen O, Rasmussen LM. Diagnosing diabetes mellitus in patients with porphyria cutanea tarda. Int J Dermatol 2018; 57:763-769
  281. Bissell DM, Anderson KE, Bonkovsky HL. Porphyria. N Engl J Med 2017; 377:862-872
  282. Singal AK. Porphyria cutanea tarda: Recent update. Mol Genet Metab 2019; Nov;128(3):271-281

New Osteoporosis / Vertebral Compression Fractures

CLINICAL RECOGNITION


Osteoporosis is a prevalent disease characterized by reduced bone mass and architectural deterioration, which leads to structurally weakened bone and an increased risk of fragility fractures. A fragility fracture is defined as a fracture occurring with minimal trauma, such as falling from standing height. These fractures rise exponentially with age and most commonly involve the spine, hip, humerus, and wrist. Vertebral compression fractures are the most common osteoporotic fractures with an estimated 700,000 per year in the United States (1). However, most patients with vertebral fractures are unaware that they have fractured as only ~1/3rd are clinically diagnosed. While there are effective treatments to reduce the risk of fractures, only 23% of patients with fragility fractures receive osteoporosis evaluation and treatment.


PATHOPHYSIOLOGY


Bone is a dynamic organ with continuous remodeling to maintain a healthy skeleton—osteoclasts resorb bone and osteoblasts form new bone (2). Osteoporosis results from a net increase in bone resorption relative to bone formation. The receptor activator of nuclear factor-kappa β (RANK), RANK ligand (RANKL), and osteoprotegerin (OPG) are key regulators of bone resorption. Interaction between RANKL and RANK stimulates osteoclastic differentiation, while OPG, made by osteoblasts, binds with RANKL and inhibits bone resorption. In addition, the Wnt signaling pathway is a network of proteins that is involved in activating the transcription of genes that direct the differentiation and proliferation of osteoblasts. Sclerostin, produced by the osteocytes embedded in bone, is the product of the SOST gene. Sclerostin reduces the Wnt signaling pathway, thereby, suppressing bone formation by osteoblasts. Some of the key factors that are mechanistically involved in bone turnover are therapeutic targets for osteoporosis treatment. See Table 4 for summary of treatments.


Fragility Fractures


Vertebral compression fractures are associated with substantial morbidity including: acute and chronic back pain, height loss, kyphosis, restrictive lung disease, early satiety, reduced quality of life, and increased mortality (1). A spine fracture is associated with a 5-fold risk of a subsequent spine fracture and a 2-fold risk of hip and other fractures. Hip fractures are serious fractures that can lead to pain, disability, loss of independence, and high mortality. A Danish registry study published in 2018 found that one-year excess mortality was 20-25% after femur or pelvic, 10% following vertebral, and 5-10% following humerus fractures.


There is a high prevalence of low vitamin D levels among hip fracture patients. Since there is a large care gap for patients with fragility fractures, there are critical ongoing efforts to try to implement inter-disciplinary, hospital-based approaches to advance fracture care. It is imperative to ensure timely outpatient follow-up to correct the vitamin D deficiency, evaluate patients for other secondary causes of osteoporosis, and institute osteoporosis treatment. See Treatment section for further description of management of these fractures.


DIAGNOSIS and DIFFERENTIAL


Assessment of osteoporosis risk factors and measurement of bone mineral density (BMD) by dual energy x-ray absorptiometry (DXA) are important to determine which individuals are at increased risk of fractures. Low bone mass (osteopenia) is present when the BMD is between 1.0 and 2.5 SDs below peak bone density of young, healthy individuals. More than 50% of fragility fractures occur in these patients. Osteoporosis, according to the World Health Organization, is defined as a BMD ≤-2.5 SDs of young normal. BMD testing is typically measured at the proximal femur and lumbar spine, though the 1/3 radius should be measured in patients with hyperparathyroidism (https://www.iscd.org/official-positions/). The Bone Health & Osteoporosis Foundation (BHOF; formerly the National Osteoporosis Foundation) currently recommends that women >65 years, men >70 years, and postmenopausal women and men >50 years with risk factors or fracture after age 50 receive screening DXA scans (3). The BHOF recommends monitoring osteoporosis by an annual measurement of a patient’s height, preferably with a mounted stadiometer, and BMD testing 1-2 years after initiating therapy and every 2 years thereafter. Because spine fractures are often not clinically evident, imaging for spine fractures (vertebral fracture assessment by DXA or X-ray) is recommended, particularly in older adults with osteopenia and after adult-age fracture (>50 years of age), glucocorticoid use, or diagnosis of hyperparathyroidism (See Table 1) (3, 4).


The FRAX® calculator was designed to quantify an individual’s absolute fracture risk (http://www.shef.ac.uk/FRAX). In addition to BMD, the following risk factors are included—ethnicity, age, body mass index, prior fracture history, glucocorticoid use, alcohol use, smoking, rheumatoid arthritis, and other secondary causes of osteoporosis. If the 10-year absolute fracture risk is ≥3% for hip fractures or ≥20% for other major osteoporotic fractures, pharmacologic therapy should be considered. Note that the FRAX calculator is not designed for those with osteoporosis on BMD testing but mainly for those with low bone mass.


Using a specialized software (incorporated in DXA machines), Trabecular Bone Score (TBS) can be generated from lumbar spine DXA images and is a measure that reflects bone microarchitecture and predicts fracture risk independent of bone density. TBS can now also be incorporated in the FRAX score.


Table 1. Imaging Assessment Recommendations

DXA Tests:
Women aged ≥65 and older men aged ≥70
Younger postmenopausal women and men aged 50-69 with risk factors for bone loss or fractures
Adults who have a fracture at age ≥50
Adults with a medical condition or taking a medication associated with bone loss and/or fractures

Vertebral Imaging Tests:
Women aged ≥65 if T-score is ≤ -1.0 at the femoral neck

Women aged ≥70 and men aged ≥80 if T-score is ≤ -1.0 at the lumbar spine, total hip, or femoral neck 
Men aged 70-79 if T-score is ≤ -1.5 at the lumbar spine, total hip, or femoral neck
Postmenopausal women and men aged ≥50 with specific risk factors:

-        Fracture(s) during adulthood (age ≥50) from any cause

-        Historical height loss of ≥1.5 inches (4 cm)

-        Prospective/interval height loss of ≥0.8 inches (2 cm)

-        Glucocorticoid therapy

-        Hyperparathyroidism


When the diagnosis of a low bone density is made, a work-up to look for secondary causes of osteoporosis should be considered. See Table 2.


Table 2. Secondary Causes of Osteoporosis

Endocrinological Abnormalities

Glucocorticoid excess, hyperthyroidism, hypogonadism, anorexia, prolactinoma, hyperparathyroidism

Hematologic Disorders

Multiple myeloma, mastocytosis, leukemia

Renal Disease

Metabolic bone disease, nephrolithiasis

Connective Tissue Disorders

Osteogenesis Imperfecta, Ehlers-Danlos syndrome

Gastrointestinal Diseases

Celiac disease, inflammatory bowel disease, post-gastrectomy, bariatric surgery

Rheumatological Disorders

Ankylosing spondylitis, rheumatoid arthritis

Medications

Glucocorticoids, cyclophosphamide, aromatase inhibitors, heparin, methotrexate, androgen deprivation therapy, gonadotropin releasing hormone agonists, proton-pump inhibitors, selective serotonin reuptake inhibitors


Laboratory evaluation may include the following: calcium, phosphorus, liver tests (including alkaline phosphatase), CBC, 25-hydroxyvitamin D, 24-hour urine calcium, +/- parathyroid hormone, and thyroid stimulating hormone (if clinical evidence of hyperthyroidism or those already on thyroid hormone replacement), and serum testosterone level in men. For select cases one may consider obtaining specialized tests for gastrointestinal disorders (tissue transglutaminase for celiac disease with an IgA level), infiltrative diseases (serum tryptase for mastocytosis), neoplastic (serum and urine protein electrophoresis), or excess glucocorticoid (24-hour urine cortisol, dexamethasone suppression test).


TREATMENT


Fractures


The management of a vertebral compression fracture involves both pharmacologic and non-pharmacologic approaches. The acute pain typically subsides over several weeks, but pain management with non-steroidal anti-inflammatory drugs, neuropathic pain agents, or narcotics may be needed. A 2-4 week course of calcitonin, administered as one spray (200 IU) per day intranasally, may help patients who need additional acute pain management. Spinal bracing may help with pain by limiting movement of bone fragments against one another, and physical therapy may improve mobility and reduce fear of falling. Vertebral fractures are common in older adults and secondary fracture prevention is important. After a vertebral fracture, patients should immediately start osteoporosis treatment to prevent subsequent vertebral fractures, particularly teriparatide, abaloparatide, zoledronic acid, denosumab, or romosozumab, which have been shown to reduce vertebral fracture risk within the first year of treatment.


Procedures such as vertebroplasty or kyphoplasty have been thought to be effective for acute fracture pain; however, this finding has not been replicated across studies, especially in those controlled by sham operations. This lack of a clear benefit is also offset by the small but serious risks of these procedures, which include epidural cement leak leading to possible nerve root compression, osteomyelitis, cement pulmonary embolism, and the possibility of subsequent vertebral fractures in adjacent vertebrae. A Cochrane review published in 2018 found no demonstrable clinically important benefits for vertebroplasty compared with placebo (sham procedure), and the results did not differ according to duration of pain (≤6 weeks vs. >6 weeks) (5). A 2019 American Society for Bone and Mineral Research (ASBMR) task force concluded that, for patients with painful vertebral fractures, there was no significant benefit for vertebroplasty compared to placebo or sham procedures and recommended against the use of balloon kyphoplasty (6). If vertebral augmentation is considered in select patients with disabling spine fractures, osteoporosis treatment should be initiated concurrently.


Glucocorticoid-induced osteoporosis affects the spine greater than other sites. Glucocorticoids have a major effect on reducing bone formation and also increase bone resorption. Thus, there are two sites for targeted intervention—anabolic and anti-resorptive treatments, respectively. The American College of Rheumatology has recommended starting bone protection therapy for adults ≥40 years taking prednisone at a dose of ≥2.5 mg/day for ≥3 months if at moderate to high risk for fracture (i.e., FRAX 10-year risk of major osteoporotic fracture >10%, FRAX 10-year risk of hip fracture >1%, osteoporosis by bone density criteria, or prior osteoporotic fracture) (7). The Food Drug Administration (FDA) has approved the following anti-resorptive agents — risedronate, alendronate, zoledronic acid, and denosumab — and the anabolic agent teriparatide for glucocorticoid-induced osteoporosis. In a randomized trial, teriparatide was superior to alendronate in preventing BMD declines at the spine and hip.


With regards to hip fractures and the use of zoledronic acid once yearly, the timing of this FDA-approved treatment for secondary fracture prevention is important. There is a significant reduction in vertebral and non-vertebral fractures and mortality as well as an increase in hip BMD in those who receive zoledronic acid and supplemental vitamin D between two weeks and 90 days following a hip fracture.


Osteoporosis


Adequate calcium and vitamin D intake are essential. In 2010, the Institute of Medicine (IOM) set recommendations for daily calcium and vitamin D requirements (8). See Table 3.


Table 3. Recommended Daily Intakes of Elemental Calcium (adapted from 2010 IOM report)

Calcium Intake

Women 19 to 50 years / Men 19 to 70 years
Women ≥51 years / Men ≥71 years

1000 mg
1200 mg

Vitamin D Intake

Women and Men < 70 years

Women and Men > 70 years

600U

800U


Obtaining calcium through the diet is preferred. However, if taking calcium supplements, for those on proton pump inhibitors, calcium citrate (e.g., Citracal®) is preferred given better absorption over calcium carbonate and can be taken on an empty stomach. Preparations of Citracal® include Maximum Plus (315 mg of calcium per tablet) and Petite (200 mg of calcium per tablet). Calcium carbonate (e.g., Oscal®, Caltrate®), ranging from 500 to 600 mg per tablet, should be taken with food to allow optimal absorption.


Vitamin D deficiency is a prevalent problem. The IOM guidelines recommend a daily dose of vitamin D3 of 600 IU for individuals ≤70 years of age and 800 IU daily for those ≥71. Other societies recommend 800-1000 IU of vitamin D for high-risk adults with osteoporosis. Patients with vitamin D deficiency need much higher doses. Although there is debate, the BHOF and other organizations currently recommend a 25-hydroxyvitamin D level ≥30 ng/mL. There are ongoing, population-based studies that are evaluating the effects of supplemental vitamin D on fractures and bone health measures.


Recommendations for lifestyle and dietary modification include weight-bearing exercises, balance training, muscle-strengthening, fall prevention interventions, smoking cessation, and moderate alcohol consumption.


PHARMACOLOGIC THERAPIES


Table 4 lists the currently available osteoporosis drugs approved by the FDA, their dosage, indication, and general efficacy to reduce fractures.


Table 4. FDA-approved Treatments for Osteoporosis: Dose, Fracture Indication, Efficacy and Side Effects

Drug

Dose & Administration

Fracture Reduction *

Side Effects

Bisphosphonates

Alendronate

70 mg PO once weekly

V, N, H

Upper GI symptoms, rare bone pain, osteonecrosis of the jaw (rare), atypical femur fracture (rare).

Ibandronate

150 mg PO monthly; 3 mg IV every 3 months

V

Risedronate

35 mg PO once weekly; 150 mg PO once monthly

V, N, H

Zoledronic Acid (ZA)

5 mg IV once yearly

V, N, H

Mild flu like syndrome during and after ZA infusion (pre-treat with acetaminophen); ZA should not be given if severe renal impairment (GFR <35 mL/min). After a hip fracture, vitamin D and ZA should be initiated 2 weeks to 90 days after the fracture.

SERMs (Selective Estrogen Receptor Modulators)

Raloxifene

60 mg PO daily

V

Hot flashes, deep vein thrombosis (rare)

Parathyroid Hormone

PTH
Teriparatide (PTH 1-34)

20 mcg SC daily

V, N

Nausea, hypercalcemia, hypercalciuria, hypotension (rare)

PTHrP
Abaloparatide
(PTHrP 1-34)

80 mcg SC daily (for maximum of 2 years)

V, N

Nausea, hypercalcemia, hypercalciuria, dizziness, osteosarcoma (in rodents)

RANKL inhibitor

Denosumab

60 mg SC every 6 months

V, N, H

Skin infections, other uncommon infections, osteonecrosis of the jaw (rare), atypical femur fractures (rare), bone loss/vertebral fractures upon discontinuation

Sclerostin inhibitor

Romosozumab

210 mg SC every month for 12 months

V, N, H

Injection site reaction, major adverse cardiac events, osteonecrosis of the jaw (rare), atypical femur fracture (rare)

Other

Calcitonin

200 IU nasally or
100 IU subcutaneously every other day

V

Nasal congestion, malignancy

V: vertebral, N: non-vertebral, H: hip


CURRENT THERAPEUTIC APPROACH


Pharmacologic treatment is indicated for those with osteoporosis by BMD criteria; fragility vertebral or hip fracture regardless of BMD; fragility fracture of the pelvis, proximal humerus, or wrist with osteopenic range BMD; and elevated FRAX scores.


The most commonly used therapy is a bisphosphonate, which has long skeletal retention, decreases bone turnover, and reduces the risk of fractures (see Table 4). Alendronate, risedronate, and zoledronic acid decrease vertebral, non-vertebral, and hip fractures, whereas ibandronate decreases vertebral but not hip or non-vertebral fractures. There is concern about the association of its long-term use and risk of atypical femur fractures. These fractures (1) can occur along the subtrochanteric femur, (2) are associated with minimal or no trauma, (3) are in transverse or short oblique configuration, and (4) usually are complete fractures through both cortices. Some patients have prodromal symptoms of thigh or groin pain in the affected leg; bilateral atypical femur fractures may also be present. The incidence of these types of fractures is very low, and the consensus has been that the number of fractures prevented far exceeds the number of these fractures occurring as a result of bisphosphonates. According to the available limited, post-hoc data analyses, continuation of therapy after 3 years for zoledronic acid and 5 years for oral bisphosphonates may be considered in those with hip, spine, or multiple other osteoporotic fractures before or during therapy, osteoporosis at the hip after treatment, or high fracture risk. According to the 2011 FDA review, more data are needed concerning long-term bisphosphonate use. Until these data are available, annual evaluation and follow-up should involve decisions as to whether a 1-2 year or greater bisphosphonate holiday is needed, according to each individual’s risk, or to consider the use of alternative treatments as needed. It is important, however, to follow patients with a history of low bone mass or osteoporosis who are on a bisphosphonate holiday. Another rare complication is osteonecrosis of the jaw, which usually occurs in the setting of an invasive dental procedure. This complication is primarily seen in cancer patients who are receiving zoledronic acid on a monthly basis to prevent cancer-related fractures.


Denosumab, FDA approved in June 2010, is a monoclonal antibody that reduces RANKL, inhibiting the cellular mechanisms underlying bone resorption. It decreases the risk of vertebral, non-vertebral, and hip fractures and can be judiciously used in those with renal dysfunction. Denosumab has also been associated with rare cases of atypical femur fractures and osteonecrosis of the jaw. Of note, a drug holiday from denosumab is not recommended due to rebound bone loss and risk of multiple vertebral fractures with discontinuation. If denosumab is to be discontinued, it should be followed by bisphosphonate treatment.


Anabolic agents teriparatide (1-34 recombinant PTH) and abaloparatide (1-34 recombinant PTHrP) stimulate overall bone formation, improve bone structure, increase BMD particularly at the spine, and reduce risk of vertebral and non-vertebral fractures. In postmenopausal women with history of vertebral fracture, teriparatide has been shown to reduce incident vertebral and clinical fractures more than risedronate. Abaloparatide appears to be more effective at increasing bone density at the total hip compared to teriparatide and is less likely to cause hypercalcemia. They are administered as daily subcutaneous injections. Due to increased risk of osteosarcoma in rodents, these agents were limited to 2 years in a lifetime. However, due to twenty years of post-surveillance data showing no increased risk of osteosarcoma in humans, use of teriparatide is no longer restricted to 2 years. Use of abaloparatide, which was FDA approved in 2017, continues to be restricted to 2 years. These treatments should not be used in patients with active malignancy, history of radiation therapy, elevated alkaline phosphatase, or Paget’s disease. Anabolic agents should be followed by anti-resorptive therapy to consolidate gains in BMD.


Romosozumab, FDA approved in April 2019, is fully human monoclonal antibody that inhibits sclerostin and simultaneously reduces bone resorption and stimulates bone formation. Clinical studies of romosozumab have shown reduced risk of vertebral and nonvertebral, and hip fractures compared to placebo as well as alendronate. However, there were more adjudicated serious cardiovascular events in the romosozumab treatment arm compared to the alendronate arm. Thus, according to the FDA, romosozumab should not be used in patients who have had a myocardial infarction or stroke within the preceding year. A course of romosozumab is 12-months long, as the anabolic effects of romosozumab wane before then. There is no limit of courses. Similar to the parathyroid hormone analogues, romosozumab should also be followed by anti-resorptive therapy.


FOLLOW-UP


Once an initial bone density is measured, a follow-up BMD should be done 1-2 years after the initial screening and depending on whether pharmacologic therapy was initiated. Biochemical bone turnover markers and collagen breakdown products (e.g., N-telopeptide, C-telopeptide, collected in the morning) at baseline and after 3 months of treatment may be helpful in select patients to determine patient response to a therapeutic intervention. Clinical musculoskeletal evaluation and annual height measurements are important in the identification of spine fractures. Fragility fractures increase exponentially with advancing age, and evaluation and treatment of new fractures are critical for secondary prevention of fractures and healthy aging.


GUIDELINES


LeBoff M.S., Greenspan S.L, Insogna K.L., Lewiecki E.M., Saag K.G., Singer A.J., Siris, E.S. The Clinician's Guide to Prevention and Treatment of Osteoporosis. Osteoporos Int. In press.


Camacho, P. M., Petak, S. M., Binkley, N., Diab, D. L., Eldeiry, L. S., Farooki, A., Harris, S. T., Hurley, D. L., Kelly, J., Lewiecki, E. M., Pessah-Pollack, R., McClung, M., Wimalawansa, S. J., & Watts, N. B. American Association of Clinical Endocrinologists/American College of Endocrinology Clinical Practice Guidelines for the Diagnosis and Treatment of Postmenopausal Osteoporosis – 2020 Update. Endocr Pract. 2020;26(Suppl 1), 1–46..


Eastell R., Rosen C.J., Black D.M., Cheung A.M., Murad M.H., Shoback D. Pharmacological Management of Osteoporosis in Postmenopausal Women:  An Endocrine Society Clinical Practice Guideline. J Clin Endocrinol Metab. 2019;104(5):1595-1622.


Shoback D., Rosen C.J., Black D.M., Cheung A.M., Murad M.H., Eastell R. Pharmacological Management of Osteoporosis in Postmenopausal Women:  An Endocrine Society Guideline Update. J Clin Endocrinol Metab. 2020;105(3): 587–594


REFERENCES


  1. Ensrud K.E., Schousboe J.T. Clinical practice. Vertebral fractures. N Engl J Med. 2011;364(17):1634–42. [PubMed]
  2. Rosen CJ. The Epidemiology and Pathogenesis of Osteoporosis. In: De Groot LJ, Chrousos G, Dungan K, Feingold KR, Grossman A, Hershman JM, Koch C, Korbonits M, McLachlan R, New M, Purnell J, Rebar R, Singer F, Vinik A, editors. Endotext [Internet]. South Dartmouth (MA): MDText.com, Inc.; 2000-2017 Feb 21.
  3. LeBoff M.S., Greenspan S.L, Insogna K.L., Lewiecki E.M., Saag K.G., Singer A.J., Siris, E.S. The Clinician's Guide to Prevention and Treatment of Osteoporosis. Osteoporos Int. In press.
  4. Chou S.H., LeBoff M.S. Vertebral Imaging in the Diagnosis of Osteoporosis: a Clinician's Perspective. Curr Osteoporos Rep. 2017;15(6):509–520. [PubMed]
  5. Buchbinder R., et al. Percutaneous vertebroplasty for osteoporotic vertebral compression fracture. Cochrane Database Syst Rev. 2018;4:CD006349. [PMC free article] [PubMed]
  6. Ebeling P., et al. The Efficacy and Safety of Vertebral Augmentation: A Second ASBMR Task Force Report. J Bone Miner Res. 2019; 34(1):3-21.
  7. Buckley L, Guyatt G, Fink H, Cannon M, Grossman J, Hansen K, Humphrey HB, Lane NE, Magrey M, Miller M, Morrison L, Rao M, Robinson AB, Saha S, Wolver S, Bannuru RR, Vaysbrot E, Osani M, Turgunbae M, Miller A, McAlindon T. 2017 American College of Rheumatology Guideline for the Prevention and Treatment of Glucocorticoid-Induced Osteoporosis. Arthritis Rheumatol. 2017;69(8):1521-1537.
  8. Institute of Medicine. In Ross AC, Taylor CL, Yaktine AL, Del Valle HB e, eds. Dietary reference intakes for calcium and vitamin D. Washington, DC: National Academy of Sciences; 2011.

Age-Related Changes in the Male Reproductive System

ABSTRACT   

In male mammals, changes at all levels of the hypothalamic-pituitary-testicular axis, including alterations in the GnRH pulse generator, gonadotropin secretion, and testicular steroidogenesis, in addition to alterations of feed-forward and feed-back relationships contribute to the age-related decline in circulating testosterone concentrations. The rate of age-related decline in testosterone levels is affected by the presence of chronic illness, adiposity, medication, sampling time, and the methods of testosterone measurement. Epidemiologic surveys reveal an association of low testosterone levels with changes in sexual function, body composition, physical function and mobility, and increased risk of diabetes, late life persistent depressive disorder (dysthymia), unexplained anemia of aging, osteoporosis and bone fractures. Age-related decline in testosterone should be distinguished from classical hypogonadism due to known diseases of the hypothalamus, pituitary, and the testis. In young hypogonadal men who have a known disease of the hypothalamus, pituitary, and testis, testosterone therapy is generally beneficial and has been associated with a low frequency of adverse events. However, neither the long-term benefits in improved health outcomes nor the long-term risks of testosterone therapy are known in older men with age-related decline in testosterone levels. Well-conducted randomized trials have found that testosterone replacement of older men with unequivocally low testosterone levels improves sexual desire, erectile function, and overall sexual activity; lean body mass, muscle strength and some measures of physical function and mobility; areal and volumetric bone density and bone strength; depressive symptoms; and corrects anemia of aging. Testosterone treatment does not worsen lower urinary tract symptoms but the effects of long-term testosterone treatment on the risk of prostate cancer and major adverse cardiovascular events remain unknown. Although testicular morphology, semen production, and fertility are maintained up to a very old age in men, there is clear evidence of decreased fecundity with advancing age and an increased risk of specific genetic disorders related to paternal age among the offspring of older men. Thus, reproductive aging of men is emerging as an important public health problem whose serious societal consequences go far beyond the quality-of-life issues related to low testosterone levels.

INTRODUCTION

Aging of male mammals is a very recent evolutionary event observed mostly in humans and animals in captivity. Most animal species in the wild with few exceptions [e.g., short-finned pilot whales, killer whales and some fish (1)] do not live beyond their reproductive years; during periods of food deprivation, many small animals may not even live beyond puberty. Even among humans, only the men and women of the past three generations have enjoyed a life expectancy of greater than fifty years. With increasing life expectancies of human populations across the globe, today, most men and women can expect to spend a substantial proportion of their lifespan past their procreative years.


The historical transition towards aging of human populations has profoundly influenced the health and wellbeing of older adults in their post-reproductive years as well as the size, health, vitality, and economies of human societies (2). At an individual level, many conditions related to reproductive aging, including sexual dysfunction, subfertility or infertility, conditions related to sex-steroid deficiency, genitourinary disorders, pelvic floor disorders, and cancers of the reproductive and accessory organs motivate middle-aged and older men and women to seek medical care. At a societal level, reproductive aging poses a potential threat to the reproductive capacity, health, and welfare of the current and future generations (2,3). Birth-rates in the United States, which had been declining since the turn of the nineteenth century - except during a short baby boom period after World War II - have trended below replacement levels since 1971 (Figure 1) (3-6). Several factors have contributed to this trend, including a growing proportion of couples having their first child after age 30, and an increasing proportion postponing pregnancy beyond age 35 (Figure 1) (4,7).  Societal developments underpinning these trends include the availability of contraceptives that enable couples to separate their sexual and procreative lives; increased work force participation and changing career expectations of women; and a higher age of the male and female partners at reproductive union (2,3). Postponement of childbearing to an older age increases the risk of involuntary childlessness because of the adverse effects of advanced maternal and paternal age per se on fecundity, increased risk of comorbidities associated with advancing age that may indirectly affect fecundity, and the age-related changes in reproductive behaviors (4,8-11).

Figure 1. Birth rates, mean age of mother at first childbirth, and the proportion of infants born in the United States to women >35 years of age since 1970. Legend. The birth rate per 1000 population declined from 18.4 in 1970 to 11.8 in 2017. The mean age of mothers at first child birth increased from 21.4 years in 1970 to 26.6 in 2016. The proportion of all infants born in the USA to mothers > 35 years increased from 4.6% in 1970 to 14.9% in 2012. Birth rates are per 1,000 population estimated as of July 1 for each year except in 1970 and 1980, which were estimated as of April 1. Reproduced with permission from Bhasin S, Kerr C, Oktay K, Racowsky C. The Implications of Reproductive Aging for the Health, Vitality and Economic Welfare of Human Societies. J Clin Endocrinol Metab. 2019 Apr 16:jc.2019-00315. doi: 10.1210/jc.2019-00315. Epub ahead of print. PMID: 30990518. The original figure was based on data derived from: Centers for Disease Control and Prevention. National Vital Statistics System: birth data. Available at: www.cdc.gov/nchs/nvss/births.htm. Accessed 24 June 2021.

The health issues related to reproductive aging of women have been the subject of intense research for nearly 50 years and are covered in other sections of this textbook (12-15). This chapter focuses only on the reproductive aging of men, which has recently begun to garner considerable attention as reflected by the opening of hundreds of men's health clinics across the United States, and in the growing sales of testosterone and erectile dysfunction products.


The aging of men is associated with functional alterations at all levels of the reproductive axis that affect both the steroidogenic and gametogenic compartments (16-19). As discussed in this chapter, there is agreement that serum testosterone levels decline with age, a decline that is exacerbated by the accumulation of comorbidities (20,21); however, the long-term effects of testosterone supplementation on health-related outcomes in older men have not been fully examined. Long-term safety data on the effects of testosterone supplementation on the risk of prostate cancer and major adverse cardiovascular events are also lacking. The recent publication of several well-conducted placebo-controlled trials of testosterone in middle-aged and older men has greatly advanced our understanding of the effects of testosterone treatment on sexual function, mobility, vitality, lower urinary tract symptoms and atherogenesis progression (22-28). However, in the absence of long-term, adequately-powered randomized trials of the effects of testosterone on hard patient-important health outcomes – fractures, falls, physical disability, progression from prediabetes to diabetes, remission of depressive disorders, wellbeing, and progression to dementia - the risks and benefits of long-term testosterone replacement in older men remain incompletely understood. The first section of this chapter reviews the pathophysiology and health consequences of age-related decline of testosterone levels and offers a patient-centric individualized approach to the treatment decisions. The second section describes the age-related alterations in the gametogenic compartment of the testes.


CHANGES IN THE STEROIDOGENIC COMPARTMENT OF THE TESTIS


Many studies suggest that aging per se affects the gonadal axis independently of the co-morbidities that accrete with aging, but there remains controversy about the relative contributions of the aging and the accumulation of co-morbidities to the age-related decline in testosterone levels. A few studies of older men have reported preservation of normal testosterone concentrations and its circadian rhythm in healthy older men (29,30). However, many other cross-sectional studies have shown that even after accounting for the potential confounding factors such as time of sampling, concomitant illness and medications, and technical issues related to hormone assays, serum total testosterone levels are lower in older men in comparison to younger men (31-52). Several longitudinal studies (31-34)also have confirmed a gradual but progressive decrease in serum testosterone concentrations from age 20 to 80. Adiposity, chronic illness, weight gain, lifestyle factors, medications, and genetic factors affect testosterone levels and the trajectory of the age-related decline in testosterone levels in men (29,32,35,53-56).  The rate of age-related decline is greater in older men with chronic illness and adiposity than in healthy, non-obese older men (35,53,54). In the European Male Aging Study, adiposity and comorbidities were more strongly associated with low testosterone levels than age (57).


In contrast to the sharp reduction in ovarian estrogen production at menopause, the age-related decline in men does not start at a discrete coordinate in old age; rather, total testosterone concentrations, after reaching a peak in the second and third decade, decline inexorably throughout a man’s life (Figure 2). Because of the absence of an identifiable inflection point at which testosterone levels begin to decline abruptly or more rapidly, many investigators have questioned the validity of the concept of “andropause”, which misleadingly implies an abrupt cessation of androgen production in men (39,58). The term ‘late-onset hypogonadism’ has been proposed to reflect the view that in some middle-aged and older men (> 65 years), the age-related decline in testosterone concentration is associated with a cluster of symptoms and signs in a syndromic constellation which resembles in some aspects that observed in men with classical hypogonadism (47,59).

Figure 2. The distribution of total and free testosterone levels by decades of age in male participants of the Framingham Heart Study, the European Male Aging Study (EMAS) and the Study of Osteoporotic Fractures in Men (MrOS). Means and standard deviations are shown. To convert total testosterone from ng/dL to nmol/L, multiply concentrations in ng/dL with 0.0347. To convert free testosterone from pg/mL to pmol/L, multiply concentrations in pg/mL with 3.47. Reproduced with permission from Bhasin et al, J Clin Endocrinol Metab. 2011 Aug;96(8):2430-9.

Sex-hormone binding globulin concentrations are higher in older men than younger men (32,43,48). Thus, the age-related decline in free testosterone levels is of a greater magnitude than that in total testosterone levels. Similarly, there is a greater percent decline in bioavailable testosterone concentrations (the fraction of circulating testosterone that is not bound to SHBG) than in total testosterone concentrations.


An Expert Panel of the Endocrine Society defined androgen deficiency as a syndrome resulting from reduced production of testosterone and characterized by a set of signs and symptoms in association with unequivocally low testosterone levels (16). Many epidemiologic studies have defined androgen deficiency solely in terms of serum testosterone concentrations below the lower limit of the normal range for healthy, young men leading to inaccurate estimates of the prevalence of androgen deficiency in older men. Additionally, serum testosterone levels in most studies were measured using direct immunoassays, whose accuracy in the low range has been questioned. Not surprisingly, the estimates of the prevalence of androgen deficiency in older men have varied greatly among different studies. In the Baltimore Longitudinal Study of Aging (BLSA) (31), 30% of men over the age of 60 and 50% of men over the age of 70 had total testosterone concentration below the lower limit of normal range for healthy young men (325 ng/dL, 11.3 nmol/L). The prevalence was even higher when these investigators used a free testosterone index to define androgen deficiency (31). In contrast, more recent studies that have used liquid chromatography tandem mass spectrometry found the prevalence of androgen deficiency to be significantly lower than that observed in the MMAS and BLSA (39,40,47-50). Although 10–15% of men aged ≥65 years have low total testosterone levels (Table 1) (47-50), the prevalence of late-onset hypogonadism defined by symptoms and a total testosterone level <8 nmol/L in the EMAS was 3.2% for men aged 60–69 years and 5.1% for those aged 70–79 years (47). The Healthy Man Study in Australia found no significant age-related decline in testosterone or dihydrotestosterone in men who reported being in good health (60). The authors of the Health Man Study have argued that ill health, rather than aging itself, is the major contributor to androgen deficiency in older men. A Finnish cross-sectional study also demonstrated very low prevalence of low serum testosterone concentrations in older men who were healthy (39).


Table 1. Percent of Community-Dwelling Older Men with Unequivocally Low Testosterone Level in Population Studies

Study

Principal Investigator

Number of Men with Age > 65 years

% Men with Testosterone <250 ng/dL

Framingham Heart Study (FHS)

Bhasin

1870

12.1%

Osteoporotic Fractures in Men Study (MrOs)

Orwoll

2623

10%

European Male Aging Study (EMAS)

Wu

1080

7.3%

Cardiovascular Health Study (CHS)

Hirsch

639

14.3%

Data derived from Bhasin et al, JCEM 2011; Orwoll et al, JCEM 2009; Wu et al, NEJM 2010; Hirsch et al, JCEM 2009.


Circulating testosterone concentrations are a function of testosterone production and clearance rates; the age-related decline in serum testosterone concentrations is primarily a consequence of decreased production rates in older men (20,21,43-45,48). Plasma clearance rates of testosterone are, in fact, lower in older men than in younger men (54,55). The decline in testosterone production in older men is the result of abnormalities at all levels of the hypothalamic-pituitary-testicular axis (42-44,60-71).

GONDADOTROPIN-RELEASING HORMONE SECRETION AND REGULATION IN OLDER MEN           


Pulsatile GnRH secretion is attenuated in older men. In addition, there are disturbances of the feedback and feed-forward relationships between testosterone and LH secretion (63,71,72). Thus, the sensitivity of pituitary LH secretion to androgen-mediated feedback inhibition is increased; in addition, the ability of LH to stimulate synchronously testicular testosterone secretion (feedforward) is attenuated (63,71,72). Veldhuis has shown that the orderliness of LH pulses and the synchrony between LH and testosterone pulses are decreased in older men (63,71,72); in addition, there is greater variability in LH pulse frequency, amplitude, and secretory mass in older men, in comparison to younger men (71,72).


GONADOTROPIN SECRETION AND REGULATION IN OLDER MEN     


There is considerable heterogeneity in circulating LH and FSH concentrations in individual older men; both hypogonadotropic and hypergonadotropic hypogonadism have been reported (54,59). As a group, serum LH and FSH concentrations are higher in older men than in young men (32,33). However, serum LH concentrations do not increase in proportion to the age-related decline in circulating testosterone levels, due to the impairment of GnRH secretion and alterations in gonadal steroid feedback and feedforward relationships (60-71).


In the EMAS, secondary hypogonadism (low testosterone and low or normal LH) was more prevalent (nearly 12%) than primary hypogonadism (low testosterone and elevated LH, 2%) (57). Secondary hypogonadism was associated with obesity and comorbid conditions, while primary hypogonadism was associated predominately with age (57). Nearly 10% of men in EMAS had normal testosterone levels and elevated LH; these men with elevated LH tended to be older and in poor health and were at increased risk of developing low testosterone and other comorbid conditions (73).


The data on LH response to GnRH are somewhat inconsistent across studies. Urban et al (65) used an interstitial cell bioassay to measure serum concentrations of bioactive LH and found that although basal bioactive LH concentrations were similar in this sample of young and older men, older men demonstrated diminished LH response to GnRH administration. However, in a subsequent study, Zwart et al (66) found greater gonadotropin responsiveness to GnRH in older men than younger men; the maximal and incremental LH and FSH secretory masses in response to graded doses of GnRH were significantly higher in healthy, older men than in younger men. The estimated half-lives of LH, FSH, or alpha-subunit did not significantly differ between young and older men (66).


The Brown Norway rat has been widely used as a model of reproductive aging. In this experimental model, the prepro-GnRH mRNA content and the number of neurons expressing prepro-GnRH mRNA are lower in older male rats in comparison to young rats (67,68). The GnRH content of several hypothalamic areas is also lower in intact older rats than younger rats (67). Older Brown Norway rats exhibit significant reductions in glutamate and -aminobutyric acid (GABA) levels in the hypothalamus compared to young rats (68). These observations suggest that the decreased hypothalamic excitatory amino acid expression and the reduced responsiveness of GnRH neurons to N-methyl-D-aspartate may contribute to the altered LH pulsatile secretion observed in old rats (68).


Infusions of testosterone and DHT are associated with greater reductions in mean serum LH and FSH levels and the frequency of LH pulses in older men in comparison to young men (69). Winters et al (64) reported that the degree of LH inhibition during testosterone replacement of older, hypogonadal men was significantly greater than in young, hypogonadal men suggesting that older men are more sensitive to the feedback inhibitory effects of testosterone on LH. Deslypere et al (69) also found decreased LH pulse frequency and a greater degree of LH inhibitory response to estradiol administration in older men than young controls. Age-related increase in FSH levels is not associated with a progressive or proportionate decrease in inhibin B levels (70). Thus, the mechanistic basis of FSH increase with advancing age is not fully understood, although the lack of change in inhibin B levels suggests that Sertoli cell function is relatively preserved in older men.


TESTICULAR TESTOSTERONE PRODUCTION IN OLDER


Testosterone secretion in healthy, young men exhibits a diurnal rhythm characterized by higher concentrations in the morning and lower concentrations in the late afternoon. The diurnal rhythm of testosterone secretion is dampened in older men (41,51). Testosterone response to LH and human chorionic gonadotropin is decreased in older men, compared to younger men (42-44).


Many physiological changes that occur with advancing age, such as the loss of bone and muscle mass, increased fat mass, impairment of physical and sexual functions, loss of body hair, and decreased hemoglobin levels, are similar to those associated with androgen deficiency in young men. Aging is associated with loss of skeletal muscle mass (Figure 3), muscle strength and power, and progressive impairment of physical function (74-98). Epidemiological studies of older men have reported associations between low testosterone levels and some age-related conditions, although these associations are weak. For instance, in a number of epidemiologic studies, such as the St. Louis Inner City Study of Aging Men (77), the Olmsted County Epidemiological Study (76), and the New Mexico Elderly Health Study (79,80), low bioavailable testosterone levels (unbound and albumin-bound testosterone) were associated with low appendicular skeletal muscle mass. Low bioavailable testosterone levels also have been associated with decreased strength of upper as well as lower extremity muscles (77,78) and decreased performance in self-reported as well as performance-based measures of physical function (99-103). Low free testosterone levels have also been associated with the development of mobility limitation and the frailty syndrome (104-107).

Figure 3. A schematic diagram of the age-related changes in body composition in 7265 men. Lines represent the longitudinal changes in body weight (black line), fat mass (red line) and fat-free. mass (blue line) components from age 20 years. The estimated mass values at age 20 years were as follows: body mass, 72.72 kg; fat mass, 9.14 kg; fat-free mass, 64.09 kg. Figure adapted with permission from Jackson et al. Br J Nutr. 2012;107(7):1085-91.

The association of testosterone levels with sexual dysfunction has been inconsistent across studies because of the heterogeneity and variable quality of instruments used to assess sexual dysfunction, problems of testosterone assay quality, and failure to distinguish among various categories of sexual dysfunction (108-113). Androgen deficiency and erectile dysfunction are two independently distributed clinical disorders and because both disorders are prevalent in middle-aged and older men, they can often co-exist (112,113). Low testosterone levels were associated with low sexual desire in the MMAS (108). Among men enrolled in the testosterone trials, free and total testosterone levels were independently associated with sexual desire, erectile function, and sexual activity scores (114).


In the EMAS, total and free testosterone levels were associated with overall sexual function in middle-aged and older men (47). This relationship was observed more robustly at testosterone concentrations <8 nmol/L, but not at higher testosterone concentrations (115). Men deemed to have low total and free testosterone levels in EMAS were more likely to report decreased morning erections, erectile dysfunction, and decreased frequency of sexual thoughts than those with normal testosterone levels (48). In another study of men over the age of 50 who had benign prostatic hyperplasia, sexual dysfunction was reported only by men with serum total testosterone levels less than 225 ng/dL (110).


Aging of humans is attended by a decline in several aspects of cognitive function; of these multiple domains of cognition that decline with aging, declines in verbal memory, visual memory, spatial ability, and executive function are associated with the age-related decline in testosterone (109-113,115-124).


The relationship of testosterone levels with depression has been inconsistent across epidemiologic studies (125-129). Low testosterone levels in older men are associated more with late-onset low grade persistent depressive disorder (dysthymia) but not with major depression (128-130). In general, testosterone levels are lower in older men with dysthymic disorder than in those without any depressive symptoms (129).


Several epidemiologic studies of older men (131-135), including MrOS (131), Rancho Bernardo Study (132), Framingham Heart Study (133), and the Olmsted County Study (134) - have found bioavailable testosterone levels to be associated with bone mineral density, bone geometry, and bone quality (135); the associations are stronger with bioavailable testosterone and estradiol levels than with total testosterone levels. In the MrOS Study, the odds of osteoporosis in men with a total testosterone less than 200 ng/dL were 3.7-fold higher than in men with normal testosterone level (131); free testosterone was an independent predictor of prevalent osteoporotic bone fractures (136).


Several studies have evaluated the association of testosterone levels and mortality (137-141). Some, but not all, studies found higher all-cause mortality and cardiovascular mortality in men with low testosterone levels than in those with normal testosterone levels. In a meta-analyses of epidemiologic studies of community-dwelling men, low testosterone levels were associated with an increased risk of all-cause and CVD death (Figure 4) (142,143). However, the strength of the inferences of these meta-analyses was limited by considerable heterogeneity in study populations; it is possible that effects may have been driven by differences in the age distribution and the health status of the study populations (142-146).

Figure 4. The relationship of low testosterone level with all-cause mortality in a meta-analysis of epidemiologic studies of community-based men. Eleven studies which enrolled 16,184 subjects were included in this meta-analysis. There was considerable heterogeneity of the age distribution, health status, and other subject characteristics. Reproduced with permission from Araujo et al, J Clin Endocrinol Metab 2011;96:3007-19.

Testosterone levels are not correlated with aging-related symptoms assessed by the Aging Male Symptom (AMS) score or with lower urinary tract symptoms assessed by the IPSS/AUA prostate symptom questionnaire (144). Some cross-sectional studies found no difference in serum testosterone levels between men who had coronary artery disease and those who did not have coronary artery disease; other studies have reported testosterone levels to be lower in men with coronary artery disease than in men without coronary artery disease (145-150).


Epidemiologic studies, especially cross-sectional studies, can only demonstrate associations; causal relationships are difficult to establish from these studies. Furthermore, the associations between testosterone levels and health-related outcomes are generally weak. The inferences are further confounded by the co-linearity of aging-related co-morbid conditions, low testosterone levels, and age-related changes in body composition and inflammatory markers. Although epidemiologic studies have reported associations between the age-related changes in circulating testosterone levels and skeletal muscle mass, muscle strength and physical function; sexual and cognitive functions; areal and volumetric bone density and fracture risk; and mood, long-term randomized trials are needed to determine whether these relations are causal.


Potential Beneficial Effects of Testosterone Treatment in Older Men with Low Testosterone Levels


It has been hypothesized that increasing serum testosterone concentrations in older men with low testosterone levels into a range that is mid-normal for healthy, young men would improve physical function and mobility, some domains of sexual and cognitive functions, energy and sense of wellbeing, and reduce the risk of falls and fractures, and improve overall quality of life. A number of randomized trials have demonstrated improvements in measures of sexual function, lean and fat mass, and areal and volumetric bone mineral density; however, there has been a paucity of long-term, placebo-controlled, randomized trials that are adequately powered to detect clinically meaningful changes in health outcomes such as fracture rates, physical disability, progression to dementia, remission of late onset low grade persistent depressive disorder (dysthymia), progression from prediabetes to diabetes, and overall quality of life. Furthermore, none of the previously published studies had sufficient power to address the long-term risks of prostate and cardiovascular disease. 


The following section describes the effects of testosterone supplementation on multiple organ systems focusing on physical function, sexual function, vitality, bone health, mood, wellbeing, and depression, and cognitive function.


EFFECTS OF TESTOSTERONE SUPPLEMENTAION ON MUSCLE MASS AND PERFORMANCE AND PHYSICAL FUNCTION IN OLDER MEN WITH LOW TESTOSTERONE LEVELS 


Sarcopenia, the loss of muscle mass and function, is an important consequence of aging (75-79). The principal component of the decrease in fat-free mass is the loss of muscle mass; there is little change in non-muscle lean mass (81-87). Between 20 and 80 years of age, the skeletal muscle mass decreases by 35-40% in men (85), in part due to decreased muscle protein synthesis (92). Although there is a loss of both type I and type II fibers, there is a disproportionate decrease in the number of type II muscle fibers that are important for the generation of muscle power (93,94). In spite of the significant depletion of skeletal muscle mass, body weight does not decrease, and may even increase because of the accumulation of body fat (81-87) (Figure 3).


The loss of skeletal muscle mass that occurs with aging is associated with a reduction in muscle strength (95-98). There is a substantial decrease in muscle strength and power between 50 and 70 years of age, primarily due to muscle fiber loss and selective atrophy of type II fibers (93-98). The loss of muscle strength is even greater after the age of 70; 28% of men over the age of 74 could not lift objects weighing more than 4.5 kg (97). With increasing age, there is a progressive reduction in muscle power (151,152), the speed of strength generation, and fatigability, the ability to persist in a task.


Loss of muscle mass and strength leads to impairment of physical function, as indicated by the impaired ability to arise from a chair, climb stairs, generate gait speed, and maintain balance (151-154). The impairment of physical function contributes to loss of independence, and increased risk of physical disability, falls and fractures in older men.


Anabolic Effects of Testosterone in Humans: Testosterone Trials in Healthy, Hypogonadal Men, Men with Chronic Illness, and Older Men


The anabolic effects of testosterone on the muscle have been a source of controversy for over sixty years. The athletes and recreational bodybuilders use large doses of androgenic steroids with the belief that these compounds increase muscle mass and strength. Until recently, the academic community was skeptical about such claims because of the problems of study design. However, a large number of studies in healthy young men, healthy hypogonadal men, men with chronic illness, and in healthy older men have established that testosterone administration improves skeletal muscle mass, maximal voluntary strength, leg power, aerobic capacity, and some measures of physical performance and mobility (154-165). In a systematic review of testosterone trials in healthy, hypogonadal men, testosterone therapy increased fat-free mass and body weight (Figure 5) (154-161).

Figure 5. The effects of testosterone therapy on body composition, muscle strength, and sexual function in intervention trials. The point estimates and the associated 95% confidence intervals are shown. Panel A shows the effects of testosterone therapy on, grip strength, fat mass and lean body mass in a meta-analysis of randomized trials (data derived from Bhasin et al. Nat Clin Pract Endocrinol Metab. 2006;2(3):146-59; figure reproduced with permission from Spitzer et al. Nat Rev Endocrinol. 2013;9(7):414-24). Panel B shows the effects of testosterone therapy on sexual function in a meta-analysis of randomized trials (figure adapted with permission from Ponce et al. J Clin Endocrinol Metab. 2018;103(5):1745-54).

The anabolic effects of testosterone on fat-free mass, muscle size, and maximal voluntary strength are related to the administered testosterone dose and the circulating testosterone concentrations (166-168) (Figure 6). The administration of supraphysiologic doses of testosterone in eugonadal men increases fat-free mass, muscle size, and maximal voluntary strength (166-169).

Figure 6. Testosterone Dose Response Relationship in Young and Older Men. In this study, healthy, young men (18-34 years of age) and healthy older men (60-75 years of age) were treated with a long-acting GnRH agonist plus graded doses of testosterone enanthate for 20 weeks. Shown are mean (±SEM) changes from baseline in fat free mass (upper left), skeletal muscle mass (upper right), fat mass (lower left), and leg press strength (lower right) in young (black bars) and older (lightly shaded bars) men. Adapted with permission from Bhasin et al. J Clin Endocrinol Metab. 2005 Feb;90(2):678-88.

Testosterone effects on muscle performance are domain-specific: testosterone administration increases maximal voluntary strength and leg power, but does not affect fatigability or specific tension (167). The gains in maximal voluntary strength during testosterone administration are proportional to the increase in muscle mass; unlike resistance exercise training, testosterone does not improve the contractile properties of the human skeletal muscle (167).


Resistance exercise training augments the anabolic response to androgens; thus, men receiving testosterone and resistance exercise training together experience greater gains in fat-free mass and muscle strength than those receiving either intervention alone (169). The anabolic effects of testosterone are also augmented by concomitant recombinant growth hormone administration (170). Although it has been speculated in the sports medicine literature that increasing the protein intake can enhance the muscle mass and strength gains in response to anabolic stimuli such as resistance exercise training or androgens, the evidence supporting such speculation is weak. In a recent controlled feeding study, increasing the daily protein intake to a level (1.3 g/kg/day) higher than the recommended daily allowance (0.8 g/kg/day) for six months did not increase lean body mass or maximal muscle strength more than that associated with the daily intake of the recommended daily allowance of 0.8 g/kg/day (171) . The higher level of daily protein intake (1.3 g/kg/day) also did not augment the gains in lean body mass and muscle strength in response to testosterone administration above that observed in participants eating the recommended dietary allowance for protein (171,172). 


Testosterone replacement of young, hypogonadal men has been reported to increase muscle protein synthesis (158,173,174). The effects of testosterone replacement on muscle protein degradation need further investigation.


Systematic reviews (155,175,176) of randomized, placebo-controlled trials in HIV-infected men with weight loss (176-181) have revealed that testosterone therapy for 3 to 6 months was associated with greater gains in lean body mass than placebo administration (difference in lean body mass change between placebo and testosterone arms 1.22 kg, 95% CI 0.23-2.22 for the random effect model). In two (176,180) out of three trials that measured muscle strength (176,180,181), testosterone administration was associated with significantly greater improvements in maximal voluntary strength than placebo. Testosterone therapy had a moderate effect on depression indices (-0.6, 95% CI -1.0, -0.2) (182) and fatigue (183), but did not improve overall quality of life (182,183). Changes in CD4+ T lymphocyte counts, HIV copy number, PSA, plasma HDL cholesterol, and adverse event rates were not significantly different between the placebo and testosterone-treatment groups (176-183). Overall, short-term (3-6 months) testosterone use in HIV-infected men with low testosterone levels and weight loss can induce modest gains in body weight and lean body mass with minimal changes in quality of life and mood. This inference is weakened by inconsistency of results across trials, and heterogeneity in inclusion and exclusion criteria, disease status, testosterone formulations and doses, treatment duration, and methods of body composition analysis (155). Data on testosterone effects on physical function, risk of disability, or long-term safety in HIV-infected men are limited.


Testosterone administration increases fat-free mass and decreases fat mass in older men with low testosterone levels. Meta-analyses (155,183) of randomized trials (184-188) that included middle-aged and older men with low or low normal testosterone levels, and that used testosterone or its esters in replacement doses for >90 days, have confirmed that testosterone administration is associated with a significantly greater increase in whole body and appendicular fat-free mass and a greater reduction in whole body and appendicular fat mass than placebo (Figure 5). The average gains in fat-free mass generally were greater in trials that used injectable testosterone esters than in those which used transdermal testosterone gel, presumably because of the higher doses of testosterone delivered by the injectable formulations than by transdermal gel formulations. The change in body weight did not differ significantly between the testosterone and placebo groups.


Testosterone administration improves stair climbing speed and power, and self-reported physical function, as assessed by the Medical Outcomes Study Short Form 36 (MOS SF36) questionnaire. Testosterone’ Effects on Atherosclerosis Progression in Aging Men Trial (The TEAAM Trial), a randomized trial conducted in healthy community-dwelling older men without functional limitations and low to low-normal testosterone levels, showed that testosterone replacement for 3-years was associated with modest improvements in leg-press and chest-press power and the stair-climb power (163). Changes in gait speed generally have been modest and inconsistent across randomized trials (25,185,188,189). Testosterone administration is associated with small improvements in aerobic capacity and attenuation of the age-related decline in VO2peak (Figure 7) (164,165).

Figure 7. Effects of testosterone administration on measures of muscle performance and physical function in randomized testosterone trials in older men. Panel A shows the mean (SD) change from baseline to maximal voluntary strength in the leg press and chest press exercises and on loaded stair climbing power at either the end of the intervention period or at the last measurement performed in who dropped out before study completion in the testosterone in older men with mobility limitation (The TOM Trial). The minimal clinically important difference (MCID) for each outcome was determined using an anchor-based method within the trial. The proportion of men (percent) whose change from baseline either equaled or exceeded the MCID is shown below the figure along with the P-value for the comparison of placebo and testosterone groups (figure adapted with permission from Spitzer et al. Nat Rev Endocrinol. 2013;9(7):414-24). Panel B shows the long-term effects of testosterone administration on aerobic capacity in older men participating in the TEAAM trial. Data points represent mean changes from baseline and error bars are 95% CI in VO2peak (L/min) and in peak work rate. P values indicate the overall effect of the testosterone intervention over time (figure reproduced with permission from Traustadóttir et al, J Clin Endocrinol Metab. 2018;103(8):2861-2869).

One reason for the variable improvements in physical function in various testosterone trials is that the measures of physical function used in previous studies had low ceilings. Another confounder of the effects of anabolic interventions on muscle function is the learning effect. For instance, subjects who are unfamiliar with weightlifting exercises often demonstrate improvements in measures of muscle performance simply because of increased familiarity with the exercise equipment and technique. Because of the considerable test-to-test variability in tests of physical function, it is possible that previous studies did not have adequate power to detect meaningful differences in measures of physical function between the placebo and testosterone-treated groups. It is also possible that neuromuscular adaptations needed to translate strength gains into functional improvements require a lot longer than the 3 to 6-month duration of most of the previous trials. The measures of physical function that are more robustly related to lower extremity muscle strength, such as stair climbing speed and power, have shown more consistent improvements in testosterone trials than walking speed (22,23,190).


Only a few testosterone trials have been conducted in older men with functional limitations (22,26,28,190-192). In a trial of pre-frail or frail men (28), administration of 50 mg testosterone gel daily for 6 months induced greater improvements in lean mass, knee extension peak torque, and sexual symptoms than did placebo gel (28). Performance-based measures of physical function did not differ significantly between groups, but they improved in the subgroup of frail elderly men (28). In Testosterone in Older Men (TOM) Trial, older men with mobility limitation were randomly assigned to either placebo or 10 g testosterone gel daily for 6 months (22,190). The testosterone dose was adjusted to achieve testosterone levels between 17.4 nmol/l and 34.7 nmol/L (500 to 1000 ng/dL). The improvements in leg-press strength, chest-press strength and power, and loaded stair-climbing speed and power were significantly greater in men assigned to testosterone arm than in those receiving placebo (Figure 7). A greater proportion of men in the testosterone arm improved more than the minimal clinically important difference for leg-press and chest-press strength and stair-climbing speed than that in the placebo arm. Because of a higher frequency of cardiovascular-related events in the testosterone arm compared with the placebo arm, the trial’s data and safety monitoring board stopped further administration of study medication (22,190). The findings of the TOM trial and other epidemiologic studies have heightened the concern that frail elderly men with a high burden of chronic co-morbidities may be at an increased risk of adverse events (22), providing the impetus to develop, strategies to achieve increased selectivity and a more favourable risk to benefit ratio (22).


The Testosterone Trials were a coordinated set of seven randomized double-blind, placebo-controlled trials designed to determine the benefits of testosterone therapy in older men 65 years and older with low testosterone levels and clinical symptoms of androgen deficiency on a variety of androgen-dependent outcomes (192). To participate in these trials, the men had to be eligible for at least one of the three main trials (the Sexual Function Trial, the Physical Function Trial, or the Vitality Trial). The men were assigned to testosterone or placebo gel for 1 year and the dose was adjusted to maintain testosterone concentrations within the normal range for healthy young men.  The Physical Function Trial of the TTrials recruited older men with self-reported difficulty walking or climbing stairs and walking speed less than 1.2 m/s and an average of two morning fasting testosterone levels less than 275 ng/dL (162). The 6-minute walking distance improved significantly more in the testosterone than in the placebo group among all men in the TTrials, but not in those who were enrolled in the PFT (162). The self-reported physical function assessed using the physical component of the Medical Outcomes Study Short Form-36 questionnaire, improved more in the testosterone group than in the placebo group in all men in TTrials and in men enrolled in the PFT (162). The men in the testosterone group were more likely to report improvement in their walking ability than men in the placebo group. The changes in 6-minute walking distance were significantly associated with changes in testosterone, free testosterone, dihydrotestosterone, and hemoglobin levels, and to baseline gait speed and self-reported mobility limitation (162). Thus, testosterone treatment of older men with mobility limitation consistently improved self-reported walking ability, modestly improved 6-minute walking distance (162). The number of falls was similar in the testosterone and placebo arms (162).


Innovative strategies to translate gains in muscle mass and strength induced by testosterone into functional improvements are needed (18). Resistance exercise training augments the anabolic effects of androgens on muscle mass and performance and physical function (193). Thus, adjunctive exercise training might be required to induce the neuromuscular and behavioural adaptations that are necessary to translate the gains in muscle mass and strength into clinically-meaningful functional improvements (18). In addition, there is some evidence that the anabolic response of skeletal muscle to dietary protein is attenuated with age (194,195). These findings have raised the question whether the current recommended dietary allowance (RDA) for protein (0.8 g/kg/day) is adequate to preserve lean body mass and physical function in older adults. However, In a recent controlled feeding study in functionally-limited older men with usual protein intake less than or equal to the RDA for protein (171) higher protein intake exceeding the RDA did not increase lean body mass, muscle performance or physical function nor augmented the anabolic response to testosterone. However, higher protein intake was associated with lower whole body and visceral abdominal fat, although no significant changes in metabolic biomarkers (fasting glucose, fasting insulin, HOMA-IR, leptin, adiponectin, IL-6, and hs-CRP) were observed (196). These findings suggest that the current RDA for protein is adequate to maintain lean body mass and higher protein intake above the RDA does not promote additional gains in muscle mass or physical function with or without testosterone supplementation.


Mechanisms of Androgen Action on Muscle


Testosterone-induced increase in muscle mass is associated with hypertrophy of both type I and II muscle fibers (197). The absolute number and the relative proportion of type I and type II fibers do not change during testosterone administration. Testosterone-induced muscle fiber hypertrophy is associated with dose-dependent increases in myonuclear number and satellite cell number (198), suggesting that testosterone administration increases the number of muscle progenitor cells.


Testosterone administration has been shown to increase fractional muscle protein synthesis and improve the reutilization of amino acids (173,174). The effects of testosterone on muscle protein degradation have not been well studied. However, the muscle protein synthesis hypothesis does not explain the reciprocal decrease in fat mass or the increases in myonuclear and satellite cell number that occur during testosterone administration (198). Testosterone promotes the differentiation of mesenchymal multipotent muscle progenitor cells into the myogenic lineage and inhibits the differentiation of these progenitor cells into the adipogenic lineage (199,200). Thus, testosterone promotes the formation of myosin heavy chain II positive myotubes in multipotent cells and up-regulates markers of myogenic differentiation, such as MyoD and myosin heavy chain (199,200). Testosterone and DHT inhibit adipogenic differentiation and downregulate markers of adipogenic differentiation, such as PPAR-¡ and C/EBPµ (201). 


Testosterone’s effects on myogenic differentiation are mediated largely through its binding to the classical androgen receptor, which induces a conformational change in the androgen receptor protein, promoting its association with its co-activator, beta-catenin, causing the complex to translocate into the nucleus (200,202). The androgen receptor – beta-catenin complex associates with TCF-4 and activates a number of Wnt target genes (200,202), including follistatin. Follistatin cross-communicates the signal from the AR-beta- catenin pathway to the TGF-beta signaling pathway, blocking signaling through the TGF-beta / Smad 2/3 (201,203). Follistatin plays an essential role in mediating the effects of testosterone on myogenic differentiation (203,204). Jasuja et al (204) found that the administration of recombinant follistatin selectively increased muscle mass and decreased fat mass but had no effect on prostate growth. Recombinant follistatin and testosterone each regulated the expression of a large number of common genes in the skeletal muscle, but they differed substantially in the expression profile of genes activated in the prostate (204). Among the genes activated differentially by testosterone but not by follistatin in the prostate, Jasuja et al (204) identified polyamine pathway as an important signaling pathway. The polyamine pathway has been known to be involved in regulating prostate growth. Administration of testosterone in combination with an inhibitor of ornithine decarboxylase-1, a key enzyme in the polyamine pathway, to castrated male mice restored levator ani muscle mass but not prostate mass, indicating that ODC1 plays an important role in mediating the effects of testosterone on the prostate (Figure 8) (204). Therefore, combined administration of testosterone plus ODC1 inhibitor provides a novel approach for achieving selectivity of testosterone’s anabolic effects on the muscle while sparing the prostate (204).

Figure 8. Testosterone Plus Ornithine Decarboxylase 1 Inhibitor as a Selective Prostate Sparing Anabolic Therapy. Intact and castrated adult male mice were treated for 2-weeks with vehicle or testosterone with and without α-difluoromethylornithine (DFMO), a specific Odc1 inhibitor, as follows: Intact, castrated (Cx), castrated + 15µg/day T (Cx+T), castrated +15µg/day T+ 15µg/day DFMO (Cx+T+DFMO). Levator ani weights (right panel) in mice treated with testosterone plus DFMO were similar to those in intact controls and testosterone-treated castrated mice. Prostate weights in castrated mice were lower than in intact controls and were restored by testosterone administration to levels seen in intact mice (left panel). Mice treated with testosterone plus DFMO had significantly lower prostate weights than intact controls or castrated mice treated with testosterone alone, but not significantly different from those in castrated mice treated with vehicle alone. Thus, testosterone plus ODC1 inhibitor could serve as prostate-sparing selective anabolic therapy. Reproduced with permission from Jasuja et al. Aging Cell. 2014 Apr;13(2):303-10.

The Role of Steroid 5-Alpha Reductase and DHT in Mediating Androgen Effects in the Muscle


Although the enzyme steroid 5-alpha-reductase is expressed at low concentrations within the muscle (205,206), we do not know whether conversion of testosterone to dihydrotestosterone is required for mediating testosterone's effects on the muscle. Men with benign prostatic hypertrophy who are treated with a 5-alpha reductase inhibitor do not experience muscle loss (207). Similarly, individuals with congenital 5-alpha-reductase deficiency have normal muscle development at puberty (207). These data suggest that 5-alpha reduction of testosterone to DHT is not obligatory for mediating its effects on the muscle. However, all the kindred with steroid 5-alpha reductase deficiency that have been published to-date have had mutations of type 2 isoform of the enzyme. Similarly, finasteride is a weak inhibitor of only the type 2 isoform of the enzyme. The circulating concentrations of DHT in male patients with congenital mutation of type 2 steroid 5-alpha reductase enzyme or in men treated with finasteride are lower than eugonadal men; however, these patients still produce significant amounts of DHT and their circulating DHT concentrations are often in the lower end of the range in healthy young men. Long-term administration of dutasteride, a dual and potent inhibitor of both 5-alpha reductase isoforms, has not been associated with significant reductions in bone mineral density (207). This issue is important because if 5-alpha reduction of testosterone to DHT were not obligatory for mediating its anabolic effects on the muscle, then it might be beneficial to administer testosterone with an inhibitor of steroid 5-alpha reductase or to develop selective androgen receptor modulators that do not undergo 5-alpha reduction.


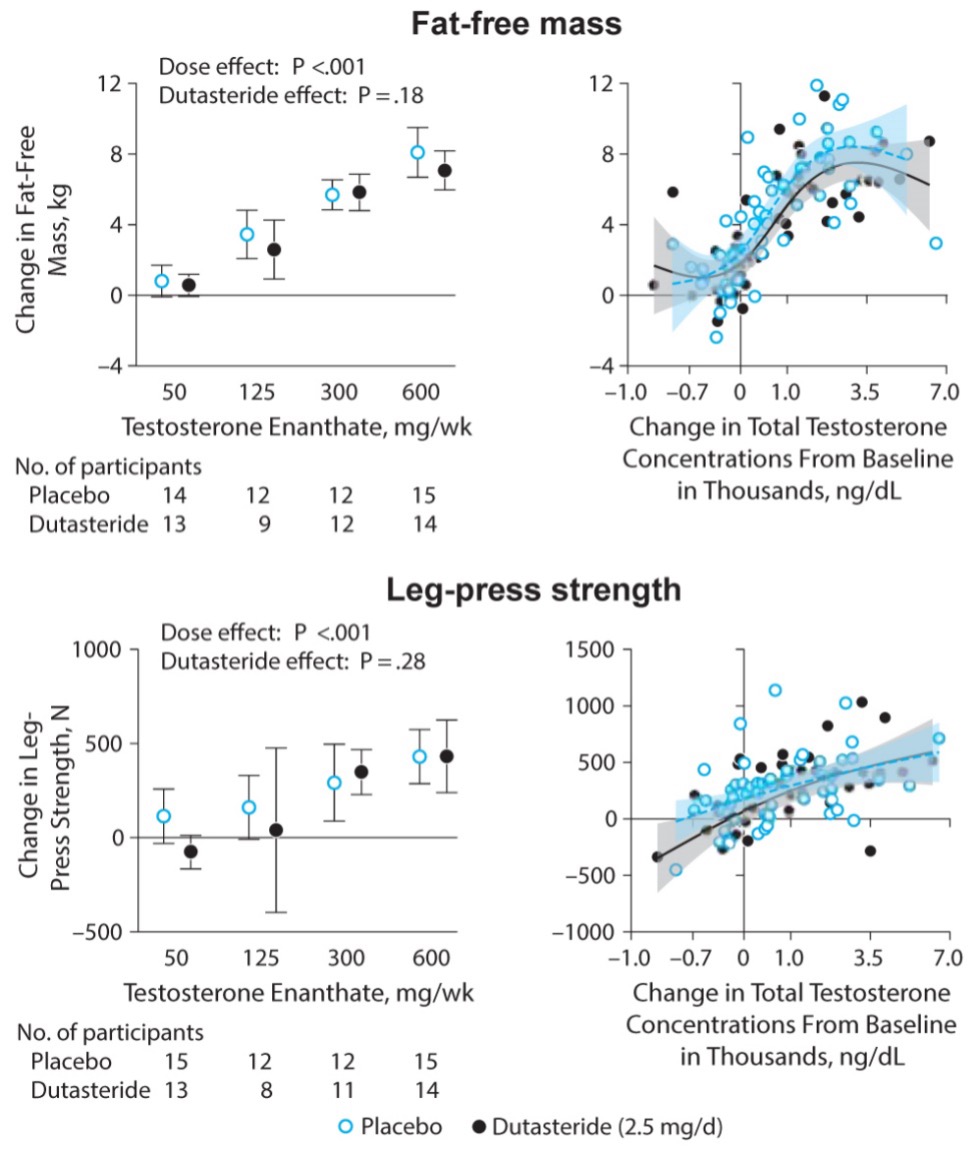
To determine whether testosterone’s effects on muscle mass and strength, sexual function, hematocrit, prostate, sebum production, and lipids are attenuated when its conversion to DHT is blocked, we administered to healthy men, 21-50 years, a long-acting GnRH-agonist to suppress endogenous testosterone. We randomized them to placebo or dutasteride (dual inhibitor of steroid 5-alpha reductase type 1 and 2) 2.5-mg daily, plus 50, 125, 300, or 600-mg testosterone enanthate weekly for 20-weeks (208). Changes in lean and fat mass, leg-press and chest-press strength, were related to testosterone dose but did not differ between placebo and dutasteride groups (208). The relation between testosterone concentrations and the changes in lean body mass, maximum voluntary muscle strength, hematocrit, and sebum production was similar between dutasteride and placebo arms (Figure 9) (208). Changes in sexual-function scores, bone markers, prostate volume, and PSA did not differ between groups (208). These data indicate that testosterone’s conversion to DHT is not essential for mediating its effects on muscle mass and strength, sexual function, hematocrit, or sebum production in men over the range of testosterone concentrations achieved in this trial (208). These data are consistent with studies that have reported that administration of steroid 5α-reductase inhibitors has little or no effect on muscle or bone mass (209-211). The isoforms of steroid 5α reductase enzyme also catalyze the 5α reduction of cortisol, progesterone, bile acids and other metabolites. In the central nervous system, 5α-reductase is the rate-limiting enzyme in the conversion of progesterone to allopregnanolone that serves as a positive allosteric modulator of gamma-aminobutyric acid (GABA) A receptors to modulate neural pathways that regulate mood, affect, and  cognition (212-214). Low levels of allopregnanolone have been implicated in the pathogenesis of some forms of depressive and anxiety disorders (215). An intravenous preparation of allopregnanolone was found to be efficacious and approved for the treatment of postpartum depression (216,217) and is being investigated for the treatment of other depressive disorders. Steroid 5α-reductase enzymes are also involved in cortisol metabolism and in the pathogenesis of metabolic disease (218).

Figure 9. The Role of 5-alpha-Dihydrotestosterone in Men. In this randomized trial, healthy men, 18-50 years, received a long-acting GnRH-agonist to suppress endogenous testosterone. They were then randomized to either placebo or dutasteride (dual inhibitor of steroid 5-alpha reductase types 1 and 2) 2.5-mg daily, plus 50, 125, 300, or 600-mg testosterone enanthate weekly for 20-weeks (535). Changes in fat-free mass (upper panel) and leg-press strength (lower panel), were related to testosterone dose but did not differ between placebo and dutasteride groups (535). The relationship between change in total testosterone (TT) levels and change in fat-free mass and leg press strength (right panels) did not differ between men assigned to placebo or dutasteride arms. Reproduced with permission from Bhasin et al, JAMA. 2012 Mar 7;307(9):931-9.

The Role of CYP19A1 (Aromatase) in Mediating Testosterone’s Effects on the Muscle


Studies of aromatase knockout mice have revealed higher fat mass and lower muscle mass in mice that are null for the P450-linked CYP19A1 aromatase gene (219). Similarly, humans with CYP19A1 mutations have decreased muscle mass and increased fat mass, and they exhibit insulin resistance (220). Data from these experiments of nature suggest that aromatization of testosterone to estradiol is important in mediating androgen effects on body composition. Finkelstein et al (221) have recently examined the relative roles of testosterone and estradiol in regulation of muscle and fat mass, and sexual function. These investigators found that testosterone’s effects on lean mass, muscle size, and strength were not significantly attenuated when its conversion to estradiol was blocked by administration of an aromatase inhibitor (221).


REGULATION OF FAT MASS, FAT DISTRIBUTION, AND METABOLISM BY TESTOSTERONE         


Testosterone is an important regulator of fat mass and distribution. Lowering testosterone concentrations by administration of a GnRH agonist increases fat mass, and testosterone administration in hypogonadal men decreases whole body fat mass (159,222-224). The loss of fat mass during testosterone administration occurs both in the appendices as well as the trunk and is distributed evenly between the superficial subcutaneous and deep intra-abdominal and intermuscular compartments (166,223). The effects of testosterone on whole body fat mass are related to the administered testosterone dose and the circulating testosterone concentrations (166,223).


Mechanisms of Testosterone’s Effects on Fat Mass and Metabolism  


The effects of testosterone on fat mass are mediated through its conversion to estradiol by the aromatase enzyme encoded by CYP19A1 (221).  Men with inactivating mutations of CYP19A1 are characterized by increased fat mass, metabolic syndrome, hepatic steatosis, and insulin resistance (225-227). Estradiol replacement of male aromatase knockout mice reverses the adiposity and metabolic abnormalities associated with estrogen deficiency (228).


Testosterone regulates adipose tissue mass and metabolism through multiple mechanistic pathways. Androgens inhibit adipogenic differentiation of multipotent mesenchymal progenitor cells; these effects are blocked by androgen receptor blocker, bicalutamide (200,201,229). Testosterone regulates fat oxidation but does not appear to affect triglyceride secretion over short durations (230).


Testosterone, after its aromatization to estradiol, acts through the estrogen receptors in specific brain regions to regulate eating behavior, energy expenditure, and adipose tissue metabolism. The deletion of estrogen receptor α (ER-α) in specific brain regions is associated with adiposity, hyperphagia, and hypometabolism (231); estradiol acting through ER-α regulates eating behavior and energy expenditure differentially through actions on different hypothalamic neurons (231).  Activation of estrogen receptor β (ER-β) by selective agonists inhibits weight gain, adiposity, increases energy expenditure and thermogenesis, and reverses hepatic steatosis in mice through direct effects on xenobiotic and bile acid receptors in the liver (232).


TESTOSTERONE AND SEXUAL FUNCTION IN OLDER MEN     


Regulation of Sexual Function by Testosterone  

Sexual function in men is a complex process that includes central mechanisms for regulation of sexual desire and arousal, and local mechanisms for penile tumescence, orgasm, and ejaculation (233). Primary effects of testosterone are on sexual interest and motivation (233-238). Testosterone replacement of young, androgen deficient men improves a wide range of sexual behaviors including frequency of sexual activity, sexual daydreams, sexual thoughts, feelings of sexual desire, attentiveness to erotic stimuli, and spontaneous erections (233-241).  Kwan et al (237)demonstrated that androgen-deficient men have decreased frequency of sexual thoughts and lower overall sexual activity scores; however, these men can achieve erections in response to visual erotic stimuli. Hypogonadal men have lower frequency and duration of the episodes of nocturnal penile tumescence; testosterone replacement increases both the frequency and duration of sleep-entrained, penile erections (239-241). Although both orgasm and ejaculation are believed to be androgen-independent, hypogonadal men have decreased ejaculate volume and their orgasm may be delayed.


Although hypogonadal men can achieve erections, it is possible that achievement of optimal penile rigidity might require physiologic testosterone concentrations. Testosterone regulates nitric oxide synthase activity in the cavernosal smooth muscle (242). Testosterone administration in orchiectomized rats increases penile blood flow and has trophic effects on cavernosal smooth muscle (243-245).


In male rodents, all measures of mating behavior are normalized by relatively low testosterone levels that are insufficient to maintain prostate and seminal vesicle weight (246,247). Similarly, in men, sexual function is maintained at relatively low normal levels of serum testosterone (221,238,248). Testosterone’s effects on libido are mediated through its conversion to estradiol (221).

Total and free serum testosterone levels are positively associated with sexual desire, erectile function and sexual activity in older men with unequivocally low testosterone levels and symptoms of sexual dysfunction (114). These findings suggest that low testosterone levels may contribute to impaired sexual functioning in older men.


Erectile dysfunction and androgen deficiency are two common but independently distributed, clinical disorders that sometimes co-exist in the same patient (112,113,233,249). Hypogonadism is a clinical syndrome that results from androgen deficiency (16); in contrast, erectile dysfunction is usually a manifestation of a systemic vasculopathy, often of atherosclerotic origin. Thus, androgen deficiency and erectile dysfunction have distinct pathophysiology. Eight to ten percent of middle-aged men presenting with erectile dysfunction have low testosterone levels (113,249-251).


Clinical Trials of the Effects of Testosterone Therapy on Sexual Function of Older Men with Low Circulating Testosterone Concentrations


In open-label trials, testosterone treatment has been shown to improve sexual function in young men with classical hypogonadism due to disorders of the hypothalamus, pituitary, or testes (159,252). However, previous trials evaluating the benefits of testosterone therapy in men 60 years and older with age-related decline in testosterone levels on sexual functioning have yielded inconsistent results (253), with some studies showing improvement (254,255), while others have suggested no clear benefit (23). The inconsistencies in these previous studies are due to several factors, including small sample sizes, inclusion of men who were not clearly hypogonadal or did not have sexual symptoms, inclusion of men with heterogeneous sexual disorders, variable treatment durations, and the use of outcomes assessment tools that had not been rigorously validated.


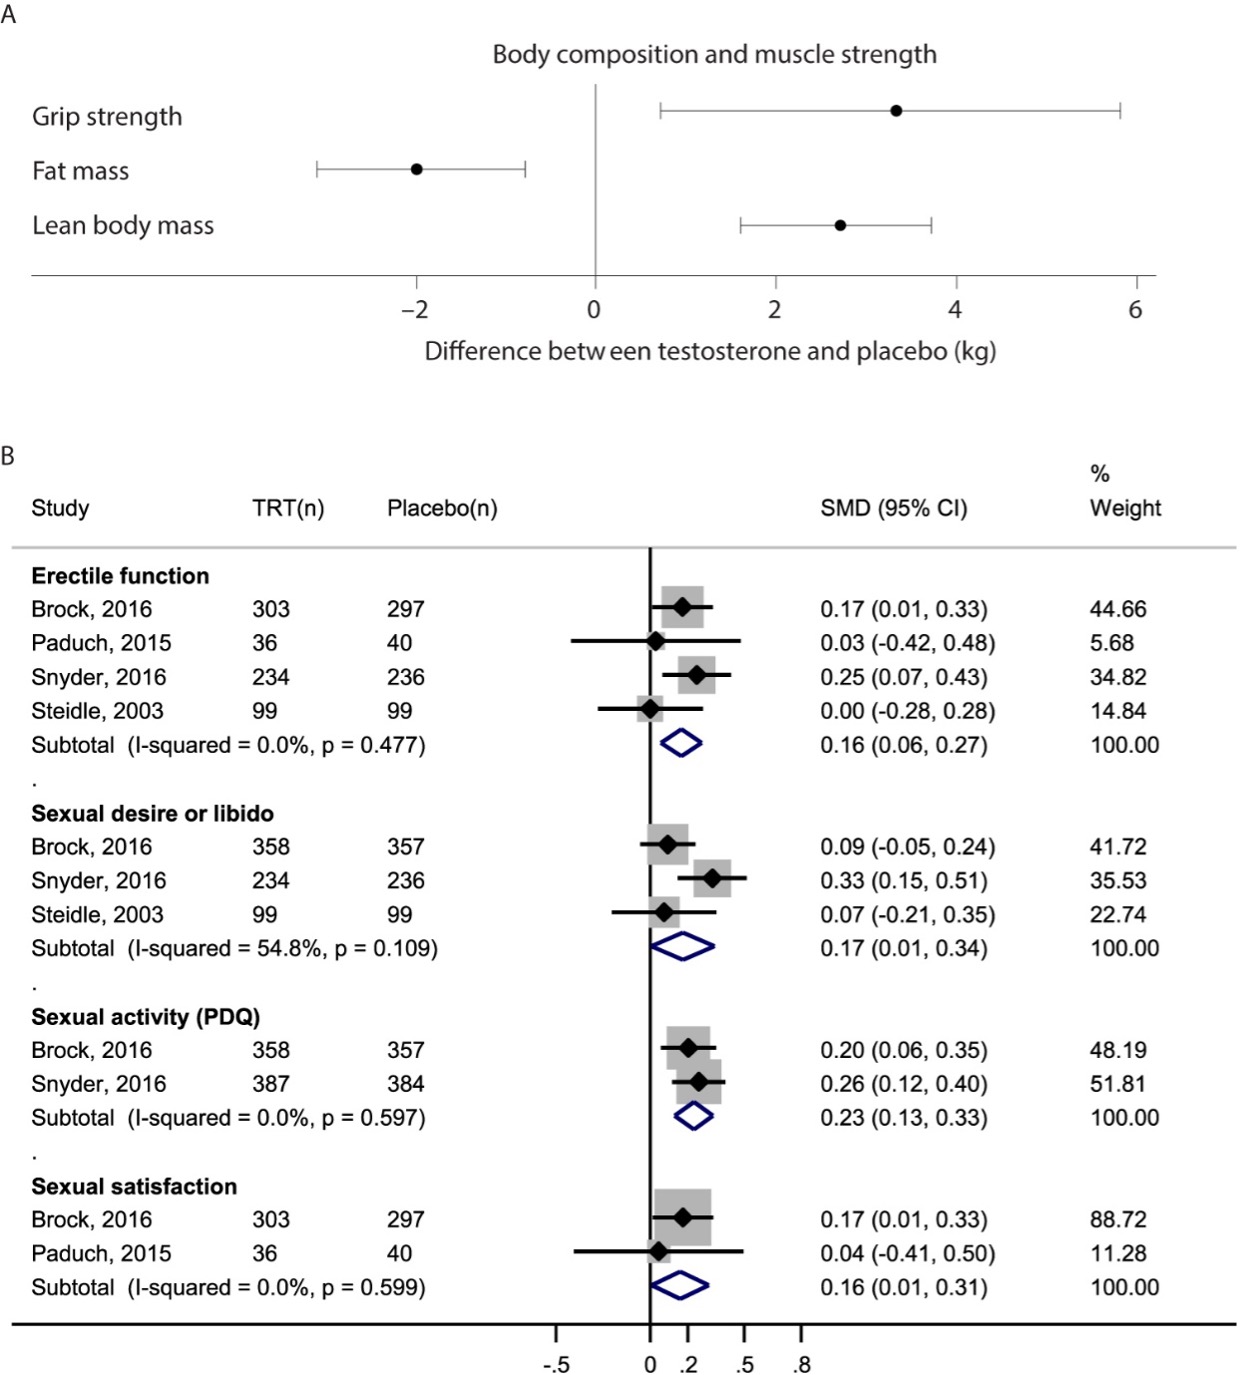
In a small number of placebo-controlled trials of testosterone that have been conducted in men with sexual symptoms and low testosterone levels (24,26,161), testosterone replacement has been associated with a small but significant increase in overall sexual activity, sexual desire, erectile function, and sexual satisfaction.  A meta-analysis of these placebo-controlled trials found that testosterone replacement of hypogonadal men is associated with a small but significant increase in sexual desire [standardized mean difference (SMD): 0.17; 95% CI, 0.01, 0.34], erectile function (SMD: 0.16; 95% CI, 0.06, 0.27), and sexual satisfaction (SMD: 0.16; 95% CI, 0.01, 0.31) (256). 


The Sexual Function Trial of the TTrials determined the efficacy of testosterone treatment for 1-year on sexual function in symptomatic, community-dwelling, older men ≥65 years with low testosterone levels (26). Testosterone administration for 1-year to raise testosterone concentrations into a range that is mid-normal for healthy young men was associated with significant improvements in sexual activity, desire, and erectile function (257). The treatment effects tended to wane over time, and the effect on erectile function was substantially smaller than that reported with phosphodiesterase 5 inhibitors (258). The magnitude of increase in testosterone levels was related to the improvements in sexual activity and desire, but not erectile function (257). There was no clear testosterone threshold level of effect.


Testosterone does not improve sexual function in middle-aged and older men who have normal testosterone levels and do not have any sexual symptoms (23). Testosterone replacement therapy does not improve ejaculatory function in men with ejaculatory disorder (259).


It had been speculated that testosterone administration might improve erectile response of men with ED to selective phosphodiesterase inhibitors (260-262). To determine whether the addition of testosterone to a phosphodiesterase-5-inhibitor improves erectile response, we conducted a randomized, placebo-controlled trial (263), in men, 40-to-70 years, with erectile dysfunction and low total testosterone< 11.5 nmol/L (330ng/dL) and/or free testosterone <173.5 pmol/L (50 pg/mL). All participants were initially started on sildenafil alone and the sildenafil dose was optimized based on their response during a 3 to 7-week run-in period (263). The participants were then randomized to 10-g testosterone or placebo gel for 14-weeks in combination with the optimized sildenafil dose (263). The administration of sildenafil alone was associated with substantial increases in erectile function domain (EFD) score and total and satisfactory sexual encounters (263). However, the change in EFD score in men assigned to testosterone plus sildenafil did not differ significantly from that in men assigned to placebo plus sildenafil (263). Changes in total and successful sexual encounters, quality-of-life, and marital-intimacy did not differ between testosterone and placebo groups. Even among the subsets of men with baseline testosterone <250 ng/dL or those without diabetes, there were no significant differences in EFD scores between the two arms (263). Another placebo-controlled trial of men with erectile dysfunction who were non-responders to tadalafil also did not show a greater improvement in erectile function in men assigned to the testosterone arm than in those assigned to the placebo arm (262). Thus, in randomized trials, the addition of testosterone to PDE5Is has not been shown to improve erectile function in men with erectile dysfunction (262,263).

Synopsis of The Effects of Testosterone on Sexual Function


In older hypogonadal men with low sexual desire, testosterone treatment improves sexual desire, erectile function, and overall sexual activity. Androgen deficiency is an important cause of low sexual desire disorder (233). Therefore, serum testosterone concentrations should be measured in the diagnostic evaluation of hypoactive sexual desire disorder as well as erectile dysfunction, recognizing that low sexual desire is often multifactorial; systemic illness, relationship and differentiation (the ability of individuals in a relationship to maintain their distinct identities) issues, depression, and many medications can be important antecedents or contributors to low sexual desire and sexual dysfunction.


TESTOSTERONE EFFECTS ON BONE MINERAL METABOLISM        


The Effects of Androgen Deficiency on Bone Mass


Testosterone deficiency is associated with a progressive loss of bone mass (264-267). In one study performed in sexual offenders (264), surgical orchiectomy was associated with a progressive decrease in bone mineral density of a magnitude similar to that seen in women after menopause. Similarly, androgen deficiency induced by the administration of a GnRH agonist, surgical orchiectomy, or an androgen antagonist for the treatment of prostate cancer leads to loss of bone mass (265-267) and an increase in fracture risk (268,269), which is related to the dose of GnRH agonist and the degree of testosterone suppression (270). In male rats, surgical orchiectomy or androgen blockade by administration of an androgen receptor antagonist is associated with loss of bone mass (271).


Androgen deficiency that develops before the completion of pubertal development is associated with reduced cortical and trabecular bone mass (272,273). During the pubertal years, bone accretion, and bone length and thickness is regulated by sex steroids. During puberty, sex hormones slow long bone growth and accelerate axial growth. Prepubertal sex hormone deficiency allows continued long bone growth and slows axial growth resulting in longer limbs and a shorter trunk (eunuchoidal proportions)  (274). Sex differences in bone width are also established during pubertal development. Men increase bone width by periosteal bone formation and women mostly by endocortical apposition  (275). Young men with constitutional delay of puberty have lower bone mineral density (276), which does not improve spontaneously 2 years later (277). Indeed, men with hip fractures have been shown to have smaller femoral head diameters, which may potentially be related to delayed puberty (278). Therefore, individuals with sex-steroid deficiency before or during peri-pubertal years may end up with suboptimal peak bone mass and increased lifetime fracture risk. Similarly, men with acquired androgen deficiency have lower bone mineral density than age-matched controls (155).


Clinical Trials on The Effects of Testosterone Therapy on Bone in Young, Hypogonadal Men


Testosterone therapy of healthy, young, hypogonadal men is associated with significant increases in vertebral bone mineral density (156,279-283). However, bone mineral density is typically not normalized after 1-2 years of testosterone replacement therapy (156). Some hypogonadal patients included in these testosterone trials had panhypopituitarism and also suffered from growth hormone deficiency. It is possible that concomitant GH replacement might be necessary for restoration of normal bone mineral density. Excessive glucocorticoid replacement might also contribute to bone loss in these patients. In addition, some participants had experienced testosterone deficiency before the onset and completion of pubertal development; the individuals who develop androgen deficiency during the critical pubertal developmental window of bone accretion, may end up with decreased peak bone mass, and testosterone administration may not be able to restore bone mass to levels seen in eugonadal age-matched controls. Many testosterone replacement trials were less than 3 years in duration, and it is possible that a longer period of testosterone administration might be necessary to achieve maximal improvements in bone mineral density. Indeed, Behre et al (279) reported that bone mineral density in some hypogonadal men continued to increase even after many years of testosterone treatment using a scrotal transdermal patch and reached the levels expected for age-matched eugonadal controls.


Cross-Sectional Studies of the Relationship Between Sex-Hormone Concentrations and Osteoporosis in Older Men 


The age-related decline in sex hormones is associated with age-related changes in bone mineral density and increased risk of osteoporotic fractures (131-136,284,285). Older men with hip fractures have lower testosterone levels than age-matched controls (286). Bioavailable testosterone levels have been found to be better predictors of fracture risk than total testosterone levels (287). Interestingly, a U-shaped association between endogenous testosterone concentrations and incident fractures was recently observed, with midrange plasma testosterone levels being associated with lower incidence of any fracture and with hip fracture compared to lower or higher testosterone (288). Men with osteoporosis have been found to have lower DHT levels than those without osteoporosis (289). In the Cardiovascular Health Study, in which testosterone and DHT levels were measured by liquid chromatography–tandem mass spectrometry, circulating DHT, but not testosterone, was found to be negatively associated with hip fracture risk in men (290).


In epidemiologic studies, estradiol levels are more strongly associated with bone mineral density of the spine, hip, and distal radius than total testosterone levels (132,134,135,285). Men with low bioavailable estrogen have increased risk of non-vertebral fracture which is increased further in those with low bioavailable estrogen, low bioavailable testosterone as well as high SHBG (287) suggesting a complex interplay of these hormones in fracture resilience.  Mendelian randomization analysis have found that increased genetically determined estradiol levels are associated with increase in lumbar spine bone mineral density (291) and lower fracture risk (292).  The CYP19A1 alleles associated with higher estradiol levels are associated with higher bone mineral density (291).


Clinical Trials of the Effects of Testosterone Therapy on Bone of Middle-Aged and Older Men with Low Circulating Testosterone Concentrations 


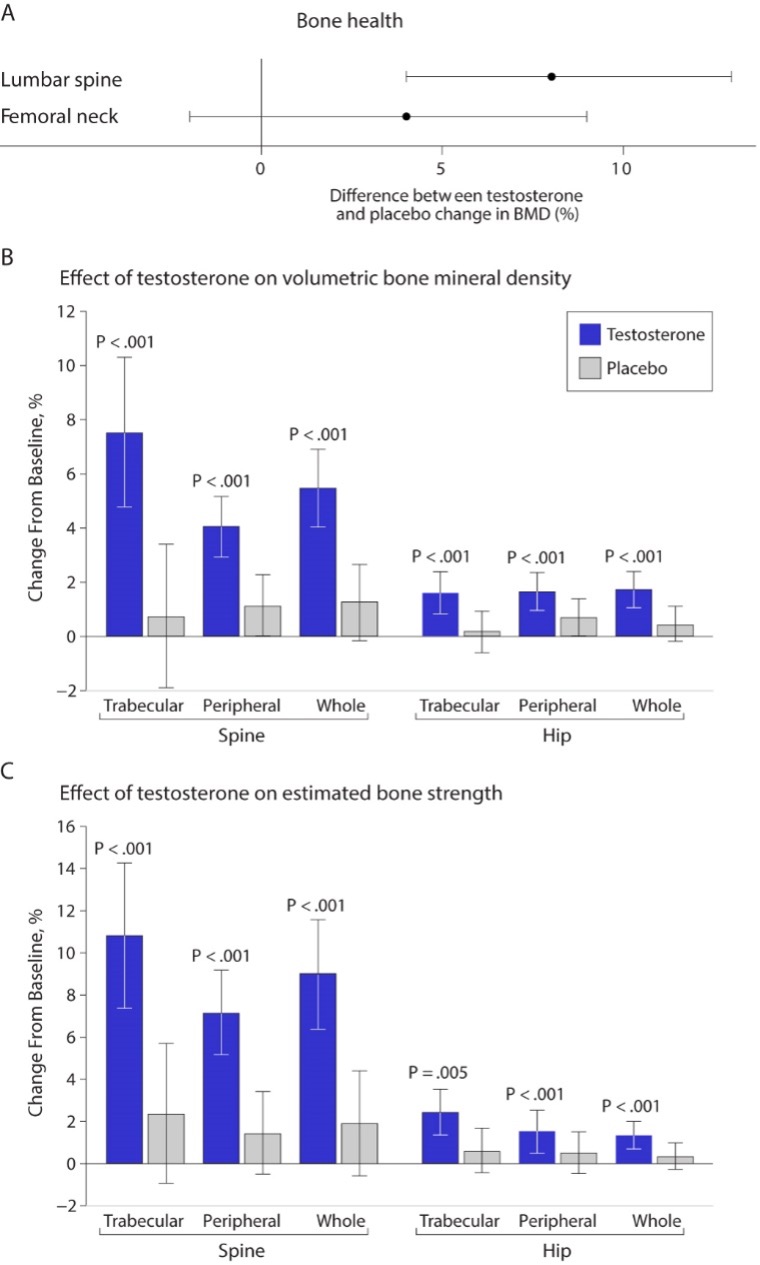
Earlier studies of testosterone replacement of relatively healthy older men that examined the effects of testosterone on bone mineral density reported inconsistent results (188,189,293,294). One study found greater increases in vertebral bone mineral density in the testosterone arm of the trial than in the placebo arm, while another study did not find any significant differences between the change in vertebral or femoral bone mineral density between testosterone and placebo groups (294). A meta-analysis of randomized trials found a significantly greater increase in lumbar bone mineral density but not in femoral bone mineral density in the testosterone arms of trials that used intramuscular testosterone than in placebo arms (Figure 10) (295); transdermal testosterone had no significant effect.

Figure 10. The effects of testosterone therapy on bone health in intervention trials. Panel A shows the effects of testosterone therapy on lumbar and femoral bone mineral density in a meta-analysis of randomized trials (data derived from a meta-analysis by Tracz et al, J Clin Endocrinol Metab. 2006;91(6):2011-6.; figure adapted with Spitzer et al. Nat Rev Endocrinol. 2013;9(7):414-24). Panels B and C show the effects of testosterone replacement for 12 Months on volumetric bone mineral density and estimated bone strength of trabecular, peripheral, and whole bone of the spine and hip, as assessed by quantitative computed tomography (figure reproduced with permission from Snyder et al. JAMA Intern Med. 2017;177(4):471-479).

The Bone Trial of the TTrials determined the effects of testosterone replacement for 1-year in men 65 years or older with low testosterone levels on volumetric bone mineral density and bone strength using quantitative computed tomography (296). This trial found significantly greater increases in volumetric bone mineral density and estimated bone strength in the testosterone arms compared to placebo; specifically, these increases were most prominent in the spine than hip and more in trabecular than peripheral bone (Figure 10). The treatment effects on volumetric bone density and bone strength observed in the TTrials compare favorably with those reported in trials of bisphosphonates and some selective estrogen receptor modulators.


The T4Bone substudy of the T4DM trial determined the effect of 24 months of testosterone treatment on bone microarchitecture and bone mineral density of men aged 50 years or older enrolled in a community-based lifestyle program using high resolution-peripheral quantitative computed tomography (297). Compared to placebo, testosterone treatment increased cortical and total bone mineral density of the tibia and radius, as well as cortical area and thickness at both sites. Testosterone treatment also increased areal thickness at the lumbar spine (297).


Future studies are needed to determine whether these improvements from testosterone treatment are associated with reduced fracture risk in older men with low testosterone levels.


Mechanisms of Androgen Action on the Bone 


Testosterone increases bone mass by several mechanisms (298). Short-term studies of androgen replacement have shown inconsistent increases in markers of bone formation, but a more consistent reduction in markers of bone resorption (283,298-300). These observations suggest that testosterone increases bone mineral density in part through its aromatization to estrogen, which inhibits bone resorption. Estrogen deficiency contributes to increased bone resorption and remodeling by multiple mechanisms. Estrogens regulate the activation frequency of bone functional basic multicellular units, the duration of the resorption phase and the formation phase, and osteoclast recruitment (301). The protective effects of estrogen on bone in both male and female mice during growth and maturation are mediated largely through estrogen receptor-alpha (302-308). 17β-estradiol has also been shown to increase connexin-43 based intracellular communication which may modulate the bone response to mechanical loading in osteocytes (309). Dias and colleagues found that treatment with testosterone for 12-months improved lumbar spine bone mineral density compared to placebo but not in men treated concomitantly with anastrozole, suggesting that aromatization of testosterone to estrogen may be required for maintaining bone mineral density (310). Similarly, another recent study found significant reduction in spine bone mineral density in men treated with testosterone and anastrozole for 16-weeks that was independent of testosterone dose (311). In addition, treatment with lower testosterone doses were associated with greater increases in bone turnover markers; an effect that was significantly greater in combination with anastrozole. DHT suppresses osteoclast formation in vitro via NF-kB ligand (RANKL) mediated effects, comparable to estradiol (312); the clinical significance of DHT in suppressing bone resorption is incompletely understood.


Testosterone also directly stimulates osteoblastic bone formation. Androgen receptors have been demonstrated on osteoblasts and on mesenchymal stem cells (313). Testosterone stimulates cortical bone formation (314). Sclerostin is secreted by osteocytes and inhibits osteoblast differentiation. Sclerostin was found to be negatively related to total and free testosterone in men with idiopathic osteoporosis (312). Hypogonadal men have higher serum sclerostin levels than eugonadal men, and DHT directly suppresses sclerostin production in cultured human osteocytes through an AR-mediated mechanism (315). Testosterone also stimulates the production of several growth factors within the bone, including IGF-1; these growth factors may contribute to bone formation (316). Leydig cells in the testis secrete insulin-like peptide 3 (INSL3) in addition to testosterone. INSL3 has been reported to have a negative association with sclerostin in specific populations and INSL3 downregulates sclerostin protein expression in cultured osteocytes (317). Osteocalcin secreted by osteoblasts acts on Leydig cells through the GPRC6A receptor, suggesting a possible feedback mechanism for bone-testis crosstalk (318). Testosterone increases muscle mass, which may indirectly increase bone mass by increased loading. Testosterone might inhibit apoptosis of osteoblasts through non-genotropic mechanisms (319,320). In addition to its effects on bone mineral density, testosterone might reduce fall propensity because of its effects on muscle strength and reaction time.


We have shown that testosterone has dose dependent effects on erythropoiesis (321) possibly through increased erythropoietin and reduced hepcidin (322). Hematopoietic cells and bone cells are interdependent and support each other at different stages in development   (323,324). Androgen deficiency seems to favor hematopoietic precursor differentiation to an osteoclast fate (312), which is consistent with the decreased bone resorption observed with testosterone supplementation (275,287-289). We have shown that older men in the MrOS study with accelerated bone density loss (>0.5%/year) have increased risk of anemia (325), and that anemia increases the risk of non-spine fractures independent of bone density (326). In a prospective analysis of the Cardiovascular Health Study, we have recently shown that men with anemia and, separately, men with decreasing hemoglobin were at increased risk of hip fracture (327). Low endogenous testosterone levels have been associated with lower hemoglobin (328), which is reversible with testosterone supplementation (329). It is possible that testosterone sufficiency is required for a healthy hematopoietic niche in men, which is then able to support a favorable microenvironment for bone health.


In men androgens and estrogens both play independent roles in regulating bone resorption (301). Estradiol levels above 10 pg/ml are generally believed to be sufficient to prevent increases in bone resorption and decreases in BMD in men (311).


Synopsis of The Effects of Testosterone on Bone 


Testosterone replacement has been shown to increase vertebral and femoral bone mineral density, and bone strength in older men with unequivocally low testosterone levels (16). Testosterone increases bone mass by multiple mechanisms. Testosterone’s aromatization to estrogen plays an important role in regulating bone health in men. Testosterone’s effects on fracture risk have not been studied. 


TESTOSTERONE EFFECTS ON COGNITIVE FUNCTION        


Cross-Sectional and Longitudinal Studies Correlating Sex-Hormone Levels and Cognitive Function


Several lines of evidence suggest that testosterone regulates several domains of cognition, sexually dimorphic behaviors, mood, and affect, and the neuropathology of Alzheimer’s Disease (AD). Testosterone is aromatized to estrogen in the brain, and some effects of testosterone on cognition might be mediated through its conversion to estradiol. Additionally, androgen receptors are expressed in the brain (330), and androgen effects on brain organization during development (331,332) are mediated through androgen receptor. Androgens increase neurite arborization, facilitating intercellular communication (331-334). Testosterone is metabolized in neurons as well as in glial cells to DHT, which is further converted reversibly in some cell types such as type 1 astrocytes to 5α-androstane-3α,17β-diol (335), which is a potent modulator of GABA on GABAA receptors but a weak ligand for AR and ER (336). The 3β isomer of androstanediol, 5α-androstan-3β,17β-diol, is also synthesized in the brain; this steroid is a ligand for ERβ (337).  Thus, testosterone treatment may potentially expose the brain to a range of biologically active metabolites, all of which may contribute to the observed responses. Testosterone also affects serotonin, dopamine, acetylcholine (333), and calcium signaling (334). Thus, testosterone could influence cognitive function and the development and progression of AD neuropathology through multiple mechanistic pathways.


The age-related decline in serum testosterone levels has been associated with impairment in cognitive function (338). Androgens effects on cognitive function are domain-specific. For instance, observations that men outperform women in a variety of visuo-spatial skills suggest that androgens enhance visuo-spatial skills (339). In !Kung San hunter-gatherers of Southern Africa, testosterone, but not estradiol, levels correlated with better spatial ability and with worse verbal fluency (340). Women with congenital adrenal hyperplasia with high androgen levels score higher on tests of spatial cognition than their age- and gender-matched siblings (341). 46, XY rats with androgen insensitivity perform worse on tests of spatial cognition than their age-matched controls (342). Other studies have reported a complex relationship between androgen levels and spatial ability (123,343-345). Circulating levels of dihydrotestosterone, a metabolite of testosterone that is not converted to estrogen, positively correlated with verbal fluency (340). Barrett-Conner et al (122) found positive associations between total and bioavailable testosterone levels, and global cognitive functioning and mental control, but not with visuospatial skills. In the Baltimore Longitudinal Study of Aging (346), higher free testosterone index was associated with better scores on visual and verbal memory, visuospatial functioning, and visuomotor scanning. Men with low testosterone levels had lower scores on visual memory and visuospatial performance (346); however, some studies have shown no association of serum testosterone levels with domains of visual and verbal memory, and executive function in older men (347,348). In the Concord Health and Aging in Men Project, the authors found that changes in serum testosterone levels over time, rather than baseline testosterone levels, were predictive of cognitive decline (338).


The Potential Role of Testosterone in the Pathobiology of Alzheimer's Disease


A large body of preclinical and epidemiologic data shows that testosterone acts as a negative regulator of endogenous Ab amyloid accumulation in the brain, attenuates tau phosphorylation, reduces neuro-inflammation, exerts neuronal protective effect in response to injury and disease, and promotes neuronal regeneration and connectivity. However, the randomized trials data generated largely in community dwelling middle-aged and older adults without cognitive deficits or Alzheimer's Disease neuropathology have been inconclusive for reasons that are discussed below.   


Testosterone acts as a negative regulator of endogenous Ab amyloid accumulation in the brain through multiple mechanisms. Surgical orchiectomy of male rats is associated with increased accumulation of Ab amyloid in the brain; the accumulation of Ab amyloid in surgically orchiectomized rats is prevented by DHT administration but not by estradiol administration (349-351).  In male Brown-Norway rats, age-related decreases in testosterone and DHT are associated with increased brain levels of Ab amyloid (350). Testosterone promotes the conversion of amyloid precursor protein (APP) to soluble APP-alpha rather than A beta amyloid. Consistent with these findings, prolonged treatment of cultured cortical neurons and neuroblastoma cell lines with testosterone resulted in increased production of soluble sAPP-a and decreased production of Ab amyloid (349). This effect of testosterone on the processing of APP is mediated in part through its aromatization to estradiol (352). However, there is strong evidence of mediation through a direct androgen receptor (AR)-mediated pathway as well (350-353). 


In 3XTg-AD mouse model of Alzheimer’s Disease, orchiectomy at age 3 months is associated with significantly increased accumulation of Ab amyloid in hippocampus CA1, amygdala, and subinculum at age 6 months (352,353).  DHT treatment of orchiectomized mice prevents the accumulation of Ab amyloid as well as deterioration of spontaneous alternation behavior (353).  DHT also reduces Tau-phosphorylation in orchiectomized triple transgenic mouse model of AD (352).  Androgens upregulate the expression of neprilysin, the enzyme that catalyzes the degradation and clearance of Ab amyloid in neuronal cells (354) and decrease Ab amyloid accumulation (355). 


Testosterone also attenuates AD-like tau pathology. In gonadectomized mice, testosterone as well as estradiol reduce tau phosphorylation (356,357).  Androgens also reduce tau phosphorylation induced by acute heat shock and injury in male rats independent of estradiol (358).


Testosterone exerts neuroprotective effects in many brain regions. Androgens promote neuronal viability during neural development as well as in adult brain following mechanical injury and disease-related toxicity  (359-361).  Testosterone protects motor neurons in the spinal cord following axotomy (359-361).  In this experimental model, testosterone treatment accelerates the rate of nerve regeneration and attenuates neuronal loss (359,360,362-364).


Testosterone exerts neuroprotective effects across the lifespan in brain areas susceptible to neurodegeneration in AD (365-368). Thus, in cultured neurons, testosterone reduces neuronal apoptosis induced by oxidative stress and Abamyloid (369-371).


Testosterone promotes neuronal growth, connectivity, and functioning. Testosterone increases neurite arborization, and synapse formation facilitating intercellular communication (372-375).  Testosterone also has nongenomic effects, and affects serotonin, dopamine, acetylcholine and calcium signaling (376-378).  Androgen receptors are expressed in the brain, and androgen effects on organization of the brain during development are likely mediated directly through AR. Some additional effects of testosterone are mediated through its conversion to estradiol.


Testosterone also exerts protective effects against neuroinflammation. Orchiectomy as well as obesogenic diet are each associated with increased expression levels of proinflammatory cytokines TNF-alpha and IL-1beta in the cerebral cortex in middle-aged male rats (370). The castration-induced upregulation of proinflammatory cytokines TNFa and IL-1b effect is prevented by testosterone supplementation (370). Similar stimulatory effects of testosterone on the expression of proinflammatory cytokines were observed in mixed glial cell cultures in vitro (370).  5aDihydrotestosterone inhibits interleukin-1a or tumor necrosis factor a-induced proinflammatory cytokine production via androgen receptor-dependent inhibition of nuclear factor kB activation (371). Low testosterone also is associated with increased macrophage infiltration in sciatic nerve in castrated male rats (371). The mechanisms of these protective effects of testosterone on neuroinflammation are incompletely understood but appear to require both androgen receptor and estrogen receptor-mediated pathways (371).


Epidemiological Data on the Association of Testosterone Levels with Cognitive Function and AD Pathology


Some but not all epidemiologic studies have found an association between low circulating testosterone levels and AD (346,379-384); the relation appears to be stronger between free testosterone levels and the risk of AD than between total testosterone and AD (346). The strength of the association between testosterone and AD is affected by apolipoprotein ε4 genotype, a genetic risk factor for AD (380); men with one or more ε4 alleles have lower testosterone levels and a higher risk of AD than men without an ε4 allele (380).


In longitudinal follow-up of male participants of the Baltimore Longitudinal Study on Aging (346), the men who were healthy at baseline and developed a clinical diagnosis of AD had significantly lower free testosterone levels than those who did not develop AD.  The age-related decline in circulating free testosterone levels preceded the clinical diagnosis of AD by nearly 10 years (346). 


Rosario et al. (384) found that low brain levels of testosterone were associated with increased risk of AD in men. In human postmortem brain tissue from neuropathologically normal men, tissue levels of testosterone but not E2 showed an age-related decline (384). The brain tissue levels of testosterone were significantly lower in AD cases as compared with neuropathologically normal cases after controlling for age (384).

Epidemiologic investigations of the association of circulating testosterone levels with age-related changes in cognitive function are in agreement that androgens effects on cognitive function are domain-specific. Generally, men with low testosterone levels perform less well than those with normal testosterone levels on tests of verbal fluency, visuospatial abilities, verbal memory, and executive function (121,122,385-388). Some inconsistency in findings across studies is likely related to heterogeneity of study populations, lack of standardization of cognitive assessments across studies, inaccuracy and imprecision of testosterone immunoassays, and the use of variable thresholds of testosterone levels to define "low". Some studies have suggested a curvilinear relation between testosterone levels and cognitive function; both low and high testosterone levels are associated with worse function suggesting that there may be an optimal level at which cognitive performance is optimized (386).


Clinical Trials Data


No adequately powered randomized placebo-controlled trials of testosterone replacement have been conducted in men with AD (389-392). The clinical trials data on the effects of testosterone on cognition have provided conflicting results; these trials were limited by their small size, inclusion of men who were not clearly hypogonadal and who did not have cognitive impairment or AD neuropathology, and use of outcomes that were not directly related to AD phenotype. Some studies have reported improvements in verbal memory and visuospatial skill while others found no effect (389,391-393).


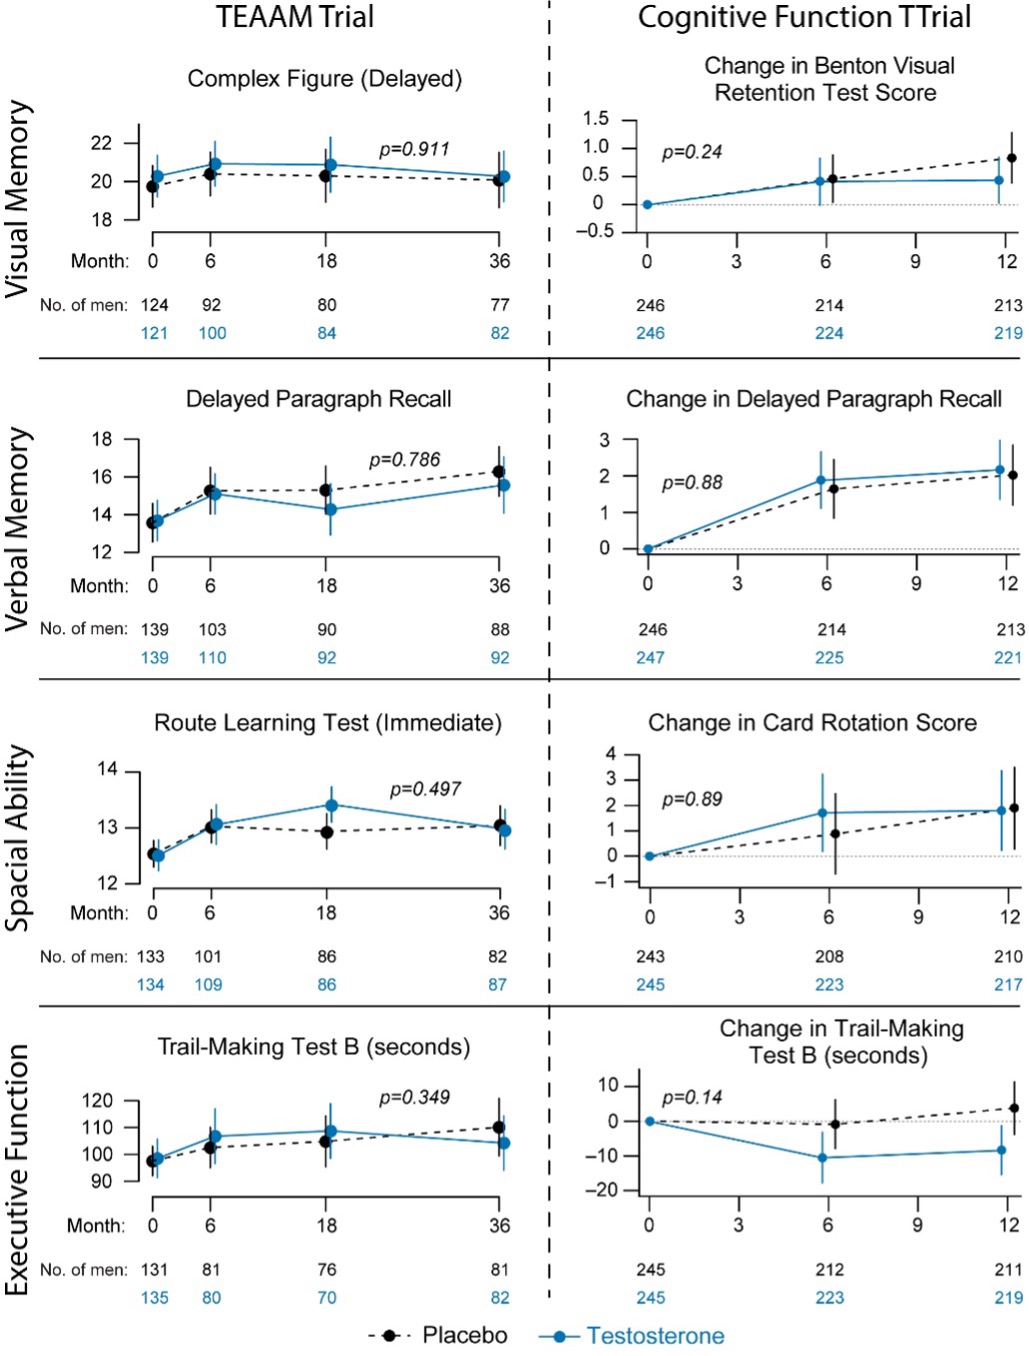
The Testosterone Trials, a set of 7 coordinated trials of community-dwelling older men with unequivocally low testosterone levels, measured using liquid chromatography tandem-mass spectrometry (LC-MS/MS), showed no significant effect on delayed paragraph recall – the primary outcome of the trial (26,390). Post hoc analysis of the TTrials data showed small but significant improvement in executive function (390). The TTrials had many attributes of good trial design - prospective allocation of participants, parallel groups, blinding, and high retention rates, but progression of AD was not a primary aim of the trial (26). The trial’s duration of one year was not long enough to evaluate effects on clinically meaningful measures of cognitive function or AD pathology. The trial did not include any measures of AD pathology, including A beta amyloid or Tau-protein or blood or CSF markers of AD. The participants in this well conducted trial were not selected prospectively based on cognitive deficits or risk of AD. A few small testosterone supplementation studies (sample size varying from 11 to 47) of 6 weeks to 6-month duration in men with cognitive impairment of AD have reported modest improvements in verbal and spatial memory but the small sample sizes, short intervention durations, variable eligibility criteria, and inclusion of men without confirmed AD, and inclusion of men with normal testosterone levels limit the interpretability of these data (391,392).      


In a double-blind randomized placebo-controlled trial, Huang et al investigated the effect of testosterone administration for 3-years on multiple domains of cognitive function in a large cohort (n=280) of men 60 years and older with low or low-normal testosterone levels (394). In this trial of older, cognitively healthy men, testosterone administration was not associated with significant improvement in any domain of cognitive function (Figure 11). These findings are similar to another recent placebo-controlled clinical trial conducted in older men 65-years and older (n=493) with low testosterone levels, which showed that treatment with testosterone for 1-year was not associated with improved cognitive function or memory (Figure 11) (390). Sensitivity analysis that was limited to men with minimal cognitive impairment also did not find significant differences in measures of cognition between the testosterone and placebo groups (390).

Figure 11. Effects of testosterone therapy on cognition domains in older men. Left panels show the long-term effects of testosterone therapy in visual and verbal memory, spacial ability and executive function in the TEAAM trial (36 months of treatment). Data displayed as baseline and post-randomization cognitive function test scores by group and study visit. Error bars are 95% CIs for mean scores and p-values are for the estimated difference between treatment effects, controlling for baseline values, age, and education (figure adapted from Huang et al. J Clin Endocrinol Metab. 2018;103(4):1678-1685.) Right panels show adjusted mean change from baseline to 6 months and 12 months for men with age-associated memory impairment by treatment group in cognition domains in the Cognitive Function Trial of the TTrials (12 months duration; figure adapted from Resnick et al. JAMA. 2017;317(7):717-727).

Synopsis of the Effects of Testosterone on Cognition


In spite of the robust preclinical data that testosterone acts as a negative regulator of endogenous Ab amyloid accumulation in the brain, attenuates tau phosphorylation, reduces neuro-inflammation, exerts neuronal protective effect in response to injury and disease, and promotes neuronal regeneration and connectivity and some epidemiologic evidence that decline in testosterone levels increases the risk of incident clinical AD, the randomized trial data on the effects of testosterone on cognition is highly equivocal. The randomized clinical trials in community dwelling older adults without cognitive deficit or AD neuropathology have not found clinically meaningful improvements in cognitive function. The inconsistency in findings cannot yet be interpreted as conclusive evidence that there is no effect. Limitations of previous studies include limited sample sizes, inclusion of men with no clear cognitive deficit or AD neuropathology, the use of a variety of neuropsychological tests that are not clinically meaningful in the context of AD or dementia; the use of differing protocols in clinical trials. The effects of testosterone therapy on clinically important outcomes in men with cognitive impairment have not been studied. The efficacy of testosterone replacement in men with cognitive impairment, such as in patients with Alzheimer’s disease, needs further investigation in larger randomized controlled trials.


Circulating testosterone concentrations have not been consistently associated with major depressive disorder in men (128,129,395-398). Rather, testosterone levels appear to be associated with a late-life low grade persistent depressive disorder (dysthymia) (128,129,395-398). Intervention trials have failed to demonstrate statistically significant or clinically meaningful improvements in patients with major depressive disorder (399). Placebo-controlled trials of testosterone in men with refractory depression also have not consistently shown a beneficial effect of testosterone (399-402). A meta-analysis of randomized trials reported modest improvements in depressive symptoms in testosterone-treated men compared to placebo-treated  men (403),  but there is no convincing evidence that testosterone treatment can induce remission in men with major depressive  disorder (404). Two small trials in men with dysthymia have reported greater improvements in depressive symptoms in testosterone-treated men than in placebo-treated men (405,406). Adequately powered long-term randomized trials are needed to determine whether testosterone replacement therapy can induce remission in older hypogonadal men with late-onset, low grade persistent depressive disorder (dysthymia).  


There is anecdotal evidence that androgens improve energy and reduced sense of fatigue (407). Testosterone administration increases hemoglobin and red cell mass, stimulates 2, 3 DPG concentrations thereby shifting the oxygen – hemoglobin dissociation curve favorably to improve greater oxygen delivery, and induces muscle capillarity (322,408,409). Additionally, testosterone stimulates mitochondrial biogenesis and mitochondrial quality (410). All of these adaptations would be expected to improve net oxygen delivery to the muscle, improve aerobic performance, and reduce fatigability. The effects of testosterone on fatigue and vitality have been studied in some randomized trials. Endogenous levels of total and free testosterone are not significantly associated with vitality in older hypogonadal men with sexual dysfunction, diminished vitality, and/or mobility limitation (114). In the Vitality Trial of the TTrials, testosterone treatment for 1-year did not improve vitality in older men with low vitality measured using the Functional Assessment of Chronic Illness Therapy (FACIT)-scale but men receiving testosterone did report a small but statistically significant improvement in mood.  These findings are consistent with other randomized controlled studies (23,171,190), showing no clear benefit on fatigue and health-related quality of life with testosterone therapy.


Supraphysiologic doses of androgenic steroids such as those abused by athletes and recreational bodybuilders have been associated with aggressive responses to provocative situations (411), increased scores on Young’s manic scale, and with affective and psychotic disorders in some individuals (412); these adverse effects have not been reported with physiologic testosterone replacement.

By improving some aspects of physical and sexual function, testosterone supplementation might be expected to improve health-related quality of life. However, only a few small trials have evaluated the effects of testosterone on health-related quality of life. A systematic review of a small number of randomized trials has not revealed a significant improvement in composite health-related quality of life scores, but testosterone therapy improves scores on the physical component of MOS SF-36 (16,159). 


Risks of Testosterone Administration in Older Men


Short-term testosterone administration in healthy, young, androgen-deficient men with classical hypogonadism is associated with a low frequency of relatively mild adverse effects such as acne, oiliness of skin, and breast tenderness. However, the long-term risks of testosterone supplementation in older men are largely unknown. There are several unique considerations in older men that may increase their risks of testosterone administration. Serum total and free testosterone concentrations are higher in older men than young men at any dose of testosterone therapy, due to decreased testosterone clearance in older men (61). Older men exhibit greater increments in hemoglobin and hematocrit in response to testosterone administration than young men (321), adjusting for testosterone dose. Altered responsiveness of older men to testosterone administration might make them susceptible to a higher frequency of adverse events, such as erythrocytosis, or to unique adverse events not observed in young hypogonadal men. The baseline prevalence of disorders such as prostate cancer, benign prostatic hypertrophy, and cardiovascular disease that might be exacerbated by testosterone administration is high in older men; therefore, small changes in risk in either direction could have enormous public health impact. Furthermore, the clustering of co-morbid conditions in the frail elderly might render these men more susceptible to the adverse effects of testosterone therapy than healthy young hypogonadal men.


The contraindications for testosterone administration include history of prostate or breast cancer (16). Benign prostatic hypertrophy by itself is not a contraindication, unless it is associated with severe symptoms, as indicated by IPSS symptom score of greater than 21. Testosterone should not be given without prior evaluation and treatment to men with baseline hematocrit greater than 50%, severe untreated sleep apnea, or congestive heart failure with Class III or IV symptoms (16). Testosterone suppresses spermatogenesis and should not be prescribed to men who are considering having a child in the near future.  


The risks of testosterone administration include acne, oiliness of skin, erythrocytosis, induction or exacerbation of sleep apnea, leg edema, transient breast tenderness or enlargement, and reversible suppression of baseline spermatogenesis (16) (Table 2). Abnormalities of liver enzymes, hepatic neoplasms, and peliosis hepatis that have been reported previously with orally administered, 17-alpha alkylated androgens, have not been observed with replacement doses of transdermal or injectable testosterone formulations. The two major areas of concern and uncertainty are the effects of long-term testosterone administration on prostate cancer and major adverse cardiovascular events.


Table 2. Potential Adverse Effects of Testosterone Replacement in Older Men

Adverse Events for Which There is Evidence of Association with Testosterone Administration

1.         Erythrocytosis

2.         Acne and oily skin

3.         Detection of subclinical prostate cancer

4.         Growth of metastatic prostate cancer

5.         Reduced sperm production and fertility

Potential Adverse Events for Which There is Weak Evidence of Association with Testosterone Administration

1.         Gynecomastia

2.         Male pattern balding (familial)

3.         Growth of breast cancer

4.         Induction of worsening of obstructive sleep apnea

Formulation Specific Adverse Effects

1.     1.         Oral Tablets (not recommended)

·                          - Effects on liver enzymes and HDL cholesterol (methyltestosterone)

1.     2.          Pellet Implants

¨                        -. Infection, extrusion of pellet

2.     3.          Intramuscular Injections

¨                         - Fluctuations in mood or libido

¨                         - Pain at injection site

¨                         - Coughing episodes immediately after injection

3.     4.          Transdermal Patches

¨                         - Skin reaction at the patch application site

4.     5.          Transdermal Gel

¨                         - Potential risk of transference to partner

¨                         - Skin irritation and odor at application site

¨                         - Stickiness, slow drying, dripping

5.     6.           Buccal Testosterone Tablets

¨                         - Alterations in taste

¨                         - Irritation of gums

Adapted with permission from the Endocrine Society Guideline for Testosterone Therapy in Men with Hypogonadism in: Bhasin et al J Clin Endocrinol Metab 2018;103(5):1715-1744.


TESTOSTERONE EFFECTS ON THE RISK OF ATHEROSCLEROTIC HEART DISEASE       


The long-term consequences of testosterone supplementation on the risk of heart disease remain unknown and have been the subject of debate (145,413-417). Some known effects of testosterone such as increase in hematocrit, suppression of plasma HDL cholesterol, and salt and water retention, might be expected to increase cardiovascular risk. Some other effects such as testosterone’s vasodilator effect on coronary arteries resulting in increased coronary blood flow, reduction of whole body and abdominal fat mass, and improved brachial reactivity might be perceived as beneficial. Testosterone’s effects on coagulation are complex; testosterone administration is associated with stimulation of both anti-coagulant and pro-coagulant proteins.


Androgen Effects on Plasma Lipids 


Cross-sectional studies of middle-aged men found a positive relationship between serum testosterone levels and plasma HDL-cholesterol concentrations (415,418-421). Lower testosterone levels in men are associated with higher levels of dense LDL particles (418), triglycerides (421,422) and prothrombotic factors (423).


The effects of androgen supplementation on plasma lipids depend on the dose, the route of administration (oral or parenteral), the type of androgen (aromatizable or not), and the subject population (whether young or old, and hypogonadal or not). Supraphysiological doses of testosterone and non-aromatizable androgens frequently employed by bodybuilders undoubtedly decrease plasma HDL-cholesterol levels (424-427). However, administration of replacement doses of testosterone in older men has been associated with only a modest decrease or no change in plasma HDL-cholesterol (16,22,23,25,184,186-189,428-430), and without a significant effect on cholesterol efflux capacity from macrophages (431), suggesting preserved HDL function.


Androgens and Other Cardiovascular Risk Factors 


Cross-sectional studies have found a positive association between circulating testosterone concentrations and tissue plasminogen activator activity (432), and a negative relationship between testosterone and plasminogen activator inhibitor-1 activity, fibrinogen, and some other prothrombotic factors (432), suggesting an antithrombotic effect of testosterone. However, testosterone increases hematocrit (433), as well as neutrophil, monocyte and platelet counts (434). In men, higher neutrophil counts – even within the normal range - are associated with cardiovascular disease (435). Similarly, higher monocyte counts within the normal range have been suggested as a risk-factor for coronary artery plaque formation and cardiovascular mortality (436). Additionally, testosterone administration increases thromboxane A2 receptor density on human platelets, increasing platelet aggregability ex vivo (437,438). Observational studies have not found a consistent relationship between testosterone treatment and the risk of venous thromboembolism (439-443), although one study reported a small increase in VTE risk in the first few months after starting testosterone treatment (439).


Cross-sectional studies have reported conflicting findings on the association of endogenous testosterone levels and inflammatory markers (444-449). Intervention trials of testosterone generally have not found a significant effect of testosterone on inflammatory markers (430,450). Even supraphysiological doses of testosterone have been found not to affect C-reactive protein (451). Similarly, a prospective cohort study did not find meaningful changes in inflammatory markers in men with prostate cancer receiving androgen deprivation therapy (452).


Androgens and Coronary Artery Disease 


Whether variation of testosterone within the normal range is associated with risk of coronary artery disease remains controversial. Of the 30 cross-sectional studies reviewed by Alexandersen (145), 18 reported lower testosterone levels in men with coronary heart disease, 11 found similar testosterone levels in controls and men with coronary artery disease and 1 found higher levels of DHEAS. Prospective studies have failed to reveal an association of total testosterone levels and coronary artery disease (146-150,453-455). The common carotid artery intimal media thickness, a marker of generalized atherosclerosis, is negatively associated with circulating testosterone levels (150).


One interventional study (456), reported that testosterone undecanoate given orally improved angina pectoris in men with coronary heart disease. Testosterone infusion acutely improves coronary blood flow in a canine model and in men with coronary artery disease (457-463). Short-term administration of testosterone induces a beneficial effect on exercise-induced myocardial ischemia in men with coronary artery disease (462). This effect may be related to a direct vasodilator effect of testosterone on the coronary arteries resulting in increased coronary blood flow. Testosterone replacement has been shown to increase the time to 1-mm ST-segment depression (460). However, in another study, there were no differences between the placebo or testosterone groups in peak heart rate, systolic blood pressure, maximal rate pressure product, perfusion imaging scores, or the onset of ST-segment depression (462). Yue et al (463) reported that testosterone induces endothelium-independent relaxation of rabbit coronary arteries via potassium conductance. Testosterone is a potent vasodilator; it induces nitric oxide synthesis in human aortic endothelial cells in vitro (464). Testosterone has been shown to be an inhibitor of L-type Ca2+ channel. In human cells transfected with α1C subunit of the human cardiovascular L-type Ca2+ channel, testosterone inhibits these calcium channels with a potency that is similar to that of dihydropyridine calcium channel blockers (465).


Effects of Testosterone Supplementation on Atherosclerosis Progression


In some animal models, orchiectomy accelerates and testosterone administration retards atherogenesis progression (466). The protective effect of testosterone on aortic atherogenesis in this preclinical model is mediated through its conversion to estradiol by the CYP19A1 in the blood vessel wall (466).


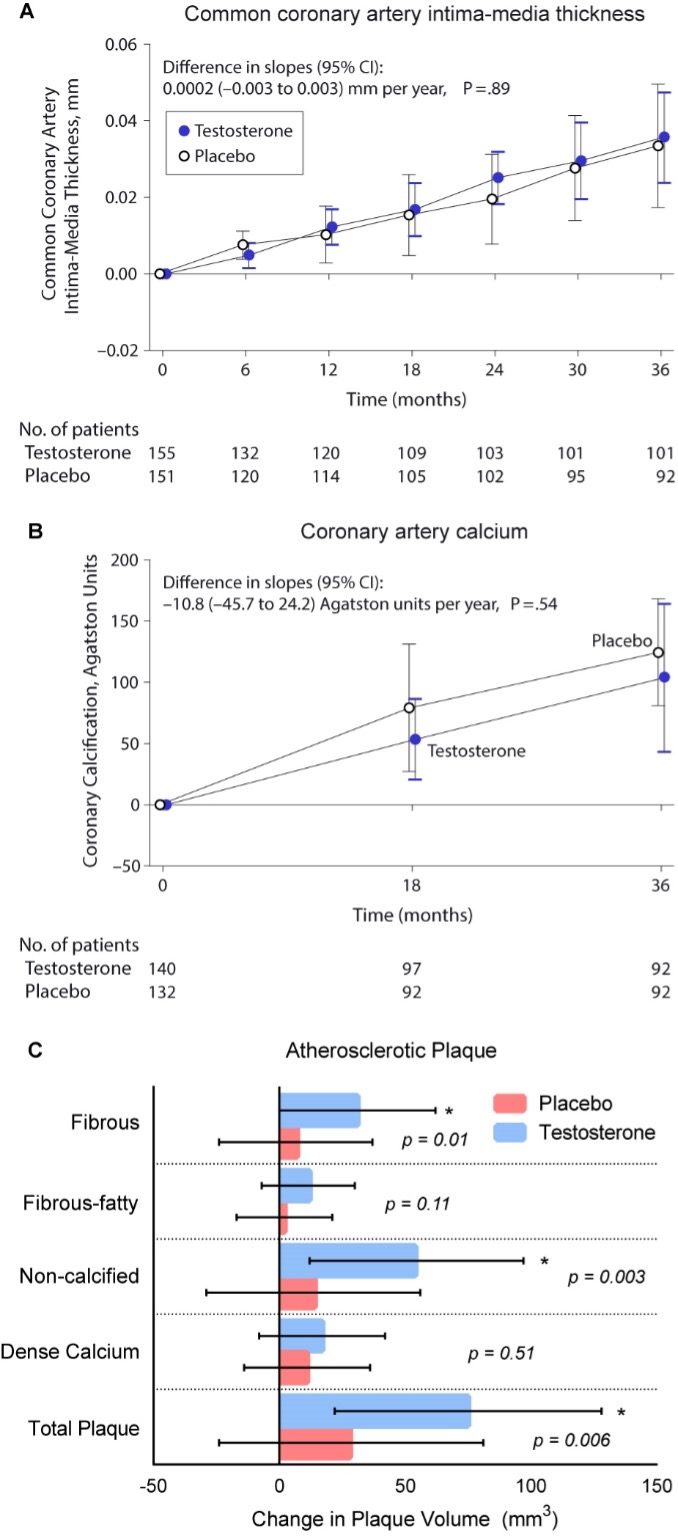
Two large placebo-controlled trials have evaluated the effects of testosterone treatment on atherogenesis progression in middle-aged and older men. The Testosterone’s Effects on Atherosclerosis Progression in Aging Men (TEAAM) Trial determined the effects of testosterone therapy on progression of subclinical atherosclerosis in the common carotid artery using sonographic measurement of common carotid artery intima-media thickness (CCA-IMT) and the coronary artery calcium scores measured using MDCT. The participants in the TEAAM Trial were 308 men, 60 years and older, with total testosterone between 100 and 400 ng/dL or free testosterone below 50 pg/mL (23). Men were randomized to receive either 75 mg of transdermal testosterone gel or placebo gel daily and received for 3 years. Neither the progression of CCA-IMT nor coronary artery calcium scores differed between the men randomized to the testosterone and placebo groups (Figure 12) (23).

Figure 12. Effects of testosterone administration on atherosclerosis progression. Panels A and B show data from the TEAAM trial (Basaria et al. JAMA. 2015;314(6):570-81; figure reproduced with permission from JAMA) Panel C shows data from the Cardiovascular Trial of the TTrials (data from Budoff et al. JAMA. 2017;317(7):708-716; figure adapted from Gagliano-Jucá & Basaria, Asian J Androl. 2018;20(2):131-137).

In the cardiovascular trial of the TTrials, 138 men with serum total testosterone below 275 ng/dL received either testosterone gel or placebo gel for one year and were evaluated by coronary computed tomographic angiography for progression of non-calcified and calcified coronary artery plaque volume, as well as coronary artery calcium score (467). Consistent with the findings of the TEAAM Trial, the changes in coronary artery calcium scores did not differ between the testosterone and placebo groups over one year of intervention. However, the increase in non-calcified plaque volume (primary endpoint) was significantly greater in men assigned to the testosterone arm than in those assigned to placebo arm (Figure 12) (467); there were baseline differences in non-calcified plaque volume between the two groups. The clinical implications of these findings to cardiovascular risk remain to be established.


Testosterone and Cardiac Arrhythmias


Testosterone has important effects in cardiac electrophysiology (468); it increases potassium currents derived from the human ether-a-go-go related gene (hERG) (469), and inhibits the depolarizing delayed calcium current (ICaL) (470), with its effects on ICaL being more meaningful than on hERG (471). These effects lead to shortening of ventricular cardiomyocyte repolarization time, which can be seen in the electrocardiogram as shortening of the heart-rate corrected QT interval (QTc). Indeed, cross-sectional studies have observed a negative association between serum testosterone levels and QTc duration (472). Additionally, in randomized trials of testosterone replacement to men with low testosterone levels, testosterone treatment shortened QTc duration in community-dwelling older men (473) and in men with chronic heart failure (474). Similarly, in a prospective cohort study, androgen deprivation therapy in men with prostate cancer was associated with QTc prolongation compared with men with prostate cancer not receiving the therapy (475). As QTc prolongation is associated with an increased risk of ventricular tachyarrhythmias (torsades de pointes) and sudden cardiac death (476-478), it is not surprising that androgen deprivation therapy is associated with a higher risk of arrhythmia, cardiac conduction disturbances and sudden death (479,480). A small case series study and analysis of the European pharmacovigilance database concluded that “conditions or drugs leading to male hypogonadism were associated with torsades de pointes”, and “correction of hypogonadism with testosterone replacement therapy can treat or prevent torsades de pointes” (481).


Cross-sectional studies have also linked low androgen levels in men to an increased risk of atrial fibrillation (482-484), and normalization of testosterone levels with testosterone replacement is associated with a decreased incidence of atrial fibrillation compared with untreated hypogonadal men (485). These findings need corroboration in randomized trials.


The Effects of Testosterone on Major Adverse Cardiovascular Events (MACE)


To-date, no randomized trials have been large enough or of sufficiently long duration to determine the effects of testosterone treatment on MACE (416). The frequency of MACE reported in randomized testosterone trials has been low—even lower than that expected for the age and comorbid conditions of the participants (18,486,487). A randomized trial of testosterone in older men (The TOM Trial) with mobility limitation was stopped early due to a higher frequency of cardiovascular-related events in men assigned to testosterone than in those assigned to placebo (22), heightening concern about the cardiovascular safety of testosterone in frail older men. In contrast to many other testosterone trials in older men, which recruited relatively healthy older men, the participants in the TOM trial had a high prevalence of chronic conditions, such as heart disease, diabetes mellitus, obesity, hypertension, and hyperlipidaemia (22). Men, 75 years of age or older, and men with high on-treatment testosterone levels seemed to be at the greatest risk of cardiovascular-related events. In secondary analyses, these events were found to be associated with changes in serum free testosterone and estradiol levels (488). The dose of testosterone used in the TOM trial was higher than that used in some previous trials, but not dissimilar from or lower than that used in some other trials. The cardiovascular events were small in number and of variable clinical significance. The TOM trial was not designed for cardiovascular events; therefore, the cardiovascular events were not a pre-specified endpoint, and were not collected in a standardized manner, nor adjudicated prospectively. Additionally, many of the cardiovascular events were not MACE.


The higher cardiovascular adverse event incidence in testosterone-treated older men observed in the TOM trial was not reproduced in two larger trials of longer duration published more recently; in the TEAAM trial, the incidence of major adverse cardiac events throughout the 3 years of intervention was similar between groups (23). Similarly, in the TTrials, the number of MACE (myocardial infarction, stroke or death related to cardiovascular disease) during the one year of treatment was similar in the two groups, with seven men in each group experiencing an event (26). The number of MACE in the TEAAM and Ttrials were too few to permit strong inferences on the effects of testosterone treatment on MACE.


The Hormonal Regulators of Muscle and Metabolism in Aging (HORMA) trial reported a significantly greater increase in blood pressure in men treated with testosterone than in those treated with placebo (489). Testosterone administration causes salt and water retention (490), which can induce edema and worsen pre-existing heart failure.


Several meta-analyses of randomized testosterone trials have been published (413,486,487,491,492); however, these meta-analyses are limited by the small size of most trials, heterogeneity of study populations, poor quality of adverse-event reporting, and short treatment duration in many trials. None of the testosterone trials to date was sufficiently powered to adequately assess safety outcomes. The rigor of adverse-event reporting varied greatly among studies. The MACE was not ascertained rigorously nor adjudicated in most trials except in the TTrials.


The meta-analyses of randomized testosterone trials (487,491-494) and retrospective analyses of electronic medical records data (495-498) have also yielded inconsistent findings. These meta-analyses and pharmacovigilance studies have suffered from many limitations that are inherent in retrospective analysis of electronic medical records data. These studies included heterogeneous populations, and differed in the duration of intervention and study design. They used variable definitions and ascertainment of cardiovascular outcomes. The cardiovascular events were not prespecified, not collected prospectively and were not adjudicated. Treatment indications, treatment regimens, on-treatment testosterone levels and exposure differed among studies. These studies also suffered from a potential for residual confounding in that the patients assigned to testosterone therapy differed from comparators in baseline cardiovascular risk factors. Because of these inherent limitations and inconsistency of findings, these epidemiologic studies do not permit strong inferences about the relation between testosterone therapy and mortality and cardiovascular outcomes.


Synopsis of the Effects of Testosterone on Cardiovascular Risk 


The long-term effects of testosterone replacement therapy on MACE remain unknown. The FDA conducted an extensive review and concluded “the studies...have significant limitations that weaken their evidentiary value for confirming a causal relationship between testosterone and adverse cardiovascular outcomes”. Nevertheless, the FDA directed the pharmaceutical companies to add in the drug label information about a possible increased risk of cardiovascular events with testosterone use. An independent review conducted by the European Medicines Agency also found no consistent evidence of an increased risk of coronary heart disease associated with testosterone treatment of hypogonadal men. Long-term randomized trials of the effects of testosterone replacement on MACE are needed and are particularly important because even small changes in incidence rates could have significant public health impact.


A large randomized, placebo-controlled trial to study the effects of testosterone replacement therapy on the incidence of major adverse cardiovascular events in men 45 to 80 years of age with low testosterone levels and one or more symptoms of testosterone deficiency, who are at increased risk for cardiovascular events is currently underway (The TRAVERSE Trial, NCT03518034). The intervention duration is up to 5 years in this trial of over 6,000 men. The efficacy outcomes include adjudicated clinical fractures, remission of low-grade persistent depressive disorder (dysthymia), progression from pre-diabetes to diabetes, correction of anemia, and overall sexual activity, sexual desire, and erectile function. This randomized, placebo-controlled trial offers an historical opportunity to advance our understanding of the cardiovascular safety and long-term efficacy of testosterone replacement in middle-aged and older hypogonadal men.


TESTOSTERONE, DIA

Figure 13. Circulating Concentrations of SHBG, but not total or free testosterone, were associated prospectively with risk of incident diabetes in the Massachusetts Male Aging Study (MMAS). In a prospective analysis of data from the Massachusetts male Aging Study, total testosterone (left panel) and free testosterone (middle panel) were not associated significantly with risk of incident diabetes. Only SHBG concentrations were associated with incident diabetes in longitudinal analysis. Reproduced with permission from Lakshman et al J Gerontol A Biol Sci Med Sci. 2010;65(5):503-9.


BETES, AND METABOLIC SYNDROME      


Spontaneous (156) and experimentally induced (222) androgen deficiency is associated with increased fat mass, and testosterone replacement decreased fat mass in older men with low testosterone levels (16). In epidemiologic studies, low testosterone levels are associated with higher levels of abdominal adiposity (499,500). Testosterone administration promotes the mobilization of triglycerides from the abdominal adipose tissue in middle-aged men (501). Surgical castration in rats impairs insulin sensitivity; physiologic testosterone replacement reverses this metabolic derangement (502). However, high doses of testosterone impair insulin sensitivity in castrated rats (502), suggesting a biphasic relationship in which both low and high testosterone levels impair insulin resistance. Androgens increase insulin-independent glucose uptake (503) and modulate LPL activity in a region-specific manner (504).


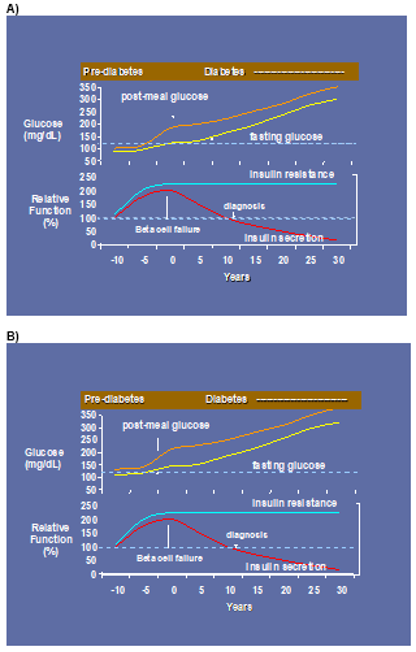
Testosterone levels are lower in men with type 2 diabetes mellitus compared with controls (505-510). Low total testosterone levels have been associated with lower insulin sensitivity (505,511) and increased risk of type 2 diabetes mellitus and metabolic syndrome in community dwelling men both cross-sectionally and longitudinally (508-510,512-520). However, the association of free testosterone and type 2 diabetes mellitus has been inconsistent; some studies have reported a weak relationship (509,510,512) while others have failed to find any relationship (508,514). Circulating sex hormone binding globulin (SHBG) and some SHBG polymorphisms also have been associated negatively with the risk of type 2 diabetes (508-510,512-516,521-524). For instance, individuals with the rs6257and rs179994 variant alleles of the SHBG single nucleotide polymorphism (SNP) have lower plasma SHBG levels and a higher risk of type 2 diabetes (521-524). Similarly, individuals with the rs6259 variant have higher SHBG levels and lower type 2 diabetes risk (524). We performed longitudinal analyses of men participating in the Massachusetts Male Aging Study (525), a population-based study of men aged 40-70 years (Figure 13) to evaluate whether SHBG is an independent predictor of T2DM (526). After adjustment for age, body mass index, hypertension, smoking, alcohol intake and physical activity, the hazard ratio  for incident type 2 diabetes was 2.0 for each one SD decrease in SHBG and 1.29 for each one SD decrease in total testosterone (525). Free testosterone was not significantly associated with type 2 diabetes. The strong association of T2DM risk with SHBG persisted even after additional adjustment for free testosterone. The association of SHBG polymorphisms with type 2 diabetes suggests a potential role of SHBG in the pathogenesis of type 2 diabetes. In a Mendelian randomization analysis of the UK Biobank data, genetically determined free testosterone levels were associated with the risk of type 2 diabetes mellitus in a sexually dimorphic manner after adjusting for SHBG levels; men with low genetically determined free testosterone levels had increased risk of type 2 diabetes while women with low genetically determined free testosterone levels had reduced risk of type 2 diabetes (527).

Figure 13. Circulating Concentrations of SHBG, but not total or free testosterone, were associated prospectively with risk of incident diabetes in the Massachusetts Male Aging Study (MMAS). In a prospective analysis of data from the Massachusetts male Aging Study, total testosterone (left panel) and free testosterone (middle panel) were not associated significantly with risk of incident diabetes. Only SHBG concentrations were associated with incident diabetes in longitudinal analysis. Reproduced with permission from Lakshman et al J Gerontol A Biol Sci Med Sci. 2010;65(5):503-9.

HbA1c levels did not differ between groups. Homeostasis model assessment of insulin resistance (HOMA-IR), a marker of insulin resistance, improved modestly in men who were assigned to testosterone compared with placebo (532). Dhindsa et al reported improvement of insulin sensitivity with testosterone replacement for 24 weeks in hypogonadotropic hypogonadal men with type 2 diabetes (511). Overall, studies have failed to show improvements in diabetes outcomes or consistent changes in measures of insulin sensitivity (18,430,451,532-536) even though interventional trials have found a consistent reduction in whole body fat as well as abdominal fat (18,123,343). Indeed, in the TEAAM trial, 3 years of testosterone supplementation decreased fat mass in community-dwelling older men with low or low-normal serum testosterone concentrations, but did not improve insulin sensitivity (Figure 14) (537). The T4DM trial, one of the largest testosterone trials conducted to-date, evaluated the effects of 2 years of testosterone treatment in men aged 50 to 74 years with impaired glucose tolerance or newly diagnosed type 2 diabetes and a serum testosterone concentration below 404 ng/dL enrolled in a lifestyle program. Compared to placebo, testosterone treatment in conjunction with a life style program was associated with a lower proportion of participants with type 2 diabetes (538). It is important to note, however, that the men enrolled in the T4DM trial were not hypogonadal.

Figure 14. Long-term effects of testosterone therapy on insulin sensitivity in older men. Change in insulin sensitivity over time measured by the octreotide insulin suppression test and estimated as the mean concentration of glucose at equilibrium (SSPG). Figure adapted from Huang et al. J Clin Endocrinol Metab. 2018;103(4):1678-1685.

TESTOSTERONE AND PROSTATE RISK      


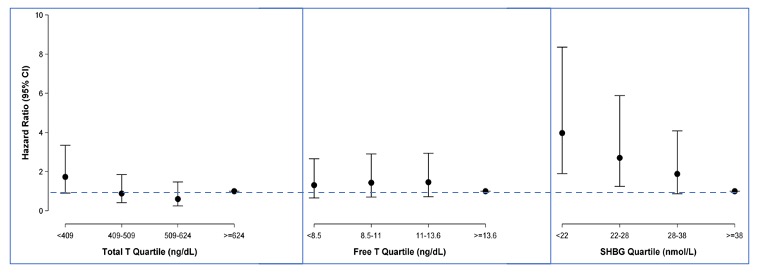
There is no evidence that testosterone causes prostate cancer (539). A retrospective analysis of the Registry of Hypogonadism in Men (RHYME) (540) and several meta-analyses of randomized controlled trials (486,541,542) did not find an increased risk of prostate cancer in men receiving testosterone. Also, there is no consistent relationship between endogenous serum testosterone levels and the risk of prostate cancer (16,18,123,343,542-545). A meta-analyses of prospective cohort studies did not find a significant association between endogenous total testosterone levels and prostate cancer (542). Conversely, an analysis of 20 prospective studies found that men in the lowest tenth of free testosterone concentration had a lower risk of prostate cancer (OR=0.77, 95%CI= 0.69 to 0.86; p<0.001) compared with men with higher concentrations (545). Similarly, in the male participants in the UK Biobank followed for a mean of 6.9 years, higher genetically determined free testosterone was associated with a higher risk of prostate cancer, while total testosterone was not associated with prostate cancer risk (Figure 15) (546). The men with Klinefelter Syndrome have lower risk of prostate cancer than the general population. Taken together, these data suggest that life-long exposure to testosterone treatment in hypogonadal men could potentially increase the risk of prostate cancer.

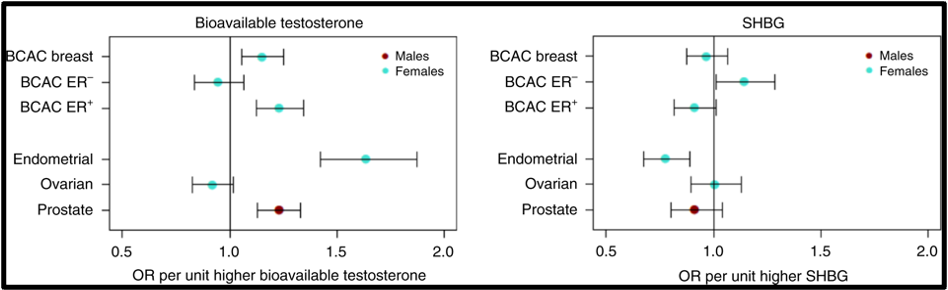
Figure15. Mendelian Randomization: Genetically Determined Bio-Testosterone Associated with Increased Prostate Cancer Risk. Legend: UK Biobank Study: Genetic determinants of bioavailable testosterone were positively associated with risk of prostate cancer in men and ER+ breast cancer and endometrial cancer in women. Reproduced with permission from: Ruth KS, et al. Nat Med. 2020;26(2):252‐258.

Prostate cancer is an androgen–dependent tumor, and testosterone treatment is known to promote the growth of metastatic prostate cancer (544,547). Testosterone administration has been historically contraindicated in men with history of prostate cancer (16,543). The prevalence of subclinical, microscopic foci of prostate cancer in older men is high (548-555). There is concern that testosterone administration might make these subclinical foci of cancer grow and become clinically overt. In addition, older men with low testosterone levels may have prostate cancer (556,557). Morgentaler et al (556,557) reported a high prevalence of biopsy-detectable prostate cancer in men with low total or free testosterone levels despite normal PSA levels and normal digital rectal examinations. However, this study did not have a control group, and we do not know whether sextant biopsies of age-matched controls with normal testosterone levels would yield a similarly high incidence of biopsy-detectable cancer. Therefore, this study should not be interpreted to conclude that there is a higher prevalence of prostate cancer in older men with low testosterone levels, or that low testosterone levels are an indication for performing prostate biopsy.


Effects of Testosterone Therapy on Prostate Events


None of the testosterone trials in middle-aged or older men had sufficient power or intervention duration to detect meaningful differences in the incidence of prostate cancer between testosterone and placebo-treated men. Testosterone treatment of hypogonadal men increases PSA levels (16,558), which may lead to urological referral for prostate biopsy. A systematic review of randomized testosterone trials in middle-aged and older men found (413) that men treated with testosterone in clinical trials were at significantly higher risk for undergoing prostate biopsy than placebo-treated men (413). Because of the high prevalence of subclinical prostate cancer in older men, the higher number of prostate biopsies in testosterone-treated men could lead to increased detection rates of subclinical prostate cancer in comparison with placebo-treated men. Thus, testosterone therapy of middle-aged and older men is associated with a higher risk of prostate biopsy and a bias towards detection of a higher number of prostate events (18,413).


Administration of exogenous testosterone or suppression of circulating levels of testosterone by administration of a GnRH antagonist is not associated with proportionate changes in intra-prostatic testosterone or DHT concentrations. For instance, in a randomized controlled trial, Marks et al (559) measured intraprostatic testosterone and DHT levels in older men treated with placebo or testosterone. Surprisingly, intraprostatic DHT concentrations were not significantly higher in testosterone-treated men than in placebo-treated men (559). Similarly, the expression levels of androgen-dependent genes in the prostate were not significantly altered by testosterone administration (559). In separate studies, lowering of circulating testosterone levels by administration of a GnRH antagonist was not associated with changes in intraprostatic androgen concentrations (560,561).  


Effects of Testosterone Replacement on Serum PSA Levels


Serum PSA levels are lower in androgen–deficient men and are restored to normal following testosterone replacement (16,558,562-570). Lowering of serum testosterone concentrations by withdrawal of androgen therapy in young, hypogonadal men is associated with a decrease in serum PSA levels. Similarly, treatment of men with benign prostatic hyperplasia with a 5-alpha reductase inhibitor, finasteride, is associated with a significant lowering of serum and prostatic PSA levels (570,571). However, serum PSA levels do not increase progressively in healthy hypogonadal men with replacement doses of testosterone. The increase in PSA levels during testosterone replacement might trigger evaluation and biopsy in some patients (16,543).


More intensive PSA screening and follow-up of men receiving testosterone replacement might lead to an increased number of prostate biopsies and the detection of subclinical prostate cancers that would have otherwise remained undetected (16,543). Serum PSA levels tend to fluctuate when measured repeatedly in the same individual over time (572-574). There is considerable test-retest variability in PSA measurements (572-574). Some of this variability is due to the inherent assay variability, and a significant portion of this variability is due to unknown factors. Fluctuations are larger in men with high mean PSA levels. Variability can be even greater if measurements are performed in different laboratories that use dissimilar assay methodology (572-574).


An important issue is what increment in PSA level should warrant a prostate biopsy in older men receiving testosterone replacement. To address this issue, we conducted a systematic review of published studies of testosterone replacement in hypogonadal men (543). This review indicated that the weighted effect size of the change in PSA after testosterone replacement in young, hypogonadal men is 0.68 standard deviation units (95% confidence interval 0.55 to 0.82). This means that the effect of testosterone replacement therapy is to increase PSA levels by an average 0.68 standard deviations over baseline. Because the average standard deviation was 0.47 in this systematic analysis, the standard deviation score of 0.68 translates into an average increase in serum PSA levels of about 0.30 ng/ml in young hypogonadal men (543). The average change in serum PSA levels after testosterone replacement in studies of older men was 0.43 ng/mL (543). The data from the Proscar Long-Term Efficacy and Safety Study (PLESS) demonstrated that the 90% confidence interval for the change in PSA values measured 3 to 6 months apart is 1.4 ng/mL (570). Therefore, a change in PSA of >1.4 ng/ml between any two values measured 3 to 6 month apart in the same patient is unusual (16,543).  In the TTrials, 2.4% of men receiving testosterone had increases above 1.4 ng/mL at 3 months, and 4.7% at 12 months (26).


Carter et al, based on the analysis of PSA data from the Baltimore Longitudinal Study of Aging, reported that PSA velocity, defined as the annual rate of change of PSA, is different in men who develop prostate cancer than in those who do not (575-577). Thus, PSA velocity greater than 0.7 ng/ml/year was unusual in men without prostate cancer whose baseline PSA was between 4 and 10 ng/ml (575-577). However, most men being considered for testosterone replacement will have baseline PSA less than 4 ng/ml. In a subsequent analysis, the same group reported that the PSA velocity in men with baseline PSA between 2 and 4 ng/ml was 0.2 ng/ml/year (577). Because test-to-retest variability in PSA measurement is far greater than this threshold, it is likely that the use of this threshold of 0.2 ng/ml/year to select men for prostate biopsy would lead to many unnecessary biopsies.


In eugonadal, young men, administration of supraphysiological doses of testosterone does not further increase serum PSA levels (166,169,578). These data are consistent with dose response studies in young men that demonstrate that maximal serum concentrations of PSA are achieved at testosterone levels that are at the lower end of the normal male range; higher testosterone concentrations are not associated with higher PSA levels (166,169).


In summary, these data suggest that the administration of replacement doses of testosterone to androgen-deficient men can be expected to produce a modest increment in serum PSA levels. Increments in PSA levels after testosterone supplementation in androgen-deficient men are generally less than 0.5 ng/mL and increments in excess of 1.4 ng/mL over a 3–6-month period are unusual. Nevertheless, administration of testosterone to men with baseline PSA levels between 2.6 and 4.0 ng/mL will cause PSA levels to exceed 4.0 ng/mL in some men. Increments in PSA levels above 4 ng/mL will trigger a urological consultation and many of these men will be asked to undergo prostate biopsies. However, considering the controversy over prostate cancer screening and monitoring, the decision to monitor PSA levels during testosterone treatment and the decision to refer a patient for consideration of prostate biopsy should be made only after informing him of the risks and benefits of prostate cancer screening and monitoring and engaging the patient in a shared decision-making process.


Monitoring PSA Levels in Older Men Receiving Testosterone Replacement (Tables 3 and 4)


Older men considering testosterone supplementation should undergo evaluation of risk factors for prostate cancer; the Endocrine Society guideline suggest a baseline PSA measurement and a digital prostate examination (16). Prostate cancer screening has some risks; therefore, initiation of prostate monitoring should be a shared decision, made only after a discussion of the risks and benefits of prostate cancer monitoring. Men with history of prostate cancer, should not be given androgen supplementation and those with palpable abnormalities of the prostate or PSA levels greater than 3 ng/ml should undergo urological evaluation. After initiation of testosterone replacement therapy, PSA levels should be repeated at 3 months and annually thereafter (16). Although measurements of free PSA and PSA density have been proposed to enhance the specificity of PSA measurement, long term data, especially from studies of testosterone replacement in older men, are lacking. Considering the interassay variability and the longitudinal change in PSA previously discussed, an Endocrine Society Expert Panel recently suggested that men receiving testosterone replacement should be referred to urological consultation if: 1) PSA increases more than 1.4 ng/mL in the first 12 months of treatment; 2) a PSA above 4 ng/mL is confirmed; or 3) a prostatic abnormality is detected on digital rectal examination (16). After 12 months of treatment, prostate monitoring should follow standard guidelines for prostate cancer screening taking into account the age and race of the patient (16).


Table 3. Recommendations for Monitoring of Men Receiving Testosterone Therapy

A. Explain the potential benefits and risks of monitoring for prostate cancer and engage the patient in shared decision making regarding the prostate monitoring plan.

B. Evaluate the patient at 3–12 months after treatment initiation and then annually to assess whether symptoms have responded to treatment and whether the patient is suffering from any adverse effects

C. Monitor testosterone concentrations 3–6 months after initiation of therapy:

·       --Therapy should aim to raise testosterone into the mid-normal range.

·       --Injectable testosterone enanthate or cypionate: measure testosterone midway between injections. If midinterval T is >600 ng/dL (24.5 nmol/L) or <350 ng/dL (14.1 nmol/L), adjust dose or frequency.

·       --Transdermal gels: assess testosterone 2–8 h following the gel application, after the patient has been on treatment for at least 1 week; adjust dose to achieve testosterone in the mid-normal range.

·       --Transdermal patches: assess testosterone 3–12 h after application; adjust dose to achieve concentration in the mid-normal range.

·       --Buccal T bioadhesive tablet: assess concentrations immediately before or after application of fresh system.

·       --Testosterone pellets: measure concentrations at the end of the dosing interval. Adjust the number of pellets and/or the dosing interval to maintain serum T concentrations in the mid-normal range.

·       --Oral T undecanoate: monitor serum T concentrations 3–5h after ingestion with a fat-containing meal.

·       --Injectable testosterone undecanoate: measure serum T levels at the end of the dosing interval just prior to the next injection and aim to achieve nadir levels in low-mid range.

D. Check hematocrit at baseline, 3–6 months after starting treatment, and then annually. If hematocrit is >54%, stop therapy until hematocrit decreases to a safe level; evaluate the patient for hypoxia and sleep apnea; reinitiate therapy with a reduced dose.

E. Measure BMD of lumbar spine and/or femoral neck after 1–2 year of testosterone therapy in hypogonadal men with osteoporosis, consistent with regional standard of care.

F. For men 55–69 years of age and for men 40–69 years of age who are at increased risk for prostate cancer who choose prostate monitoring, perform digital rectal examination and check PSA level before initiating treatment; check PSA and perform digital rectal examination 3–12 months after initiating testosterone treatment, and then in accordance with guidelines for prostate cancer screening depending on the age and race of the patient.

G. Obtain urological consultation if there is:

·       An increase in serum PSA concentration.1.4 ng/mL within 12 months of initiating testosterone treatment

·       A confirmed PSA > 4 ng/mL at any time

·       Detection of a prostatic abnormality on digital rectal examination

·       Substantial worsening of lower urinary tract symptoms

Adapted with permission from the Endocrine Society Guideline for Testosterone Therapy in Men with Hypogonadism in: Bhasin et al J Clin Endocrinol Metab 2018;103(5):1715-1744.


Table 4. Indications for Urological Consultation in Men Receiving Testosterone Replacement

1.     1) An increase in serum or plasma PSA concentration >1.4 ng/mL within any 12-month period after initiating testosterone treatment

2.     2) A PSA >4.0 ng/mL

3.     3) Detection of a prostatic abnormality on digital rectal examination

4.     4) An AUA/IPSS prostate symptom score of >19

Adapted with permission from the Endocrine Society Guideline for Testosterone Therapy in Men with Hypogonadism in: Bhasin et al J Clin Endocrinol Metab 2018;103(5):1715-1744.


Testosterone and Benign Prostatic Hypertrophy  


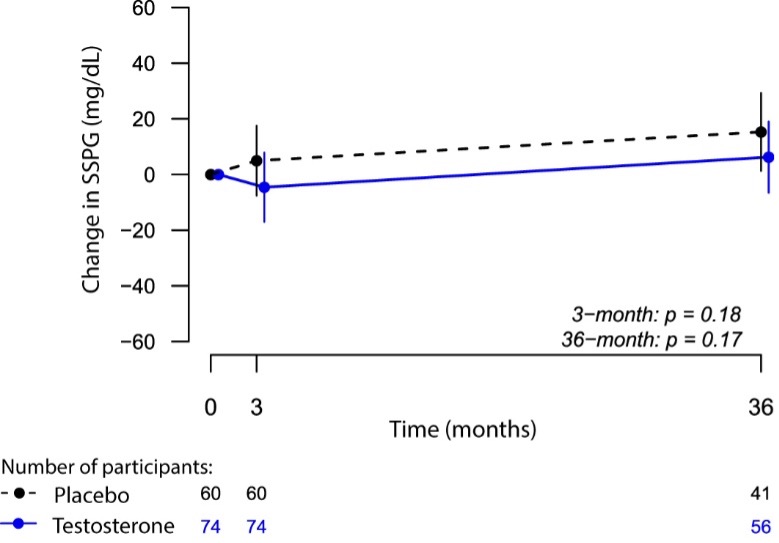
Testosterone replacement can be administered safely to men with benign prostatic hypertrophy who have mild to moderate symptom scores. The severity of symptoms associated with benign prostatic hypertrophy can be assessed by using either the International Prostate Symptom Score (IPSS) or the American Urological Association (AUA) Symptom questionnaires. Androgen deficiency is associated with decreased prostate volume and androgen replacement increases prostate volume compared to  age–matched controls (559,562,566,567). Meta-analyses of testosterone trials have not found statistically significant difference in lower urinary tract symptoms scores in hypogonadal men receiving testosterone replacement compared to placebo (Figure 16) (256,579). However, in patients with pre–existing, severe symptoms of benign prostatic hypertrophy, even small increases in prostate volume during testosterone administration may exacerbate obstructive symptoms. In these men, testosterone should either not be administered or administered with careful monitoring of obstructive symptoms.

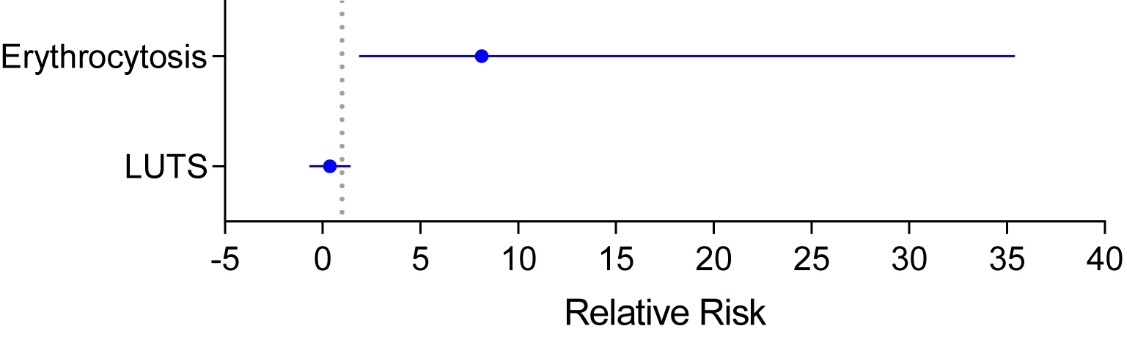
Figure 16. Adverse events associated with testosterone therapy in randomized trials. The relative risk and 95% CI for development of erythrocytosis (RR= 8.14; 95%CI= 1.87 to 35.40) and lower urinary tract symptoms (LUTS; RR= 0.38; 95%CI= -0.67 to 1.43) in randomized testosterone trials derived from meta-analyses published by Ponce et al., 2018 are shown. The figure was adapted with permission from Ponce et al. J Clin Endocrinol Metab. 2018;103(5):1745-54.

ERYTHROCYTOSIS


Testosterone replacement is associated with increased red cell mass and hemoglobin levels (Figure 16) (256,329,580-585). Therefore, testosterone replacement should not be administered to men with baseline hematocrit of 52% or greater without appropriate evaluation and treatment of erythrocytosis (16) (Table 3). Administration of testosterone to androgen–deficient young men is typically associated with a small increase in hemoglobin levels. Clinically significant erythrocytosis is uncommon in young hypogonadal men during testosterone replacement therapy, but can occur in men with sleep apnea, significant smoking history, or chronic obstructive lung disease. Testosterone administration in older men is associated with greater increments in hemoglobin than observed in young, hypogonadal men (321). The magnitude of hemoglobin increase during testosterone therapy appears related to the testosterone dose, the increase in testosterone concentrations during testosterone therapy, and age (321). Testosterone replacement by means of a transdermal system has been reported to produce a lesser increase in hemoglobin levels than that associated with intramuscular testosterone enanthate and cypionate presumably because of the substantially higher testosterone dose and average circulating testosterone levels achieved with testosterone esters (586).


Testosterone increases hemoglobin and hematocrit by multiple mechanisms (322,408,409,587). Testosterone administration stimulates iron-dependent erythropoiesis by suppressing hepcidin transcription and increasing iron availability for erythropoiesis (322,408,409,587). Additionally, testosterone stimulates erythropoiesis by a direct effect on bone marrow hematopoietic progenitors and increasing the numbers of myeloid progenitors. Testosterone also stimulates erythropoietin and alters the set-point of the relationship between erythropoietin and hemoglobin (322). Testosterone supplementation can correct anemia in older men with unexplained anemia of aging and anemia of inflammation (322,329,409). Suppression of testosterone secretion in men receiving androgen deprivation therapy reduces hematocrit and hemoglobin levels by slowing erythropoiesis independently of changes in erythropoietin levels (588).     


Monitoring Hematocrit During Testosterone Replacement Therapy (Table 3)


Hematocrit levels should be measured at baseline and 3 months after institution of testosterone replacement or after increase in dosage, and every 12 months thereafter. It is not clear what absolute hematocrit level or magnitude of change in hematocrit warrants discontinuation of testosterone administration. Plasma viscosity increases disproportionately as hematocrit rises above 50%. Hematocrit levels above 54% may be associated with increased risk of neuro-occlusive events. Therefore, testosterone dose should be withheld if hematocrit rises above 54%; once hematocrit falls to a safe level, testosterone therapy may be re-initiated at a reduced dose or with a different formulation (16).  


SLEEP APNEA   


Circulating testosterone concentrations are related to sleep rhythm and are generally higher during sleep than during waking hours (589-592). Testosterone secretory peaks coincide with the onset of rapid-eye movement sleep. Aging is associated with decreased sleep efficiency, reduced numbers of REM sleep episodes, and altered REM sleep latency, which may contribute to lower circulating testosterone concentrations (590-594).  The degree of sleep-disordered breathing increases with age and is associated with reduced overnight plasma bioavailable testosterone. Thus, changes in sleep efficiency and architecture are associated with alterations in testosterone levels in older men (590-594). Sleep apnea and disordered sleep are often associated with low testosterone levels (595), particularly in patients with more severe cases of OSA (i.e. severe hypoxemia) (596). Some potential mechanisms by which OSA may decrease endogenous testosterone levels include disruption of pulsatile luteinizing hormone secretion from restricted sleep and/or recurrent nocturnal hypoxia (597,598), which is further exacerbated by obesity. OSA treatment with continuous positive airway pressure has been demonstrated to increase serum testosterone levels (599).


Testosterone can induce or exacerbate sleep apnea in some individuals, particularly those with obesity or chronic obstructive lung disease (589-594,600). This appears to be due to direct effects of testosterone on laryngeal muscles. Testosterone administration depresses hypercapnic ventilator drive and induces apnea in primate infants (594). Short-term administration of high doses of testosterone shortens sleep duration and worsens sleep apnea in older men (601). The frequency of sleep apnea in randomized testosterone trials in older men has been very low (16,486) and no randomized trial has reported an increased incidence of OSA or OSA worsening in men randomized to the testosterone arm compared to the placebo arm. 


Testosterone should not be given to men with severe untreated OSA without evaluation and treatment of sleep apnea. Several screening instruments can be used to detect sleep apnea. A history of loud snoring, and daytime somnolence, in an obese individual with hypertension increases the likelihood of having sleep apnea; such patients should be referred for a sleep study.


BREAST ENLARGEMENT AND TENDERNESS


Testosterone administration can induce breast tenderness; however, gynecomastia is an uncommon complication of testosterone replacement therapy. Even with administration of supraphysiological doses of testosterone enanthate, less than 4% of men in a contraceptive trial developed detectable breast enlargement (580). Breast cancer is listed as a contraindication for testosterone replacement therapy primarily because of concern that increased estrogen levels during testosterone treatment might exacerbate breast cancer growth. There are, however, few case reports of breast cancer occurring as a complication of testosterone treatment. Men with Klinefelter’s syndrome have a higher risk of breast cancer than the general population (602).


An Individualized, Patient-Centric Approach to Shared Decision Making in the Evaluation and Treatment of Older Men with Low Testosterone Levels


Recent large randomized clinical trials, especially the TTrials, have substantially expanded our understanding of the efficacy and short-term safety of testosterone in older men with low testosterone levels. However, none of the trials has been long enough or large enough to determine the effects of testosterone treatment on major adverse cardiovascular events and prostate cancer risk. Furthermore, the long-term efficacy of testosterone treatment in improving hard outcomes – physical disability, fractures, falls, progression to dementia, progression from prediabetes to diabetes, remission of late-life low grade persistent depressive disorder (dysthymia) - remains to be established. Adherence with testosterone treatment is poor and in one survey, nearly 50% of men prescribed testosterone, discontinued treatment within 3 months.  Population level screening of all older men for androgen deficiency is not justified (16) because of the lack of agreement on a case definition, the paucity of data on the performance characteristics of the screening instruments (e.g., the ADAM questionnaire (603), the Aging Male Symptoms questionnaire (604), and the MMAS questionnaire (605)) and the lack of clarity on the public health impact of the androgen deficiency syndrome in the general population.


Recognizing the lack of evidence of the long-term safety and efficacy of testosterone therapy in older men with symptomatic androgen deficiency, the expert panel of the Endocrine Society recommended against testosterone therapy of all men 65 years or older with low testosterone levels (16). Instead, the panel suggested that “in men >65 years who have symptoms or conditions suggestive of testosterone deficiency (such as low libido or unexplained anemia) and consistently and unequivocally low morning testosterone, clinicians offer testosterone therapy on an individualized basis after explicit discussion of the potential risks and benefits” (16).


The decision to offer testosterone treatment to older men with low testosterone levels should be guided by an individualized assessment of potential benefits and risks  (Figure 17) (606).  Determine whether the patient has clear evidence of testosterone deficiency recognizing the imprecision and inaccuracy of many available immunoassays and the substantial overlap in the symptoms of hypogonadism and aging per se. Perform a careful general health evaluation to identify conditions, such as prostate cancer, erythrocytosis, heart failure, or a hypercoagulable state that could increase the risk of harm. Weigh the burden of patient's symptoms and conditions associated with testosterone deficiency against the potential benefits and the uncertainty of long-term harm. Evaluate prostate cancer risk recognizing that prostate cancer screening and monitoring has some risks. Weigh the bother and distress associated with symptoms of testosterone deficiency and patient's values and risk tolerance against the uncertainty of benefits and long-term risks, and the burden, cost, and risks of treatment and monitoring. The participation of the patient who is well informed of the potential benefits and risks in the shared decision to initiate testosterone treatment can enable a more thoughtful treatment plan and increased adherence with the treatment and monitoring (606).

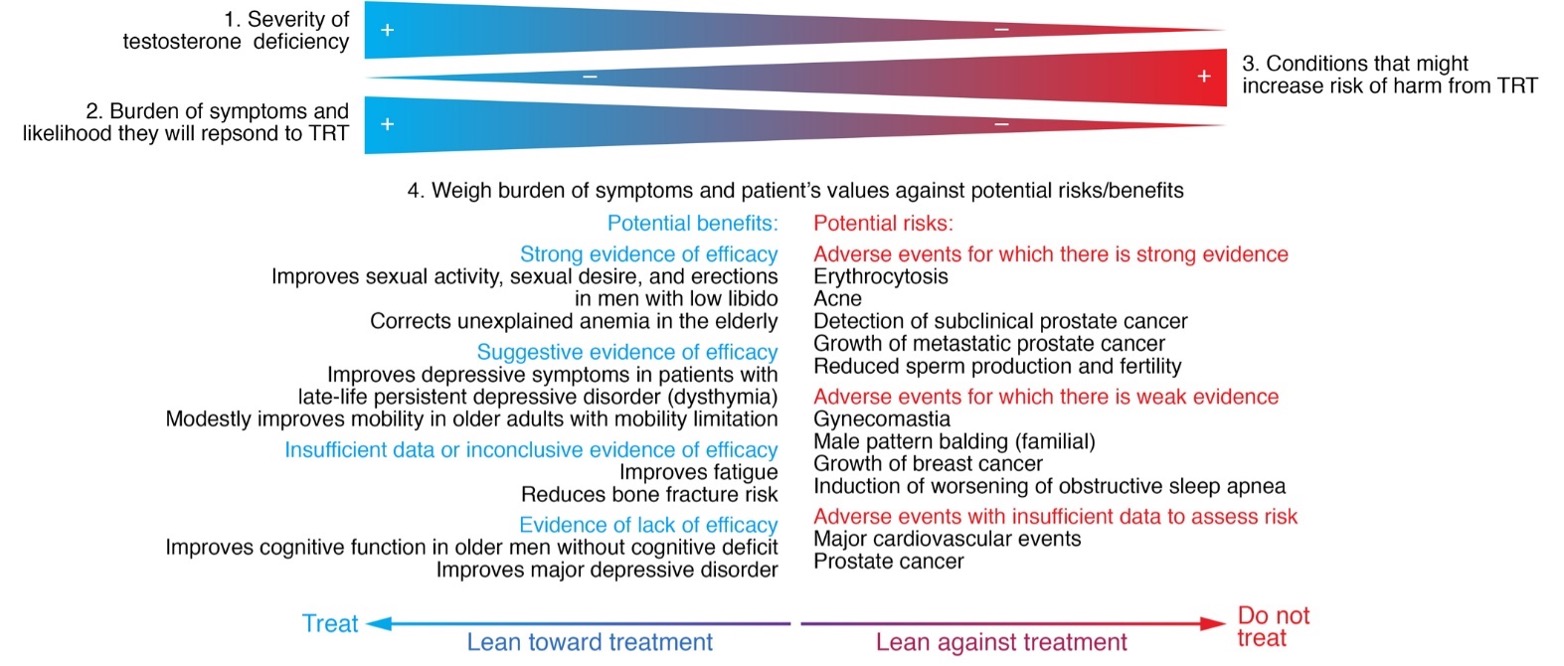
Figure 17. An evidence-based, individualized approach to testosterone therapy in older men with testosterone deficiency. The decision to offer testosterone treatment to older men with low testosterone levels should be guided by an individualized assessment of potential benefits and risks. Testosterone deficiency needs to be evaluated using reliable assays for the measurement of total and free testosterone levels. Patients should also be evaluated for conditions that are likely to respond to testosterone replacement therapy (TRT) as well as conditions that could be adversely impacted, such as prostate cancer, erythrocytosis, heart failure, or a hypercoagulable state. It is important to consider each patient’s burden of symptoms, individual preferences, and risk tolerance against the uncertainty of long-term benefits and risks, the burden and risks of monitoring, and the cost. Reproduced with permission from Bhasin S. 2021. J Clin Invest. 2021;131(4):e146607.

Testosterone therapy can be instituted using any of the available approved formulations based on considerations of pharmacokinetics, patient convenience and preference, cost, and formulation-specific adverse effects (16).  The men receiving testosterone therapy should be monitored using a standardized monitoring plan to facilitate early detection of adverse events and to minimize the risk of unnecessary prostate biopsies (Table 2), as recommended by the Endocrine Society expert panel (Table 3) (16).


CHANGES IN THE SPERMATOGENIC COMPARTMENT OF THE TESTIS


Women are more fertile below the age of 40, and fecundity decrease after age 35 and fertility ceases at the inception of menopause, around age 50. Increasing age in women confers greater risk for infertility, spontaneous abortion, and genetic and chromosomal defects among offspring. In contrast, there is no critical age at which sperm production or function, and fertility cease in men (607-614).  Although serum testosterone concentrations decrease below the normal range in a significant minority of older men, men over the age of 60 years commonly father children; the oldest father on record was 94-years old (607,609). Even though many older men are fertile, the overall fertility and fecundity decline with aging. The interpretability of data on the effects of aging on male fertility is limited by the small size of the studies and the low overall event rates.


Paternal age is associated with an increased risk of germ line mutations in FGFR2, FGFR3, and RET genes and inherited autosomal dominant diseases, such as Apert's syndrome, achondroplasia, and Costello Syndrome, respectively, in the offspring of older men (614-623). These monogenic disorders have been referred to as paternal age effect (PAE) disorders. Approximately one third of babies with diseases due to new autosomal dominant mutations are fathered by men aged 40 years or older (624).


Some other disorders such as schizophrenia, autism, and bipolar disorder have also been linked to paternal age (Figure 18) (615,616,622,623). The rate of de novo mutations increases with paternal age (622), which may contribute to the increase risk of neurodevelopmental diseases such as schizophrenia and autism (622).

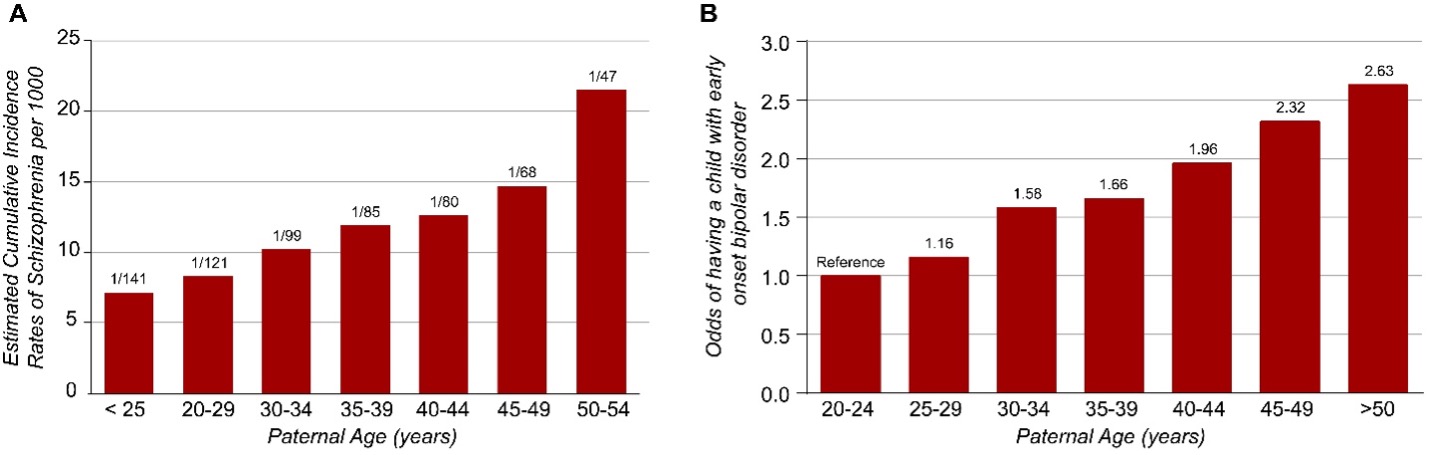
Figure 18. Impact of paternal age on incidence of schizophrenia and early-onset bipolar disorder. Increasing paternal age at conception increases the relative risk of having an offspring with schizophrenia (panel A; figure adapted from Malaspina et al. Arch Gen Psychiatry. 2001 Apr;58(4):361-7.) and the odds ratio of having a child with early-onset bipolar disorder (compared to fathers aged 20 to 24 years; panel B; data derived from Frans et al. Arch Gen Psychiatry. 2008 Sep;65(9):1034-40)

The accumulation of these de novo germ line mutations with increasing paternal age has been explained by the “selfish spermatogonial selection" hypothesis (618,619).  According to this hypothesis, the somatic mutations in male germ cells that enhance the proliferation of germ cells could lead to within-testis expansion of mutant clonal lines (620,621), thus favoring the propagation of germ cells carrying these pathogenic mutations, and increasing the risk of mutations in the offspring of older fathers (620,621). Interestingly, the risk of autism has also been associated with the age of the father as well as the grandparent (623). These concerns have prompted the American Society of Reproductive Medicine to state in their guidelines that semen donors should be younger than 40 years of age so that potential hazards related to aging are diminished (610).


Some cardiac defects have also been attributed to aberrant genetic input from older men.  For instance, a case-control study of 4,110 individuals with congenital heart defects born between 1952 and 1973 in British Columbia, found a general pattern of increasing risk with increasing paternal age among cases relative to controls for ventricular septal defects, atrial septal defects, and patent ductus arteriosus (617,624). The risk of schizophrenia has also been reported to increase with paternal age (618) and possible loci affecting this risk have been identified (625). In addition, a modest proportion of preeclampsia, normally associated with increased maternal risk factors including age, might be attributable to an increase in paternal age although no gene loci have been identified (626). These observations need further corroboration.


Although there is a positive association between paternal age and incidence of aneuploidy, it has been difficult to dissociate the effect of paternal age from the confounding influence of the advanced maternal age. After accounting for various confounders, there does not appear to be a major independent effect of increased paternal age on the incidence of autosomal aneuploidies (608,609,615,616,627,628). The existence of a paternal age effect on Down syndrome is controversial. Earlier studies from the 1960s and 1970s found no correlation between Down syndrome and paternal age (e.g.,(629)). However, a study in New York from 1983 to 1997 found a significant greater numbers of mothers and fathers 35 years of age and older, respectively, among parents of patients with Down’s syndrome (630). Among the cases of Down syndrome evaluated, paternal age had a significant effect only when the mothers were 35 years of age or older, and was the highest when both the Mother and Father were older than 40 years in which case the risk of Down Syndrome was 6 times that observed among couples younger than 35 years of age (630).


Changes in Fertility of Older Men  


A review of studies examining fertility at different ages demonstrated significant age-related differences in fertility rates in men; men older than 50 have lower pregnancy rates, increased time to pregnancy, and subfecundity compared to younger men (608,609,615,631,632). Some changes in fertility rates might be related to age-related decrease in sexual activity.  A literature review found no significant change in sperm concentration with aging when comparing men under the age of 30 to those greater than 50 years (613). However, in general, semen volume, sperm motility, and the number of morphologically normal sperm decrease with advancing age (Table 5; (45,608-614,622,627,628,631,633)). A number of these studies, however, did not control for important confounding variables. Of the 21 studies in which sperm densities were compared among men of different age groups (613), only four studies adjusted for the duration of abstinence, well known to affect sperm concentration. In addition, there is significant heterogeneity in the populations studied; most of the studies examined data from semen of sperm donors while others examined men from infertility clinics. Sperm donors might represent a healthier group of men than the general population; conversely men in infertility clinics might be more likely to have abnormalities of sperm number or function. Even studies that have controlled for abstinence as well as alcohol and tobacco use have shown an age-related decrease in semen volume. In one study of men whose partners had bilateral tubal obstruction or absence of both tubes and who were treated by conventional IVF, the odds ratio of failure to conceive was higher for men 40 years of age or older (634).


Table 5: Changes in Semen Quality and Fertility in Men with Age

Parameter

Age comparison

Change

Semen volume

30 versus ³50 years

3-22% decrease

Sperm concentration

Varying

None

Abnormal sperm morphology

£30 versus ³ 50 years

4-18% increase

Time to pregnancy

<30-35 versus >30-50 years

5-20% increase

Pregnancy rates

<30 versus > 50 years

23-38% decrease

Subfecundity

Varying

11-250% increase

From a Literature Review by Kidd et al., 2001 (501)

CHANGES IN THE GERM CELL COMPARTMENT


In a comparison of younger men (21-25 years) with older men (>50) referred for andrological evaluation, the ejaculate volume, progressive sperm motility, and sperm morphology were lower in older men than younger men after adjustment for duration of sexual abstinence (635). The older men also had a higher frequency of sperm tail defects, suggesting epididymal dysfunction (636). In addition, the fructose content was significantly lower in older men suggesting a defect in the seminal vesicle contribution to semen. There were no significant differences in sperm concentration and testicular size between the young and older men in this study.


Necropsies on adult men of different ages have revealed that the testicular volume is lower only in men in the 8th decade of life (637). A recent study examined testicular germ cells obtained by orchiectomy from 36 older men with advanced prostate cancer and by testicular biopsy from 21 younger men with obstructive azoospermia, as controls (638). The ratios of primary spermatocytes, round spermatids, and elongated spermatids to Sertoli cells were significantly decreased in the testes of older men, but the ratio of spermatogonia to Sertoli cell number remained unchanged (638,639). Older men are characterized by lower rates of germ cell apoptosis and cell proliferation compared with younger men, suggesting that germ cell proliferation and apoptosis diminish with aging (639).


Other studies evaluating the fidelity of the germ cell compartment are cross-sectional and depend on analyses of sperm number and semen quality; large-scale chromosomal analyses in healthy community dwelling men are scarce as most data are derived from fertility clinics.  A review of studies examining semen quality at different ages demonstrated significant age-related decrease in semen volume and sperm morphology. The change in sperm morphology has been hypothesized to be due to an increase in aneuploidy with age. Härkönen et al (628) found that sperm morphology was directly associated with the number of chromosomes in sperm and that men with higher aneuploidy rates for chromosomes 13, 18, 21, X and Y had lower sperm motility and sperm concentrations. Despite the changes in sperm morphology and motility from older men, in vitro fertilizing capacity of the sperm is well preserved (45,634).


There are several difficulties in interpreting these data on age-related changes in sperm density and function. The normal range for sperm concentration in men is wide where sperm concentration above 15 million/ml (total sperm per ejaculate > 39 million) is considered normal. Thus, even though average sperm concentrations decline with aging, they are still are in the normal range (45,632,638). Furthermore, normal sperm counts do not always correlate with normal sperm function.


Studies in flies demonstrate more germ cells during larval than adult stages suggesting age-related quiescence of the germ line (640). Significant age-related decreases in germ cells and spermatogenesis also have been reported in rodents and primates (641-645). The Brown Norway rat has been studied as a model of aging of the human male reproductive system because in this rodent model, serum testosterone levels decrease with aging, as they do in humans (642-644). Along with changes in hypothalamic-pituitary hormones, alterations in sperm counts, sperm maturation, Sertoli cell number, and progeny outcomes have been observed in this rodent model (Table 6) (626,642-651). Analysis of ribosomal DNA from germ cells of the male brown Norway rat has revealed hypermethylation of ribosomal DNA (645,652). Alterations in ribosomes have been theorized to promote aging of cells by multiplying errors in protein synthesis which initially might elude gross morphological analysis but eventually might lead to germ cell degeneration (652). Further assessment of spermatogonial stem cell populations is needed.  In many animal models of life span extension, there is a trade-off between longer life and fecundity, although there are some exceptions (653).


Table 6.  Changes in the Reproductive Axis in the Brown-Norway Rat

Parameter

Change

Reference

GnRH

¯

530, 531

FSH


530, 531

LH

®

530, 531

Testosterone

¯

530-532, 534

Germ Cells

¯

535

Sertoli Cells

¯

531, 537

Spermatogenesis

¯

531, 537

Seminiferous Tubules

¯

531, 537

Seminiferous Tubule Function

altered

534, 537

Epididymal function

¯

538

Sperm morphology

altered

538

Sperm motility

¯

538

Sperm Count

¯

532


CHANGES IN SUPPORTIVE CELLS AND ACCESSORY GLANDS


Since Sertoli and Leydig cells are crucial to spermatogenesis, changes in these cells could affect sperm number and function. Age-related changes in the supporting structures for sperm maturation have been described in the Brown Norway rat.  These changes include reductions in the numbers of Leydig and Sertoli cells (643-645). Changes in the supporting cells and structures for sperm maturation have been invoked to explain the age-related decrease in sperm number and fecundity in rats. In stallions, the numbers of Sertoli cells decreases with aging but individual Sertoli cells display a remarkable capacity to accommodate greater numbers of developing germ cells (654).  


In men, Sertoli cell number has been reported to be lower in men aged 50 to 85 years than in men aged 20 to 48 years (655). The apoptotic rate of primary spermatocytes in aged men was also significantly elevated compared with that of younger men, resulting in a decrease of the number of primary spermatocytes per Sertoli cell (639), leading the authors to suggest that there might be a failure of the Sertoli cells to support spermatogenesis in older men.


Sertoli cells produce inhibin, which regulates gonadotropin expression from the pituitary. Inhibin B has been identified as the physiologically important form of inhibin in men and as a valuable serum marker of Sertoli cell function and spermatogenesis.  Higher gonadotropins and lower inhibin levels in older men suggest a decline in Sertoli cell function (655); however changes in circulating inhibin B levels with advancing age have been inconsistent (70,655-657). Overall, these data suggest a possible decline in Sertoli cell number and function in older.


Aging is accompanied by a progressive, albeit variable, decline of Leydig cell function with a decrease of mean serum free (or bioavailable) testosterone levels in the population between age 25 and 75 years (658). Total Leydig cell volume and the absolute number of Leydig cells decline with advancing age, although total testis weight does not change substantially with age (658-662). In one study, age accounted for more than a third of the variation in Leydig cell number, and explained more than half the variation in daily sperm production (661). This might in part be explained by a fusion of Leydig cells resulting in fewer but multinucleated Leydig cells with age (662). The functionality of the multinucleated cells is not known.


REFERENCES


1.       Croft DP, Brent LJ, Franks DW, Cant MA. The evolution of prolonged life after reproduction. Trends Ecol Evol 2015; 30:407-416

2.       Bhasin S, Kerr C, Oktay K, Racowsky C. The Implications of Reproductive Aging for the Health, Vitality and Economic Welfare of Human Societies. J Clin Endocrinol Metab 2019;

3.       Stone L. Declining fertility in America. American Enterprise Institute. 2018; https://www.aei.org/wp-content/uploads/2018/12/Declining-Fertility-in-America.pdf. Accessed June 24, 2021.

4.       Schmidt L, Sobotka T, Bentzen JG, Nyboe Andersen A, Reproduction E, Society Task F. Demographic and medical consequences of the postponement of parenthood. Hum Reprod Update 2012; 18:29-43

5.       CDC. Birth Data. 2019; https://www.cdc.gov/nchs/nvss/births.htm. Accessed June 24, 2021.

6.       Live Births and Birth Rates, by Year.  https://www.infoplease.com/us/population/live-births-and-birth-rates-year. Accessed June 24, 2021.

7.       Mathews TJ, Hamilton BE. Mean age of mothers is on the rise: United States, 2000–2014. NCHS data brief, no 232. Hyattsville, MD: NCHS; 2016.

8.       Menken J, Trussell J, Larsen U. Age and infertility. Science 1986; 233:1389-1394

9.       Goetzinger KR, Shanks AL, Odibo AO, Macones GA, Cahill AG. Advanced Maternal Age and the Risk of Major Congenital Anomalies. Am J Perinatol 2017; 34:217-222

10.     American Society for Reproductive M. Guidelines for sperm donation. Fertil Steril 2004; 82 Suppl 1:S9-12

11.     Brandt JS, Cruz Ithier MA, Rosen T, Ashkinadze E. Advanced paternal age, infertility, and reproductive risks: A review of the literature. Prenat Diagn 2019; 39:81-87

12.     Rossouw JE, Anderson GL, Prentice RL, LaCroix AZ, Kooperberg C, Stefanick ML, Jackson RD, Beresford SA, Howard BV, Johnson KC, Kotchen JM, Ockene J, Writing Group for the Women's Health Initiative I. Risks and benefits of estrogen plus progestin in healthy postmenopausal women: principal results From the Women's Health Initiative randomized controlled trial. JAMA 2002; 288:321-333

13.     Hulley S, Grady D, Bush T, Furberg C, Herrington D, Riggs B, Vittinghoff E. Randomized trial of estrogen plus progestin for secondary prevention of coronary heart disease in postmenopausal women. Heart and Estrogen/progestin Replacement Study (HERS) Research Group. JAMA 1998; 280:605-613

14.     Harman SM, Naftolin F, Brinton EA, Judelson DR. Is the estrogen controversy over? Deconstructing the Women's Health Initiative study: a critical evaluation of the evidence. Ann N Y Acad Sci 2005; 1052:43-56

15.     Barrett-Connor E. Hormones and heart disease in women: the timing hypothesis. Am J Epidemiol 2007; 166:506-510

16.     Bhasin S, Brito JP, Cunningham GR, Hayes FJ, Hodis HN, Matsumoto AM, Snyder PJ, Swerdloff RS, Wu FC, Yialamas MA. Testosterone Therapy in Men With Hypogonadism: An Endocrine Society Clinical Practice Guideline. J Clin Endocrinol Metab 2018; 103:1715-1744

17.     Petak SM, Nankin HR, Spark RF, Swerdloff RS, Rodriguez-Rigau LJ, American Association of Clinical E. American Association of Clinical Endocrinologists Medical Guidelines for clinical practice for the evaluation and treatment of hypogonadism in adult male patients--2002 update. Endocr Pract 2002; 8:440-456

18.     Spitzer M, Huang G, Basaria S, Travison TG, Bhasin S. Risks and benefits of testosterone therapy in older men. Nat Rev Endocrinol 2013; 9:414-424

19.     Wang C, Nieschlag E, Swerdloff R, Behre HM, Hellstrom WJ, Gooren LJ, Kaufman JM, Legros JJ, Lunenfeld B, Morales A, Morley JE, Schulman C, Thompson IM, Weidner W, Wu FC, International Society of A, International Society for the Study of Aging M, European Association of U, European Academy of A, American Society of A. Investigation, treatment, and monitoring of late-onset hypogonadism in males: ISA, ISSAM, EAU, EAA, and ASA recommendations. J Androl 2009; 30:1-9

20.     Matsumoto AM. Andropause: clinical implications of the decline in serum testosterone levels with aging in men. J Gerontol A Biol Sci Med Sci 2002; 57:M76-99

21.     Bhasin S, Buckwalter JG. Testosterone supplementation in older men: a rational idea whose time has not yet come. J Androl 2001; 22:718-731

22.     Basaria S, Coviello AD, Travison TG, Storer TW, Farwell WR, Jette AM, Eder R, Tennstedt S, Ulloor J, Zhang A, Choong K, Lakshman KM, Mazer NA, Miciek R, Krasnoff J, Elmi A, Knapp PE, Brooks B, Appleman E, Aggarwal S, Bhasin G, Hede-Brierley L, Bhatia A, Collins L, LeBrasseur N, Fiore LD, Bhasin S. Adverse events associated with testosterone administration. N Engl J Med 2010; 363:109-122

23.     Basaria S, Harman SM, Travison TG, Hodis H, Tsitouras P, Budoff M, Pencina KM, Vita J, Dzekov C, Mazer NA, Coviello AD, Knapp PE, Hally K, Pinjic E, Yan M, Storer TW, Bhasin S. Effects of Testosterone Administration for 3 Years on Subclinical Atherosclerosis Progression in Older Men With Low or Low-Normal Testosterone Levels: A Randomized Clinical Trial. JAMA 2015; 314:570-581

24.     Brock G, Heiselman D, Maggi M, Kim SW, Rodriguez Vallejo JM, Behre HM, McGettigan J, Dowsett SA, Hayes RP, Knorr J, Ni X, Kinchen K. Effect of Testosterone Solution 2% on Testosterone Concentration, Sex Drive and Energy in Hypogonadal Men: Results of a Placebo Controlled Study. J Urol 2016; 195:699-705

25.     Emmelot-Vonk MH, Verhaar HJ, Nakhai Pour HR, Aleman A, Lock TM, Bosch JL, Grobbee DE, van der Schouw YT. Effect of testosterone supplementation on functional mobility, cognition, and other parameters in older men: a randomized controlled trial. JAMA 2008; 299:39-52

26.     Snyder PJ, Bhasin S, Cunningham GR, Matsumoto AM, Stephens-Shields AJ, Cauley JA, Gill TM, Barrett-Connor E, Swerdloff RS, Wang C, Ensrud KE, Lewis CE, Farrar JT, Cella D, Rosen RC, Pahor M, Crandall JP, Molitch ME, Cifelli D, Dougar D, Fluharty L, Resnick SM, Storer TW, Anton S, Basaria S, Diem SJ, Hou X, Mohler ER, 3rd, Parsons JK, Wenger NK, Zeldow B, Landis JR, Ellenberg SS, Testosterone Trials I. Effects of Testosterone Treatment in Older Men. N Engl J Med 2016; 374:611-624

27.     Snyder PJ, Bhasin S, Cunningham GR, Matsumoto AM, Stephens-Shields AJ, Cauley JA, Gill TM, Barrett-Connor E, Swerdloff RS, Wang C, Ensrud KE, Lewis CE, Farrar JT, Cella D, Rosen RC, Pahor M, Crandall JP, Molitch ME, Resnick SM, Budoff M, Mohler ER, 3rd, Wenger NK, Cohen HJ, Schrier S, Keaveny TM, Kopperdahl D, Lee D, Cifelli D, Ellenberg SS. Lessons From the Testosterone Trials. Endocr Rev 2018; 39:369-386

28.     Srinivas-Shankar U, Roberts SA, Connolly MJ, O'Connell MD, Adams JE, Oldham JA, Wu FC. Effects of testosterone on muscle strength, physical function, body composition, and quality of life in intermediate-frail and frail elderly men: a randomized, double-blind, placebo-controlled study. J Clin Endocrinol Metab 2010; 95:639-650

29.     Shi Z, Araujo AB, Martin S, O'Loughlin P, Wittert GA. Longitudinal changes in testosterone over five years in community-dwelling men. J Clin Endocrinol Metab 2013; 98:3289-3297

30.     Diver MJ, Imtiaz KE, Ahmad AM, Vora JP, Fraser WD. Diurnal rhythms of serum total, free and bioavailable testosterone and of SHBG in middle-aged men compared with those in young men. Clin Endocrinol (Oxf) 2003; 58:710-717

31.     Harman SM, Metter EJ, Tobin JD, Pearson J, Blackman MR, Baltimore Longitudinal Study of A. Longitudinal effects of aging on serum total and free testosterone levels in healthy men. Baltimore Longitudinal Study of Aging. J Clin Endocrinol Metab 2001; 86:724-731

32.     Feldman HA, Longcope C, Derby CA, Johannes CB, Araujo AB, Coviello AD, Bremner WJ, McKinlay JB. Age trends in the level of serum testosterone and other hormones in middle-aged men: longitudinal results from the Massachusetts male aging study. J Clin Endocrinol Metab 2002; 87:589-598

33.     Morley JE, Kaiser FE, Perry HM, 3rd, Patrick P, Morley PM, Stauber PM, Vellas B, Baumgartner RN, Garry PJ. Longitudinal changes in testosterone, luteinizing hormone, and follicle-stimulating hormone in healthy older men. Metabolism 1997; 46:410-413

34.     Zmuda JM, Cauley JA, Kriska A, Glynn NW, Gutai JP, Kuller LH. Longitudinal relation between endogenous testosterone and cardiovascular disease risk factors in middle-aged men. A 13-year follow-up of former Multiple Risk Factor Intervention Trial participants. Am J Epidemiol 1997; 146:609-617

35.     Gray A, Feldman HA, McKinlay JB, Longcope C. Age, disease, and changing sex hormone levels in middle-aged men: results of the Massachusetts Male Aging Study. J Clin Endocrinol Metab 1991; 73:1016-1025

36.     Simon D, Preziosi P, Barrett-Connor E, Roger M, Saint-Paul M, Nahoul K, Papoz L. The influence of aging on plasma sex hormones in men: the Telecom Study. Am J Epidemiol 1992; 135:783-791

37.     Ferrini RL, Barrett-Connor E. Sex hormones and age: a cross-sectional study of testosterone and estradiol and their bioavailable fractions in community-dwelling men. Am J Epidemiol 1998; 147:750-754

38.     Dai WS, Kuller LH, LaPorte RE, Gutai JP, Falvo-Gerard L, Caggiula A. The epidemiology of plasma testosterone levels in middle-aged men. Am J Epidemiol 1981; 114:804-816

39.     Pollanen P, Harkonen K, Makinen J, Irjala K, Saad F, Hubler D, Oettel M, Koskenuo M, Huhtaniemi I. Facts and fictions of andropause: lessons from the Turku male Ageing Study. Paper presented at: 1st International Congress on Male Health 2001

40.     Wu FCW. 2003 Subclinical hypogonadism. Endocrine Society Meeting; 2003; Philadelphia, PA.

41.     Bremner WJ, Vitiello MV, Prinz PN. Loss of circadian rhythmicity in blood testosterone levels with aging in normal men. J Clin Endocrinol Metab 1983; 56:1278-1281

42.     Harman SM, Tsitouras PD. Reproductive hormones in aging men. I. Measurement of sex steroids, basal luteinizing hormone, and Leydig cell response to human chorionic gonadotropin. J Clin Endocrinol Metab 1980; 51:35-40

43.     Harman SM, Tsitouras PD, Costa PT, Blackman MR. Reproductive hormones in aging men. II. Basal pituitary gonadotropins and gonadotropin responses to luteinizing hormone-releasing hormone. J Clin Endocrinol Metab 1982; 54:547-551

44.     Murono EP, Nankin HR, Lin T, Osterman J. The aging Leydig cell: VI. Response of testosterone precursors to gonadotrophin in men. Acta Endocrinol (Copenh) 1982; 100:455-461

45.     Nieschlag E, Lammers U, Freischem CW, Langer K, Wickings EJ. Reproductive functions in young fathers and grandfathers. J Clin Endocrinol Metab 1982; 55:676-681

46.     Tenover JS, Matsumoto AM, Plymate SR, Bremner WJ. The effects of aging in normal men on bioavailable testosterone and luteinizing hormone secretion: response to clomiphene citrate. J Clin Endocrinol Metab 1987; 65:1118-1126

47.     Wu FC, Tajar A, Beynon JM, Pye SR, Silman AJ, Finn JD, O'Neill TW, Bartfai G, Casanueva FF, Forti G, Giwercman A, Han TS, Kula K, Lean ME, Pendleton N, Punab M, Boonen S, Vanderschueren D, Labrie F, Huhtaniemi IT, Group E. Identification of late-onset hypogonadism in middle-aged and elderly men. N Engl J Med 2010; 363:123-135

48.     Bhasin S, Pencina M, Jasuja GK, Travison TG, Coviello A, Orwoll E, Wang PY, Nielson C, Wu F, Tajar A, Labrie F, Vesper H, Zhang A, Ulloor J, Singh R, D'Agostino R, Vasan RS. Reference ranges for testosterone in men generated using liquid chromatography tandem mass spectrometry in a community-based sample of healthy nonobese young men in the Framingham Heart Study and applied to three geographically distinct cohorts. J Clin Endocrinol Metab 2011; 96:2430-2439

49.     In: Liverman CT, Blazer DG, eds. Testosterone and Aging: Clinical Research Directions. Washington (DC)2004.

50.     Orwoll E, Lambert LC, Marshall LM, Phipps K, Blank J, Barrett-Connor E, Cauley J, Ensrud K, Cummings S. Testosterone and estradiol among older men. J Clin Endocrinol Metab 2006; 91:1336-1344

51.     Zumoff B, Strain GW, Kream J, O'Connor J, Rosenfeld RS, Levin J, Fukushima DK. Age variation of the 24-hour mean plasma concentrations of androgens, estrogens, and gonadotropins in normal adult men. J Clin Endocrinol Metab 1982; 54:534-538

52.     Pirke KM, Doerr P. Age related changes and interrelationships between plasma testosterone, oestradiol and testosterone-binding globulin in normal adult males. Acta Endocrinol (Copenh) 1973; 74:792-800

53.     Mohr BA, Bhasin S, Link CL, O'Donnell AB, McKinlay JB. The effect of changes in adiposity on testosterone levels in older men: longitudinal results from the Massachusetts Male Aging Study. Eur J Endocrinol 2006; 155:443-452

54.     Wu FC, Tajar A, Pye SR, Silman AJ, Finn JD, O'Neill TW, Bartfai G, Casanueva F, Forti G, Giwercman A, Huhtaniemi IT, Kula K, Punab M, Boonen S, Vanderschueren D, European Male Aging Study G. Hypothalamic-pituitary-testicular axis disruptions in older men are differentially linked to age and modifiable risk factors: the European Male Aging Study. J Clin Endocrinol Metab 2008; 93:2737-2745

55.     Sartorius G, Spasevska S, Idan A, Turner L, Forbes E, Zamojska A, Allan CA, Ly LP, Conway AJ, McLachlan RI, Handelsman DJ. Serum testosterone, dihydrotestosterone and estradiol concentrations in older men self-reporting very good health: the healthy man study. Clin Endocrinol (Oxf) 2012; 77:755-763

56.     Camacho EM, Huhtaniemi IT, O'Neill TW, Finn JD, Pye SR, Lee DM, Tajar A, Bartfai G, Boonen S, Casanueva FF, Forti G, Giwercman A, Han TS, Kula K, Keevil B, Lean ME, Pendleton N, Punab M, Vanderschueren D, Wu FC, Group E. Age-associated changes in hypothalamic-pituitary-testicular function in middle-aged and older men are modified by weight change and lifestyle factors: longitudinal results from the European Male Ageing Study. Eur J Endocrinol 2013; 168:445-455

57.     Tajar A, Forti G, O'Neill TW, Lee DM, Silman AJ, Finn JD, Bartfai G, Boonen S, Casanueva FF, Giwercman A, Han TS, Kula K, Labrie F, Lean ME, Pendleton N, Punab M, Vanderschueren D, Huhtaniemi IT, Wu FC, Group E. Characteristics of secondary, primary, and compensated hypogonadism in aging men: evidence from the European Male Ageing Study. J Clin Endocrinol Metab 2010; 95:1810-1818

58.     McKinlay JB, Longcope C, Gray A. The questionable physiologic and epidemiologic basis for a male climacteric syndrome: preliminary results from the Massachusetts Male Aging Study. Maturitas 1989; 11:103-115

59.     Tajar A, Huhtaniemi IT, O'Neill TW, Finn JD, Pye SR, Lee DM, Bartfai G, Boonen S, Casanueva FF, Forti G, Giwercman A, Han TS, Kula K, Labrie F, Lean ME, Pendleton N, Punab M, Vanderschueren D, Wu FC, Group E. Characteristics of androgen deficiency in late-onset hypogonadism: results from the European Male Aging Study (EMAS). J Clin Endocrinol Metab 2012; 97:1508-1516

60.     Ohlsson C, Wallaschofski H, Lunetta KL, Stolk L, Perry JR, Koster A, Petersen AK, Eriksson J, Lehtimaki T, Huhtaniemi IT, Hammond GL, Maggio M, Coviello AD, Group ES, Ferrucci L, Heier M, Hofman A, Holliday KL, Jansson JO, Kahonen M, Karasik D, Karlsson MK, Kiel DP, Liu Y, Ljunggren O, Lorentzon M, Lyytikainen LP, Meitinger T, Mellstrom D, Melzer D, Miljkovic I, Nauck M, Nilsson M, Penninx B, Pye SR, Vasan RS, Reincke M, Rivadeneira F, Tajar A, Teumer A, Uitterlinden AG, Ulloor J, Viikari J, Volker U, Volzke H, Wichmann HE, Wu TS, Zhuang WV, Ziv E, Wu FC, Raitakari O, Eriksson A, Bidlingmaier M, Harris TB, Murray A, de Jong FH, Murabito JM, Bhasin S, Vandenput L, Haring R. Genetic determinants of serum testosterone concentrations in men. PLoS Genet 2011; 7:e1002313

61.     Coviello AD, Lakshman K, Mazer NA, Bhasin S. Differences in the apparent metabolic clearance rate of testosterone in young and older men with gonadotropin suppression receiving graded doses of testosterone. J Clin Endocrinol Metab 2006; 91:4669-4675

62.     Ishimaru T, Pages L, Horton R. Altered metabolism of androgens in elderly men with benign prostatic hyperplasia. J Clin Endocrinol Metab 1977; 45:695-701

63.     Mulligan T, Iranmanesh A, Johnson ML, Straume M, Veldhuis JD. Aging alters feed-forward and feedback linkages between LH and testosterone in healthy men. Am J Physiol 1997; 273:R1407-1413

64.     Winters SJ, Sherins RJ, Troen P. The gonadotropin-suppressive activity of androgen is increased in elderly men. Metabolism 1984; 33:1052-1059

65.     Urban RJ, Veldhuis JD, Blizzard RM, Dufau ML. Attenuated release of biologically active luteinizing hormone in healthy aging men. J Clin Invest 1988; 81:1020-1029

66.     Zwart AD, Urban RJ, Odell WD, Veldhuis JD. Contrasts in the gonadotropin-releasing hormone dose-response relationships for luteinizing hormone, follicle-stimulating hormone and alpha-subunit release in young versus older men: appraisal with high-specificity immunoradiometric assay and deconvolution analysis. Eur J Endocrinol 1996; 135:399-406

67.     Gruenewald DA, Naai MA, Marck BT, Matsumoto AM. Age-related decrease in hypothalamic gonadotropin-releasing hormone (GnRH) gene expression, but not pituitary responsiveness to GnRH, in the male Brown Norway rat. J Androl 2000; 21:72-84

68.     Bonavera JJ, Swerdloff RS, Sinha Hakim AP, Lue YH, Wang C. Aging results in attenuated gonadotropin releasing hormone-luteinizing hormone axis responsiveness to glutamate receptor agonist N-methyl-D-aspartate. J Neuroendocrinol 1998; 10:93-99

69.     Deslypere JP, Kaufman JM, Vermeulen T, Vogelaers D, Vandalem JL, Vermeulen A. Influence of age on pulsatile luteinizing hormone release and responsiveness of the gonadotrophs to sex hormone feedback in men. J Clin Endocrinol Metab 1987; 64:68-73

70.     Mahmoud AM, Goemaere S, De Bacquer D, Comhaire FH, Kaufman JM. Serum inhibin B levels in community-dwelling elderly men. Clin Endocrinol (Oxf) 2000; 53:141-147

71.     Pincus SM, Mulligan T, Iranmanesh A, Gheorghiu S, Godschalk M, Veldhuis JD. Older males secrete luteinizing hormone and testosterone more irregularly, and jointly more asynchronously, than younger males. Proc Natl Acad Sci U S A 1996; 93:14100-14105

72.     Keenan DM, Veldhuis JD. Disruption of the hypothalamic luteinizing hormone pulsing mechanism in aging men. Am J Physiol Regul Integr Comp Physiol 2001; 281:R1917-1924

73.     Eendebak R, Ahern T, Swiecicka A, Pye SR, O'Neill TW, Bartfai G, Casanueva FF, Maggi M, Forti G, Giwercman A, Han TS, Slowikowska-Hilczer J, Lean MEJ, Punab M, Pendleton N, Keevil BG, Vanderschueren D, Rutter MK, Tampubolon G, Goodacre R, Huhtaniemi IT, Wu FCW, Group E. Elevated luteinizing hormone despite normal testosterone levels in older men-natural history, risk factors and clinical features. Clin Endocrinol (Oxf) 2018; 88:479-490

74.     Morales A, Lunenfeld B, International Society for the Study of the Aging M. Investigation, treatment and monitoring of late-onset hypogonadism in males. Official recommendations of ISSAM. International Society for the Study of the Aging Male. Aging Male 2002; 5:74-86

75.     Society E. Proceedings of the Andropause Consensus Panel. 2002

76.     Bhasin S, Tenover JS. Age-associated sarcopenia--issues in the use of testosterone as an anabolic agent in older men. J Clin Endocrinol Metab 1997; 82:1659-1660

77.     Perry HM, 3rd, Miller DK, Patrick P, Morley JE. Testosterone and leptin in older African-American men: relationship to age, strength, function, and season. Metabolism 2000; 49:1085-1091

78.     Melton LJ, 3rd, Khosla S, Riggs BL. Epidemiology of sarcopenia. Mayo Clin Proc 2000; 75 Suppl:S10-12; discussion S12-13

79.     Baumgartner RN, Koehler KM, Gallagher D, Romero L, Heymsfield SB, Ross RR, Garry PJ, Lindeman RD. Epidemiology of sarcopenia among the elderly in New Mexico. Am J Epidemiol 1998; 147:755-763

80.     Baumgartner RN, Waters DL, Gallagher D, Morley JE, Garry PJ. Predictors of skeletal muscle mass in elderly men and women. Mech Ageing Dev 1999; 107:123-136

81.     Workshop on sarcopenia: muscle atrophy in old age. Airlie, Virginia, September 19-21, 1994. Proceedings. J Gerontol A Biol Sci Med Sci 1995; 50 Spec No:1-161

82.     Dutta C, Hadley EC. The significance of sarcopenia in old age. J Gerontol A Biol Sci Med Sci 1995; 50 Spec No:1-4

83.     Kohrt WM, Malley MT, Dalsky GP, Holloszy JO. Body composition of healthy sedentary and trained, young and older men and women. Med Sci Sports Exerc 1992; 24:832-837

84.     American Medical Association white paper on elderly health. Report of the Council on Scientific Affairs. Arch Intern Med 1990; 150:2459-2472

85.     Borkan GA, Hults DE, Gerzof SG, Robbins AH, Silbert CK. Age changes in body composition revealed by computed tomography. J Gerontol 1983; 38:673-677

86.     Borkan GA, Norris AH. Fat redistribution and the changing body dimensions of the adult male. Hum Biol 1977; 49:495-513

87.     Cohn SH, Vartsky D, Yasumura S, Sawitsky A, Zanzi I, Vaswani A, Ellis KJ. Compartmental body composition based on total-body nitrogen, potassium, and calcium. Am J Physiol 1980; 239:E524-530

88.     Novak LP. Aging, total body potassium, fat-free mass, and cell mass in males and females between ages 18 and 85 years. J Gerontol 1972; 27:438-443

89.     Schoeller DA. Changes in total body water with age. Am J Clin Nutr 1989; 50:1176-1181; discussion 1231-1175

90.     Evans WJ. Effects of exercise on body composition and functional capacity of the elderly. J Gerontol A Biol Sci Med Sci 1995; 50 Spec No:147-150

91.     Fleg JL, Lakatta EG. Role of muscle loss in the age-associated reduction in VO2 max. J Appl Physiol (1985) 1988; 65:1147-1151

92.     Proctor DN, Balagopal P, Nair KS. Age-related sarcopenia in humans is associated with reduced synthetic rates of specific muscle proteins. J Nutr 1998; 128:351S-355S

93.     Lexell J, Henriksson-Larsen K, Winblad B, Sjostrom M. Distribution of different fiber types in human skeletal muscles: effects of aging studied in whole muscle cross sections. Muscle Nerve 1983; 6:588-595

94.     Lexell J. Human aging, muscle mass, and fiber type composition. J Gerontol A Biol Sci Med Sci 1995; 50 Spec No:11-16

95.     Frontera WR, Hughes VA, Lutz KJ, Evans WJ. A cross-sectional study of muscle strength and mass in 45- to 78-yr-old men and women. J Appl Physiol (1985) 1991; 71:644-650

96.     Harris T. Muscle mass and strength: relation to function in population studies. J Nutr 1997; 127:1004S-1006S

97.     Skelton DA, Greig CA, Davies JM, Young A. Strength, power and related functional ability of healthy people aged 65-89 years. Age Ageing 1994; 23:371-377

98.     Roy TA, Blackman MR, Harman SM, Tobin JD, Schrager M, Metter EJ. Interrelationships of serum testosterone and free testosterone index with FFM and strength in aging men. Am J Physiol Endocrinol Metab 2002; 283:E284-294

99.     O'Donnell AB, Travison TG, Harris SS, Tenover JL, McKinlay JB. Testosterone, dehydroepiandrosterone, and physical performance in older men: results from the Massachusetts Male Aging Study. J Clin Endocrinol Metab 2006; 91:425-431

100.   Mohr BA, Bhasin S, Kupelian V, Araujo AB, O'Donnell AB, McKinlay JB. Testosterone, sex hormone-binding globulin, and frailty in older men. J Am Geriatr Soc 2007; 55:548-555

101.   van den Beld AW, de Jong FH, Grobbee DE, Pols HA, Lamberts SW. Measures of bioavailable serum testosterone and estradiol and their relationships with muscle strength, bone density, and body composition in elderly men. J Clin Endocrinol Metab 2000; 85:3276-3282

102.   Schaap LA, Pluijm SM, Smit JH, van Schoor NM, Visser M, Gooren LJ, Lips P. The association of sex hormone levels with poor mobility, low muscle strength and incidence of falls among older men and women. Clin Endocrinol (Oxf) 2005; 63:152-160

103.   Orwoll E, Lambert LC, Marshall LM, Blank J, Barrett-Connor E, Cauley J, Ensrud K, Cummings SR, Osteoporotic Fractures in Men Study G. Endogenous testosterone levels, physical performance, and fall risk in older men. Arch Intern Med 2006; 166:2124-2131

104.   Krasnoff JB, Basaria S, Pencina MJ, Jasuja GK, Vasan RS, Ulloor J, Zhang A, Coviello A, Kelly-Hayes M, D'Agostino RB, Wolf PA, Bhasin S, Murabito JM. Free testosterone levels are associated with mobility limitation and physical performance in community-dwelling men: the Framingham Offspring Study. J Clin Endocrinol Metab 2010; 95:2790-2799

105.   Hyde Z, Flicker L, Almeida OP, Hankey GJ, McCaul KA, Chubb SA, Yeap BB. Low free testosterone predicts frailty in older men: the health in men study. J Clin Endocrinol Metab 2010; 95:3165-3172

106.   Travison TG, Nguyen AH, Naganathan V, Stanaway FF, Blyth FM, Cumming RG, Le Couteur DG, Sambrook PN, Handelsman DJ. Changes in reproductive hormone concentrations predict the prevalence and progression of the frailty syndrome in older men: the concord health and ageing in men project. J Clin Endocrinol Metab 2011; 96:2464-2474

107.   Cawthon PM, Ensrud KE, Laughlin GA, Cauley JA, Dam TT, Barrett-Connor E, Fink HA, Hoffman AR, Lau E, Lane NE, Stefanick ML, Cummings SR, Orwoll ES, Osteoporotic Fractures in Men Research G. Sex hormones and frailty in older men: the osteoporotic fractures in men (MrOS) study. J Clin Endocrinol Metab 2009; 94:3806-3815

108.   Travison TG, Morley JE, Araujo AB, O'Donnell AB, McKinlay JB. The relationship between libido and testosterone levels in aging men. J Clin Endocrinol Metab 2006; 91:2509-2513

109.   Zitzmann M, Faber S, Nieschlag E. Association of specific symptoms and metabolic risks with serum testosterone in older men. J Clin Endocrinol Metab 2006; 91:4335-4343

110.   Marberger M, Roehrborn CG, Marks LS, Wilson T, Rittmaster RS. Relationship among serum testosterone, sexual function, and response to treatment in men receiving dutasteride for benign prostatic hyperplasia. J Clin Endocrinol Metab 2006; 91:1323-1328

111.   Araujo AB, Esche GR, Kupelian V, O'Donnell AB, Travison TG, Williams RE, Clark RV, McKinlay JB. Prevalence of symptomatic androgen deficiency in men. J Clin Endocrinol Metab 2007; 92:4241-4247

112.   Kaiser FE, Viosca SP, Morley JE, Mooradian AD, Davis SS, Korenman SG. Impotence and aging: clinical and hormonal factors. J Am Geriatr Soc 1988; 36:511-519

113.   Korenman SG, Morley JE, Mooradian AD, Davis SS, Kaiser FE, Silver AJ, Viosca SP, Garza D. Secondary hypogonadism in older men: its relation to impotence. J Clin Endocrinol Metab 1990; 71:963-969

114.   Cunningham GR, Stephens-Shields AJ, Rosen RC, Wang C, Ellenberg SS, Matsumoto AM, Bhasin S, Molitch ME, Farrar JT, Cella D, Barrett-Connor E, Cauley JA, Cifelli D, Crandall JP, Ensrud KE, Fluharty L, Gill TM, Lewis CE, Pahor M, Resnick SM, Storer TW, Swerdloff RS, Anton S, Basaria S, Diem S, Tabatabaie V, Hou X, Snyder PJ. Association of sex hormones with sexual function, vitality, and physical function of symptomatic older men with low testosterone levels at baseline in the testosterone trials. J Clin Endocrinol Metab 2015; 100:1146-1155

115.   O'Connor DB, Lee DM, Corona G, Forti G, Tajar A, O'Neill TW, Pendleton N, Bartfai G, Boonen S, Casanueva FF, Finn JD, Giwercman A, Han TS, Huhtaniemi IT, Kula K, Labrie F, Lean ME, Punab M, Silman AJ, Vanderschueren D, Wu FC, European Male Ageing Study G. The relationships between sex hormones and sexual function in middle-aged and older European men. J Clin Endocrinol Metab 2011; 96:E1577-1587

116.   Dodge HH, Du Y, Saxton JA, Ganguli M. Cognitive domains and trajectories of functional independence in nondemented elderly persons. J Gerontol A Biol Sci Med Sci 2006; 61:1330-1337

117.   Liu-Ambrose T, Pang MY, Eng JJ. Executive function is independently associated with performances of balance and mobility in community-dwelling older adults after mild stroke: implications for falls prevention. Cerebrovasc Dis 2007; 23:203-210

118.   Janowsky JS, Oviatt SK, Orwoll ES. Testosterone influences spatial cognition in older men. Behav Neurosci 1994; 108:325-332

119.   Janowsky JS. The role of androgens in cognition and brain aging in men. Neuroscience 2006; 138:1015-1020

120.   Fales CL, Knowlton BJ, Holyoak KJ, Geschwind DH, Swerdloff RS, Gonzalo IG. Working memory and relational reasoning in Klinefelter syndrome. J Int Neuropsychol Soc 2003; 9:839-846

121.   Alexander GM, Swerdloff RS, Wang C, Davidson T, McDonald V, Steiner B, Hines M. Androgen-behavior correlations in hypogonadal men and eugonadal men. II. Cognitive abilities. Horm Behav 1998; 33:85-94

122.   Barrett-Connor E, Goodman-Gruen D, Patay B. Endogenous sex hormones and cognitive function in older men. J Clin Endocrinol Metab 1999; 84:3681-3685

123.   Gouchie C, Kimura D. The relationship between testosterone levels and cognitive ability patterns. Psychoneuroendocrinology 1991; 16:323-334

124.   Shute VJ, Pellegrino JW, Hubert L, Reynolds RW. The relationship between androgen levels and human spatial abilities. Bulletin of the Psychonomic Society 2013; 21:465-468

125.   Margolese HC. The male menopause and mood: testosterone decline and depression in the aging male--is there a link? J Geriatr Psychiatry Neurol 2000; 13:93-101

126.   Barrett-Connor E, Von Muhlen DG, Kritz-Silverstein D. Bioavailable testosterone and depressed mood in older men: the Rancho Bernardo Study. J Clin Endocrinol Metab 1999; 84:573-577

127.   van Honk J, Tuiten A, Verbaten R, van den Hout M, Koppeschaar H, Thijssen J, de Haan E. Correlations among salivary testosterone, mood, and selective attention to threat in humans. Horm Behav 1999; 36:17-24

128.   Seidman SN, Araujo AB, Roose SP, McKinlay JB. Testosterone level, androgen receptor polymorphism, and depressive symptoms in middle-aged men. Biol Psychiatry 2001; 50:371-376

129.   Seidman SN, Araujo AB, Roose SP, Devanand DP, Xie S, Cooper TB, McKinlay JB. Low testosterone levels in elderly men with dysthymic disorder. Am J Psychiatry 2002; 159:456-459

130.   Markianos M, Tripodianakis J, Sarantidis D, Hatzimanolis J. Plasma testosterone and dehydroepiandrosterone sulfate in male and female patients with dysthymic disorder. J Affect Disord 2007; 101:255-258

131.   Fink HA, Ewing SK, Ensrud KE, Barrett-Connor E, Taylor BC, Cauley JA, Orwoll ES. Association of testosterone and estradiol deficiency with osteoporosis and rapid bone loss in older men. J Clin Endocrinol Metab 2006; 91:3908-3915

132.   Greendale GA, Edelstein S, Barrett-Connor E. Endogenous sex steroids and bone mineral density in older women and men: the Rancho Bernardo Study. J Bone Miner Res 1997; 12:1833-1843

133.   Amin S, Zhang Y, Sawin CT, Evans SR, Hannan MT, Kiel DP, Wilson PW, Felson DT. Association of hypogonadism and estradiol levels with bone mineral density in elderly men from the Framingham study. Ann Intern Med 2000; 133:951-963

134.   Khosla S, Melton LJ, 3rd, Atkinson EJ, O'Fallon WM, Klee GG, Riggs BL. Relationship of serum sex steroid levels and bone turnover markers with bone mineral density in men and women: a key role for bioavailable estrogen. J Clin Endocrinol Metab 1998; 83:2266-2274

135.   Center JR, Nguyen TV, Sambrook PN, Eisman JA. Hormonal and biochemical parameters in the determination of osteoporosis in elderly men. J Clin Endocrinol Metab 1999; 84:3626-3635

136.   Mellstrom D, Johnell O, Ljunggren O, Eriksson AL, Lorentzon M, Mallmin H, Holmberg A, Redlund-Johnell I, Orwoll E, Ohlsson C. Free testosterone is an independent predictor of BMD and prevalent fractures in elderly men: MrOS Sweden. J Bone Miner Res 2006; 21:529-535

137.   Shores MM, Moceri VM, Gruenewald DA, Brodkin KI, Matsumoto AM, Kivlahan DR. Low testosterone is associated with decreased function and increased mortality risk: a preliminary study of men in a geriatric rehabilitation unit. J Am Geriatr Soc 2004; 52:2077-2081

138.   Shores MM, Matsumoto AM, Sloan KL, Kivlahan DR. Low serum testosterone and mortality in male veterans. Arch Intern Med 2006; 166:1660-1665

139.   Araujo AB, Kupelian V, Page ST, Handelsman DJ, Bremner WJ, McKinlay JB. Sex steroids and all-cause and cause-specific mortality in men. Arch Intern Med 2007; 167:1252-1260

140.   Laughlin GA, Barrett-Connor E, Bergstrom J. Low serum testosterone and mortality in older men. J Clin Endocrinol Metab 2008; 93:68-75

141.   Yeap BB, Marriott RJ, Antonio L, Chan YX, Raj S, Dwivedi G, Reid CM, Anawalt BD, Bhasin S, Dobs AS, Hankey GJ, Matsumoto AM, Norman PE, O'Neill TW, Ohlsson C, Orwoll ES, Vanderschueren D, Wittert GA, Wu FCW, Murray K. Serum Testosterone is Inversely and Sex Hormone-binding Globulin is Directly Associated with All-cause Mortality in Men. J Clin Endocrinol Metab 2021; 106:e625-e637

142.   Araujo AB, Dixon JM, Suarez EA, Murad MH, Guey LT, Wittert GA. Clinical review: Endogenous testosterone and mortality in men: a systematic review and meta-analysis. J Clin Endocrinol Metab 2011; 96:3007-3019

143.   Corona G, Rastrelli G, Monami M, Guay A, Buvat J, Sforza A, Forti G, Mannucci E, Maggi M. Hypogonadism as a risk factor for cardiovascular mortality in men: a meta-analytic study. Eur J Endocrinol 2011; 165:687-701

144.   Litman HJ, Bhasin S, O'Leary MP, Link CL, McKinlay JB, Investigators BS. An investigation of the relationship between sex-steroid levels and urological symptoms: results from the Boston Area Community Health survey. BJU Int 2007; 100:321-326

145.   Alexandersen P, Haarbo J, Christiansen C. The relationship of natural androgens to coronary heart disease in males: a review. Atherosclerosis 1996; 125:1-13

146.   Barrett-Connor E, Khaw KT. Endogenous sex hormones and cardiovascular disease in men. A prospective population-based study. Circulation 1988; 78:539-545

147.   Cauley JA, Gutai JP, Kuller LH, Dai WS. Usefulness of sex steroid hormone levels in predicting coronary artery disease in men. Am J Cardiol 1987; 60:771-777

148.   Contoreggi CS, Blackman MR, Andres R, Muller DC, Lakatta EG, Fleg JL, Harman SM. Plasma levels of estradiol, testosterone, and DHEAS do not predict risk of coronary artery disease in men. J Androl 1990; 11:460-470

149.   Yarnell JW, Beswick AD, Sweetnam PM, Riad-Fahmy D. Endogenous sex hormones and ischemic heart disease in men. The Caerphilly prospective study. Arterioscler Thromb 1993; 13:517-520

150.   Hak AE, Witteman JC, de Jong FH, Geerlings MI, Hofman A, Pols HA. Low levels of endogenous androgens increase the risk of atherosclerosis in elderly men: the Rotterdam study. J Clin Endocrinol Metab 2002; 87:3632-3639

151.   Bassey EJ, Fiatarone MA, O'Neill EF, Kelly M, Evans WJ, Lipsitz LA. Leg extensor power and functional performance in very old men and women. Clin Sci (Lond) 1992; 82:321-327

152.   Rantanen T, Avela J. Leg extension power and walking speed in very old people living independently. J Gerontol A Biol Sci Med Sci 1997; 52:M225-231

153.   Whipple RH, Wolfson LI, Amerman PM. The relationship of knee and ankle weakness to falls in nursing home residents: an isokinetic study. J Am Geriatr Soc 1987; 35:13-20

154.   Wolfson L, Judge J, Whipple R, King M. Strength is a major factor in balance, gait, and the occurrence of falls. J Gerontol A Biol Sci Med Sci 1995; 50 Spec No:64-67

155.   Bhasin S, Calof OM, Storer TW, Lee ML, Mazer NA, Jasuja R, Montori VM, Gao W, Dalton JT. Drug insight: Testosterone and selective androgen receptor modulators as anabolic therapies for chronic illness and aging. Nat Clin Pract Endocrinol Metab 2006; 2:146-159

156.   Katznelson L, Finkelstein JS, Schoenfeld DA, Rosenthal DI, Anderson EJ, Klibanski A. Increase in bone density and lean body mass during testosterone administration in men with acquired hypogonadism. J Clin Endocrinol Metab 1996; 81:4358-4365

157.   Bhasin S, Storer TW, Berman N, Yarasheski KE, Clevenger B, Phillips J, Lee WP, Bunnell TJ, Casaburi R. Testosterone replacement increases fat-free mass and muscle size in hypogonadal men. J Clin Endocrinol Metab 1997; 82:407-413

158.   Brodsky IG, Balagopal P, Nair KS. Effects of testosterone replacement on muscle mass and muscle protein synthesis in hypogonadal men--a clinical research center study. J Clin Endocrinol Metab 1996; 81:3469-3475

159.   Snyder PJ, Peachey H, Berlin JA, Hannoush P, Haddad G, Dlewati A, Santanna J, Loh L, Lenrow DA, Holmes JH, Kapoor SC, Atkinson LE, Strom BL. Effects of testosterone replacement in hypogonadal men. J Clin Endocrinol Metab 2000; 85:2670-2677

160.   Wang C, Swerdloff RS, Iranmanesh A, Dobs A, Snyder PJ, Cunningham G, Matsumoto AM, Weber T, Berman N, Testosterone Gel Study G. Transdermal testosterone gel improves sexual function, mood, muscle strength, and body composition parameters in hypogonadal men. J Clin Endocrinol Metab 2000; 85:2839-2853

161.   Steidle C, Schwartz S, Jacoby K, Sebree T, Smith T, Bachand R, North American AATGSG. AA2500 testosterone gel normalizes androgen levels in aging males with improvements in body composition and sexual function. J Clin Endocrinol Metab 2003; 88:2673-2681

162.   Bhasin S, Ellenberg SS, Storer TW, Basaria S, Pahor M, Stephens-Shields AJ, Cauley JA, Ensrud KE, Farrar JT, Cella D, Matsumoto AM, Cunningham GR, Swerdloff RS, Wang C, Lewis CE, Molitch ME, Barrett-Connor E, Crandall JP, Hou X, Preston P, Cifelli D, Snyder PJ, Gill TM. Effect of testosterone replacement on measures of mobility in older men with mobility limitation and low testosterone concentrations: secondary analyses of the Testosterone Trials. Lancet Diabetes Endocrinol 2018; 6:879-890

163.   Storer TW, Basaria S, Traustadottir T, Harman SM, Pencina K, Li Z, Travison TG, Miciek R, Tsitouras P, Hally K, Huang G, Bhasin S. Effects of Testosterone Supplementation for 3 Years on Muscle Performance and Physical Function in Older Men. J Clin Endocrinol Metab 2017; 102:583-593

164.   Storer TW, Bhasin S, Travison TG, Pencina K, Miciek R, McKinnon J, Basaria S. Testosterone Attenuates Age-Related Fall in Aerobic Function in Mobility Limited Older Men With Low Testosterone. J Clin Endocrinol Metab 2016; 101:2562-2569

165.   Traustadottir T, Harman SM, Tsitouras P, Pencina KM, Li Z, Travison TG, Eder R, Miciek R, McKinnon J, Woodbury E, Basaria S, Bhasin S, Storer TW. Long-Term Testosterone Supplementation in Older Men Attenuates Age-Related Decline in Aerobic Capacity. J Clin Endocrinol Metab 2018; 103:2861-2869

166.   Bhasin S, Woodhouse L, Casaburi R, Singh AB, Bhasin D, Berman N, Chen X, Yarasheski KE, Magliano L, Dzekov C, Dzekov J, Bross R, Phillips J, Sinha-Hikim I, Shen R, Storer TW. Testosterone dose-response relationships in healthy young men. Am J Physiol Endocrinol Metab 2001; 281:E1172-1181

167.   Storer TW, Magliano L, Woodhouse L, Lee ML, Dzekov C, Dzekov J, Casaburi R, Bhasin S. Testosterone dose-dependently increases maximal voluntary strength and leg power, but does not affect fatigability or specific tension. J Clin Endocrinol Metab 2003; 88:1478-1485

168.   Woodhouse LJ, Reisz-Porszasz S, Javanbakht M, Storer TW, Lee M, Zerounian H, Bhasin S. Development of models to predict anabolic response to testosterone administration in healthy young men. Am J Physiol Endocrinol Metab 2003; 284:E1009-1017

169.   Bhasin S, Storer TW, Berman N, Callegari C, Clevenger B, Phillips J, Bunnell TJ, Tricker R, Shirazi A, Casaburi R. The effects of supraphysiologic doses of testosterone on muscle size and strength in normal men. N Engl J Med 1996; 335:1-7

170.   Blackman MR, Sorkin JD, Munzer T, Bellantoni MF, Busby-Whitehead J, Stevens TE, Jayme J, O'Connor KG, Christmas C, Tobin JD, Stewart KJ, Cottrell E, St Clair C, Pabst KM, Harman SM. Growth hormone and sex steroid administration in healthy aged women and men: a randomized controlled trial. JAMA 2002; 288:2282-2292

171.   Bhasin S, Apovian CM, Travison TG, Pencina K, Moore LL, Huang G, Campbell WW, Li Z, Howland AS, Chen R, Knapp PE, Singer MR, Shah M, Secinaro K, Eder RV, Hally K, Schram H, Bearup R, Beleva YM, McCarthy AC, Woodbury E, McKinnon J, Fleck G, Storer TW, Basaria S. Effect of Protein Intake on Lean Body Mass in Functionally Limited Older Men: A Randomized Clinical Trial. JAMA Intern Med 2018; 178:530-541

172.   Bhasin S, Apovian CM, Travison TG, Pencina K, Huang G, Moore LL, Campbell WW, Howland A, Chen R, Singer MR, Shah M, Eder R, Schram H, Bearup R, Beleva YM, McCarthy AC, Li Z, Woodbury E, McKinnon J, Storer TW, Basaria S. Design of a randomized trial to determine the optimum protein intake to preserve lean body mass and to optimize response to a promyogenic anabolic agent in older men with physical functional limitation. Contemp Clin Trials 2017; 58:86-93

173.   Urban RJ, Bodenburg YH, Gilkison C, Foxworth J, Coggan AR, Wolfe RR, Ferrando A. Testosterone administration to elderly men increases skeletal muscle strength and protein synthesis. Am J Physiol 1995; 269:E820-826

174.   Ferrando AA, Sheffield-Moore M, Yeckel CW, Gilkison C, Jiang J, Achacosa A, Lieberman SA, Tipton K, Wolfe RR, Urban RJ. Testosterone administration to older men improves muscle function: molecular and physiological mechanisms. Am J Physiol Endocrinol Metab 2002; 282:E601-607

175.   Kong A, Edmonds P. Testosterone therapy in HIV wasting syndrome: systematic review and meta-analysis. Lancet Infect Dis 2002; 2:692-699

176.   Johns K, Beddall MJ, Corrin RC. Anabolic steroids for the treatment of weight loss in HIV-infected individuals. Cochrane Database Syst Rev 2005:CD005483

177.   Bhasin S, Storer TW, Javanbakht M, Berman N, Yarasheski KE, Phillips J, Dike M, Sinha-Hikim I, Shen R, Hays RD, Beall G. Testosterone replacement and resistance exercise in HIV-infected men with weight loss and low testosterone levels. JAMA 2000; 283:763-770

178.   Grinspoon S, Corcoran C, Askari H, Schoenfeld D, Wolf L, Burrows B, Walsh M, Hayden D, Parlman K, Anderson E, Basgoz N, Klibanski A. Effects of androgen administration in men with the AIDS wasting syndrome. A randomized, double-blind, placebo-controlled trial. Ann Intern Med 1998; 129:18-26

179.   Storer TW, Woodhouse LJ, Sattler F, Singh AB, Schroeder ET, Beck K, Padero M, Mac P, Yarasheski KE, Geurts P, Willemsen A, Harms MK, Bhasin S. A randomized, placebo-controlled trial of nandrolone decanoate in human immunodeficiency virus-infected men with mild to moderate weight loss with recombinant human growth hormone as active reference treatment. J Clin Endocrinol Metab 2005; 90:4474-4482

180.   Grinspoon S, Corcoran C, Parlman K, Costello M, Rosenthal D, Anderson E, Stanley T, Schoenfeld D, Burrows B, Hayden D, Basgoz N, Klibanski A. Effects of testosterone and progressive resistance training in eugonadal men with AIDS wasting. A randomized, controlled trial. Ann Intern Med 2000; 133:348-355

181.   Bhasin S, Storer TW, Asbel-Sethi N, Kilbourne A, Hays R, Sinha-Hikim I, Shen R, Arver S, Beall G. Effects of testosterone replacement with a nongenital, transdermal system, Androderm, in human immunodeficiency virus-infected men with low testosterone levels. J Clin Endocrinol Metab 1998; 83:3155-3162

182.   Grinspoon S, Corcoran C, Stanley T, Baaj A, Basgoz N, Klibanski A. Effects of hypogonadism and testosterone administration on depression indices in HIV-infected men. J Clin Endocrinol Metab 2000; 85:60-65

183.   Knapp PE, Storer TW, Herbst KL, Singh AB, Dzekov C, Dzekov J, LaValley M, Zhang A, Ulloor J, Bhasin S. Effects of a supraphysiological dose of testosterone on physical function, muscle performance, mood, and fatigue in men with HIV-associated weight loss. Am J Physiol Endocrinol Metab 2008; 294:E1135-1143

184.   Sih R, Morley JE, Kaiser FE, Perry HM, 3rd, Patrick P, Ross C. Testosterone replacement in older hypogonadal men: a 12-month randomized controlled trial. J Clin Endocrinol Metab 1997; 82:1661-1667

185.   Snyder PJ, Peachey H, Hannoush P, Berlin JA, Loh L, Lenrow DA, Holmes JH, Dlewati A, Santanna J, Rosen CJ, Strom BL. Effect of testosterone treatment on body composition and muscle strength in men over 65 years of age. J Clin Endocrinol Metab 1999; 84:2647-2653

186.   Page ST, Amory JK, Bowman FD, Anawalt BD, Matsumoto AM, Bremner WJ, Tenover JL. Exogenous testosterone (T) alone or with finasteride increases physical performance, grip strength, and lean body mass in older men with low serum T. J Clin Endocrinol Metab 2005; 90:1502-1510

187.   Schroeder ET, Singh A, Bhasin S, Storer TW, Azen C, Davidson T, Martinez C, Sinha-Hikim I, Jaque SV, Terk M, Sattler FR. Effects of an oral androgen on muscle and metabolism in older, community-dwelling men. Am J Physiol Endocrinol Metab 2003; 284:E120-128

188.   Kenny AM, Prestwood KM, Gruman CA, Marcello KM, Raisz LG. Effects of transdermal testosterone on bone and muscle in older men with low bioavailable testosterone levels. J Gerontol A Biol Sci Med Sci 2001; 56:M266-272

189.   Nair KS, Rizza RA, O'Brien P, Dhatariya K, Short KR, Nehra A, Vittone JL, Klee GG, Basu A, Basu R, Cobelli C, Toffolo G, Dalla Man C, Tindall DJ, Melton LJ, 3rd, Smith GE, Khosla S, Jensen MD. DHEA in elderly women and DHEA or testosterone in elderly men. N Engl J Med 2006; 355:1647-1659

190.   Travison TG, Basaria S, Storer TW, Jette AM, Miciek R, Farwell WR, Choong K, Lakshman K, Mazer NA, Coviello AD, Knapp PE, Ulloor J, Zhang A, Brooks B, Nguyen AH, Eder R, LeBrasseur N, Elmi A, Appleman E, Hede-Brierley L, Bhasin G, Bhatia A, Lazzari A, Davis S, Ni P, Collins L, Bhasin S. Clinical meaningfulness of the changes in muscle performance and physical function associated with testosterone administration in older men with mobility limitation. J Gerontol A Biol Sci Med Sci 2011; 66:1090-1099

191.   Kenny AM, Kleppinger A, Annis K, Rathier M, Browner B, Judge JO, McGee D. Effects of transdermal testosterone on bone and muscle in older men with low bioavailable testosterone levels, low bone mass, and physical frailty. J Am Geriatr Soc 2010; 58:1134-1143

192.   Snyder PJ, Ellenberg SS, Cunningham GR, Matsumoto AM, Bhasin S, Barrett-Connor E, Gill TM, Farrar JT, Cella D, Rosen RC, Resnick SM, Swerdloff RS, Cauley JA, Cifelli D, Fluharty L, Pahor M, Ensrud KE, Lewis CE, Molitch ME, Crandall JP, Wang C, Budoff MJ, Wenger NK, Mohler ERR, Bild DE, Cook NL, Keaveny TM, Kopperdahl DL, Lee D, Schwartz AV, Storer TW, Ershler WB, Roy CN, Raffel LJ, Romashkan S, Hadley E. The Testosterone Trials: Seven coordinated trials of testosterone treatment in elderly men. Clin Trials 2014; 11:362-375

193.   de Labra C, Guimaraes-Pinheiro C, Maseda A, Lorenzo T, Millan-Calenti JC. Effects of physical exercise interventions in frail older adults: a systematic review of randomized controlled trials. BMC Geriatr 2015; 15:154

194.   Cuthbertson D, Smith K, Babraj J, Leese G, Waddell T, Atherton P, Wackerhage H, Taylor PM, Rennie MJ. Anabolic signaling deficits underlie amino acid resistance of wasting, aging muscle. FASEB J 2005; 19:422-424

195.   Houston DK, Nicklas BJ, Ding J, Harris TB, Tylavsky FA, Newman AB, Lee JS, Sahyoun NR, Visser M, Kritchevsky SB, Health ABCS. Dietary protein intake is associated with lean mass change in older, community-dwelling adults: the Health, Aging, and Body Composition (Health ABC) Study. Am J Clin Nutr 2008; 87:150-155

196.   Huang G, Pencina K, Li Z, Apovian CM, Travison TG, Storer TW, Gagliano-Juca T, Basaria S, Bhasin S. Effect of Protein Intake on Visceral Abdominal Fat and Metabolic Biomarkers in Older Men With Functional Limitations: Results From a Randomized Clinical Trial. J Gerontol A Biol Sci Med Sci 2021; 76:1084-1089

197.   Sinha-Hikim I, Artaza J, Woodhouse L, Gonzalez-Cadavid N, Singh AB, Lee MI, Storer TW, Casaburi R, Shen R, Bhasin S. Testosterone-induced increase in muscle size in healthy young men is associated with muscle fiber hypertrophy. Am J Physiol Endocrinol Metab 2002; 283:E154-164

198.   Sinha-Hikim I, Roth SM, Lee MI, Bhasin S. Testosterone-induced muscle hypertrophy is associated with an increase in satellite cell number in healthy, young men. Am J Physiol Endocrinol Metab 2003; 285:E197-205

199.   Bhasin S, Taylor WE, Singh R, Artaza J, Sinha-Hikim I, Jasuja R, Choi H, Gonzalez-Cadavid NF. The mechanisms of androgen effects on body composition: mesenchymal pluripotent cell as the target of androgen action. J Gerontol A Biol Sci Med Sci 2003; 58:M1103-1110

200.   Singh R, Artaza JN, Taylor WE, Gonzalez-Cadavid NF, Bhasin S. Androgens stimulate myogenic differentiation and inhibit adipogenesis in C3H 10T1/2 pluripotent cells through an androgen receptor-mediated pathway. Endocrinology 2003; 144:5081-5088

201.   Gupta V, Bhasin S, Guo W, Singh R, Miki R, Chauhan P, Choong K, Tchkonia T, Lebrasseur NK, Flanagan JN, Hamilton JA, Viereck JC, Narula NS, Kirkland JL, Jasuja R. Effects of dihydrotestosterone on differentiation and proliferation of human mesenchymal stem cells and preadipocytes. Mol Cell Endocrinol 2008; 296:32-40

202.   Singh R, Artaza JN, Taylor WE, Braga M, Yuan X, Gonzalez-Cadavid NF, Bhasin S. Testosterone inhibits adipogenic differentiation in 3T3-L1 cells: nuclear translocation of androgen receptor complex with beta-catenin and T-cell factor 4 may bypass canonical Wnt signaling to down-regulate adipogenic transcription factors. Endocrinology 2006; 147:141-154

203.   Singh R, Bhasin S, Braga M, Artaza JN, Pervin S, Taylor WE, Krishnan V, Sinha SK, Rajavashisth TB, Jasuja R. Regulation of myogenic differentiation by androgens: cross talk between androgen receptor/ beta-catenin and follistatin/transforming growth factor-beta signaling pathways. Endocrinology 2009; 150:1259-1268

204.   Jasuja R, Costello JC, Singh R, Gupta V, Spina CS, Toraldo G, Jang H, Li H, Serra C, Guo W, Chauhan P, Narula NS, Guarneri T, Ergun A, Travison TG, Collins JJ, Bhasin S. Combined administration of testosterone plus an ornithine decarboxylase inhibitor as a selective prostate-sparing anabolic therapy. Aging Cell 2014; 13:303-310

205.   Bartsch W, Krieg M, Voigt KD. Quantification of endogenous testosterone, 5 alpha-dihydrotestosterone and 5 alpha-androstane-3 alpha, 17 beta-diol in subcellular fractions of the prostate, bulbocavernosus/levator ani muscle, skeletal muscle and heart muscle of the rat. J Steroid Biochem 1980; 13:259-264

206.   Wilson JD. The role of 5alpha-reduction in steroid hormone physiology. Reprod Fertil Dev 2001; 13:673-678

207.   Andriole GL, Kirby R. Safety and tolerability of the dual 5alpha-reductase inhibitor dutasteride in the treatment of benign prostatic hyperplasia. Eur Urol 2003; 44:82-88

208.   Bhasin S, Travison TG, Storer TW, Lakshman K, Kaushik M, Mazer NA, Ngyuen AH, Davda MN, Jara H, Aakil A, Anderson S, Knapp PE, Hanka S, Mohammed N, Daou P, Miciek R, Ulloor J, Zhang A, Brooks B, Orwoll K, Hede-Brierley L, Eder R, Elmi A, Bhasin G, Collins L, Singh R, Basaria S. Effect of testosterone supplementation with and without a dual 5alpha-reductase inhibitor on fat-free mass in men with suppressed testosterone production: a randomized controlled trial. JAMA 2012; 307:931-939

209.   Borst SE, Conover CF, Carter CS, Gregory CM, Marzetti E, Leeuwenburgh C, Vandenborne K, Wronski TJ. Anabolic effects of testosterone are preserved during inhibition of 5alpha-reductase. Am J Physiol Endocrinol Metab 2007; 293:E507-514

210.   Matsumoto AM, Tenover L, McClung M, Mobley D, Geller J, Sullivan M, Grayhack J, Wessells H, Kadmon D, Flanagan M, Zhang GK, Schmidt J, Taylor AM, Lee M, Waldstreicher J, Pless Study G. The long-term effect of specific type II 5alpha-reductase inhibition with finasteride on bone mineral density in men: results of a 4-year placebo controlled trial. J Urol 2002; 167:2105-2108

211.   Amory JK, Anawalt BD, Matsumoto AM, Page ST, Bremner WJ, Wang C, Swerdloff RS, Clark RV. The effect of 5alpha-reductase inhibition with dutasteride and finasteride on bone mineral density, serum lipoproteins, hemoglobin, prostate specific antigen and sexual function in healthy young men. J Urol 2008; 179:2333-2338

212.   Agis-Balboa RC, Pinna G, Zhubi A, Maloku E, Veldic M, Costa E, Guidotti A. Characterization of brain neurons that express enzymes mediating neurosteroid biosynthesis. Proc Natl Acad Sci U S A 2006; 103:14602-14607

213.   Agis-Balboa RC, Guidotti A, Pinna G. 5alpha-reductase type I expression is downregulated in the prefrontal cortex/Brodmann's area 9 (BA9) of depressed patients. Psychopharmacology (Berl) 2014; 231:3569-3580

214.   Rasmusson AM, King MW, Valovski I, Gregor K, Scioli-Salter E, Pineles SL, Hamouda M, Nillni YI, Anderson GM, Pinna G. Relationships between cerebrospinal fluid GABAergic neurosteroid levels and symptom severity in men with PTSD. Psychoneuroendocrinology 2019; 102:95-104

215.   Stoffel-Wagner B. Neurosteroid metabolism in the human brain. Eur J Endocrinol 2001; 145:669-679

216.   Kanes S, Colquhoun H, Gunduz-Bruce H, Raines S, Arnold R, Schacterle A, Doherty J, Epperson CN, Deligiannidis KM, Riesenberg R, Hoffmann E, Rubinow D, Jonas J, Paul S, Meltzer-Brody S. Brexanolone (SAGE-547 injection) in post-partum depression: a randomised controlled trial. Lancet 2017; 390:480-489

217.   Frieder A, Fersh M, Hainline R, Deligiannidis KM. Pharmacotherapy of Postpartum Depression: Current Approaches and Novel Drug Development. CNS Drugs 2019; 33:265-282

218.   Nasiri M, Nikolaou N, Parajes S, Krone NP, Valsamakis G, Mastorakos G, Hughes B, Taylor A, Bujalska IJ, Gathercole LL, Tomlinson JW. 5alpha-Reductase Type 2 Regulates Glucocorticoid Action and Metabolic Phenotype in Human Hepatocytes. Endocrinology 2015; 156:2863-2871

219.   Jones ME, Thorburn AW, Britt KL, Hewitt KN, Wreford NG, Proietto J, Oz OK, Leury BJ, Robertson KM, Yao S, Simpson ER. Aromatase-deficient (ArKO) mice have a phenotype of increased adiposity. Proc Natl Acad Sci U S A 2000; 97:12735-12740

220.   Carani C, Qin K, Simoni M, Faustini-Fustini M, Serpente S, Boyd J, Korach KS, Simpson ER. Effect of testosterone and estradiol in a man with aromatase deficiency. N Engl J Med 1997; 337:91-95

221.   Finkelstein JS, Lee H, Burnett-Bowie SA, Pallais JC, Yu EW, Borges LF, Jones BF, Barry CV, Wulczyn KE, Thomas BJ, Leder BZ. Gonadal steroids and body composition, strength, and sexual function in men. N Engl J Med 2013; 369:1011-1022

222.   Mauras N, Hayes V, Welch S, Rini A, Helgeson K, Dokler M, Veldhuis JD, Urban RJ. Testosterone deficiency in young men: marked alterations in whole body protein kinetics, strength, and adiposity. J Clin Endocrinol Metab 1998; 83:1886-1892

223.   Woodhouse LJ, Gupta N, Bhasin M, Singh AB, Ross R, Phillips J, Bhasin S. Dose-dependent effects of testosterone on regional adipose tissue distribution in healthy young men. J Clin Endocrinol Metab 2004; 89:718-726

224.   Wang C, Cunningham G, Dobs A, Iranmanesh A, Matsumoto AM, Snyder PJ, Weber T, Berman N, Hull L, Swerdloff RS. Long-term testosterone gel (AndroGel) treatment maintains beneficial effects on sexual function and mood, lean and fat mass, and bone mineral density in hypogonadal men. J Clin Endocrinol Metab 2004; 89:2085-2098

225.   Maffei L, Murata Y, Rochira V, Tubert G, Aranda C, Vazquez M, Clyne CD, Davis S, Simpson ER, Carani C. Dysmetabolic syndrome in a man with a novel mutation of the aromatase gene: effects of testosterone, alendronate, and estradiol treatment. J Clin Endocrinol Metab 2004; 89:61-70

226.   Maffei L, Rochira V, Zirilli L, Antunez P, Aranda C, Fabre B, Simone ML, Pignatti E, Simpson ER, Houssami S, Clyne CD, Carani C. A novel compound heterozygous mutation of the aromatase gene in an adult man: reinforced evidence on the relationship between congenital oestrogen deficiency, adiposity and the metabolic syndrome. Clin Endocrinol (Oxf) 2007; 67:218-224

227.   Morishima A, Grumbach MM, Simpson ER, Fisher C, Qin K. Aromatase deficiency in male and female siblings caused by a novel mutation and the physiological role of estrogens. J Clin Endocrinol Metab 1995; 80:3689-3698

228.   Hewitt KN, Pratis K, Jones ME, Simpson ER. Estrogen replacement reverses the hepatic steatosis phenotype in the male aromatase knockout mouse. Endocrinology 2004; 145:1842-1848

229.   Chazenbalk G, Singh P, Irge D, Shah A, Abbott DH, Dumesic DA. Androgens inhibit adipogenesis during human adipose stem cell commitment to preadipocyte formation. Steroids 2013; 78:920-926

230.   Host C, Gormsen LC, Christensen B, Jessen N, Hougaard DM, Christiansen JS, Pedersen SB, Jensen MD, Nielsen S, Gravholt CH. Independent effects of testosterone on lipid oxidation and VLDL-TG production: a randomized, double-blind, placebo-controlled, crossover study. Diabetes 2013; 62:1409-1416

231.   Xu Y, Nedungadi TP, Zhu L, Sobhani N, Irani BG, Davis KE, Zhang X, Zou F, Gent LM, Hahner LD, Khan SA, Elias CF, Elmquist JK, Clegg DJ. Distinct hypothalamic neurons mediate estrogenic effects on energy homeostasis and reproduction. Cell Metab 2011; 14:453-465

232.   Ponnusamy S, Tran QT, Thiyagarajan T, Miller DD, Bridges D, Narayanan R. An estrogen receptor beta-selective agonist inhibits non-alcoholic steatohepatitis in preclinical models by regulating bile acid and xenobiotic receptors. Exp Biol Med (Maywood) 2017; 242:606-616

233.   Bhasin S, Enzlin P, Coviello A, Basson R. Sexual dysfunction in men and women with endocrine disorders. Lancet 2007; 369:597-611

234.   Arver S, Dobs AS, Meikle AW, Allen RP, Sanders SW, Mazer NA. Improvement of sexual function in testosterone deficient men treated for 1 year with a permeation enhanced testosterone transdermal system. J Urol 1996; 155:1604-1608

235.   Bancroft J, Wu FC. Changes in erectile responsiveness during androgen replacement therapy. Arch Sex Behav 1983; 12:59-66

236.   Davidson JM, Camargo CA, Smith ER. Effects of androgen on sexual behavior in hypogonadal men. J Clin Endocrinol Metab 1979; 48:955-958

237.   Kwan M, Greenleaf WJ, Mann J, Crapo L, Davidson JM. The nature of androgen action on male sexuality: a combined laboratory-self-report study on hypogonadal men. J Clin Endocrinol Metab 1983; 57:557-562

238.   Bagatell CJ, Heiman JR, Rivier JE, Bremner WJ. Effects of endogenous testosterone and estradiol on sexual behavior in normal young men. J Clin Endocrinol Metab 1994; 78:711-716

239.   Carani C, Granata AR, Bancroft J, Marrama P. The effects of testosterone replacement on nocturnal penile tumescence and rigidity and erectile response to visual erotic stimuli in hypogonadal men. Psychoneuroendocrinology 1995; 20:743-753

240.   Cunningham GR, Hirshkowitz M, Korenman SG, Karacan I. Testosterone replacement therapy and sleep-related erections in hypogonadal men. J Clin Endocrinol Metab 1990; 70:792-797

241.   Carani C, Bancroft J, Granata A, Del Rio G, Marrama P. Testosterone and erectile function, nocturnal penile tumescence and rigidity, and erectile response to visual erotic stimuli in hypogonadal and eugonadal men. Psychoneuroendocrinology 1992; 17:647-654

242.   Lugg J, Ng C, Rajfer J, Gonzalez-Cadavid N. Cavernosal nerve stimulation in the rat reverses castration-induced decrease in penile NOS activity. Am J Physiol 1996; 271:E354-361

243.   Shabsigh R. The effects of testosterone on the cavernous tissue and erectile function. World J Urol 1997; 15:21-26

244.   Mills TM, Lewis RW, Stopper VS. Androgenic maintenance of inflow and veno-occlusion during erection in the rat. Biol Reprod 1998; 59:1413-1418

245.   Mills TM, Dai Y, Stopper VS, Lewis RW. Androgenic maintenance of the erectile response in the rat. Steroids 1999; 64:605-609

246.   Bhasin S, Fielder T, Peacock N, Sod-Moriah UA, Swerdloff RS. Dissociating antifertility effects of GnRH-antagonist from its adverse effects on mating behavior in male rats. Am J Physiol 1988; 254:E84-91

247.   Fielder TJ, Peacock NR, McGivern RF, Swerdloff RS, Bhasin S. Testosterone dose-dependency of sexual and nonsexual behaviors in the gonadotropin-releasing hormone antagonist-treated male rat. J Androl 1989; 10:167-173

248.   Buena F, Swerdloff RS, Steiner BS, Lutchmansingh P, Peterson MA, Pandian MR, Galmarini M, Bhasin S. Sexual function does not change when serum testosterone levels are pharmacologically varied within the normal male range. Fertil Steril 1993; 59:1118-1123

249.   Morley JE, Korenman SG, Mooradian AD, Kaiser FE. Sexual dysfunction in the elderly male. J Am Geriatr Soc 1987; 35:1014-1022

250.   Buvat J, Lemaire A. Endocrine screening in 1,022 men with erectile dysfunction: clinical significance and cost-effective strategy. J Urol 1997; 158:1764-1767

251.   Citron JT, Ettinger B, Rubinoff H, Ettinger VM, Minkoff J, Hom F, Kan P, Alloo R. Prevalence of hypothalamic-pituitary imaging abnormalities in impotent men with secondary hypogonadism. J Urol 1996; 155:529-533

252.   Burris AS, Banks SM, Carter CS, Davidson JM, Sherins RJ. A long-term, prospective study of the physiologic and behavioral effects of hormone replacement in untreated hypogonadal men. J Androl 1992; 13:297-304

253.   Cunningham GR, Toma SM. Clinical review: Why is androgen replacement in males controversial? J Clin Endocrinol Metab 2011; 96:38-52

254.   Allan CA, Forbes EA, Strauss BJ, McLachlan RI. Testosterone therapy increases sexual desire in ageing men with low-normal testosterone levels and symptoms of androgen deficiency. Int J Impot Res 2008; 20:396-401

255.   Cavallini G, Caracciolo S, Vitali G, Modenini F, Biagiotti G. Carnitine versus androgen administration in the treatment of sexual dysfunction, depressed mood, and fatigue associated with male aging. Urology 2004; 63:641-646

256.   Ponce OJ, Spencer-Bonilla G, Alvarez-Villalobos N, Serrano V, Singh-Ospina N, Rodriguez-Gutierrez R, Salcido-Montenegro A, Benkhadra R, Prokop LJ, Bhasin S, Brito JP. The efficacy and adverse events of testosterone replacement therapy in hypogonadal men: A systematic review and meta-analysis of randomized, placebo-controlled trials. J Clin Endocrinol Metab 2018;

257.   Cunningham GR, Stephens-Shields AJ, Rosen RC, Wang C, Bhasin S, Matsumoto AM, Parsons JK, Gill TM, Molitch ME, Farrar JT, Cella D, Barrett-Connor E, Cauley JA, Cifelli D, Crandall JP, Ensrud KE, Gallagher L, Zeldow B, Lewis CE, Pahor M, Swerdloff RS, Hou X, Anton S, Basaria S, Diem SJ, Tabatabaie V, Ellenberg SS, Snyder PJ. Testosterone Treatment and Sexual Function in Older Men With Low Testosterone Levels. J Clin Endocrinol Metab 2016; 101:3096-3104

258.   Muller A, Smith L, Parker M, Mulhall JP. Analysis of the efficacy and safety of sildenafil citrate in the geriatric population. BJU Int 2007; 100:117-121

259.   Paduch DA, Polzer PK, Ni X, Basaria S. Testosterone Replacement in Androgen-Deficient Men With Ejaculatory Dysfunction: A Randomized Controlled Trial. J Clin Endocrinol Metab 2015; 100:2956-2962

260.   Shabsigh R, Kaufman JM, Steidle C, Padma-Nathan H. Randomized study of testosterone gel as adjunctive therapy to sildenafil in hypogonadal men with erectile dysfunction who do not respond to sildenafil alone. J Urol 2004; 172:658-663

261.   Aversa A, Isidori AM, Spera G, Lenzi A, Fabbri A. Androgens improve cavernous vasodilation and response to sildenafil in patients with erectile dysfunction. Clin Endocrinol (Oxf) 2003; 58:632-638

262.   Buvat J, Montorsi F, Maggi M, Porst H, Kaipia A, Colson MH, Cuzin B, Moncada I, Martin-Morales A, Yassin A, Meuleman E, Eardley I, Dean JD, Shabsigh R. Hypogonadal men nonresponders to the PDE5 inhibitor tadalafil benefit from normalization of testosterone levels with a 1% hydroalcoholic testosterone gel in the treatment of erectile dysfunction (TADTEST study). J Sex Med 2011; 8:284-293

263.   Spitzer M, Basaria S, Travison TG, Davda MN, Paley A, Cohen B, Mazer NA, Knapp PE, Hanka S, Lakshman KM, Ulloor J, Zhang A, Orwoll K, Eder R, Collins L, Mohammed N, Rosen RC, DeRogatis L, Bhasin S. Effect of testosterone replacement on response to sildenafil citrate in men with erectile dysfunction: a parallel, randomized trial. Ann Intern Med 2012; 157:681-691

264.   Stepan JJ, Lachman M, Zverina J, Pacovsky V, Baylink DJ. Castrated men exhibit bone loss: effect of calcitonin treatment on biochemical indices of bone remodeling. J Clin Endocrinol Metab 1989; 69:523-527

265.   Goldray D, Weisman Y, Jaccard N, Merdler C, Chen J, Matzkin H. Decreased bone density in elderly men treated with the gonadotropin-releasing hormone agonist decapeptyl (D-Trp6-GnRH). J Clin Endocrinol Metab 1993; 76:288-290

266.   Daniell HW. Osteoporosis after orchiectomy for prostate cancer. J Urol 1997; 157:439-444

267.   Eriksson S, Eriksson A, Stege R, Carlstrom K. Bone mineral density in patients with prostatic cancer treated with orchidectomy and with estrogens. Calcif Tissue Int 1995; 57:97-99

268.   Smith MR, Lee WC, Brandman J, Wang Q, Botteman M, Pashos CL. Gonadotropin-releasing hormone agonists and fracture risk: a claims-based cohort study of men with nonmetastatic prostate cancer. J Clin Oncol 2005; 23:7897-7903

269.   Lopez AM, Pena MA, Hernandez R, Val F, Martin B, Riancho JA. Fracture risk in patients with prostate cancer on androgen deprivation therapy. Osteoporos Int 2005; 16:707-711

270.   Shahinian VB, Kuo YF, Freeman JL, Goodwin JS. Risk of fracture after androgen deprivation for prostate cancer. N Engl J Med 2005; 352:154-164

271.   Vanderschueren D, Van Herck E, Schot P, Rush E, Einhorn T, Geusens P, Bouillon R. The aged male rat as a model for human osteoporosis: evaluation by nondestructive measurements and biomechanical testing. Calcif Tissue Int 1993; 53:342-347

272.   Finkelstein JS, Klibanski A, Neer RM, Greenspan SL, Rosenthal DI, Crowley WF, Jr. Osteoporosis in men with idiopathic hypogonadotropic hypogonadism. Ann Intern Med 1987; 106:354-361

273.   Bonjour JP, Theintz G, Buchs B, Slosman D, Rizzoli R. Critical years and stages of puberty for spinal and femoral bone mass accumulation during adolescence. J Clin Endocrinol Metab 1991; 73:555-563

274.   Bird RJ, Hurren BJ. Anatomical and clinical aspects of Klinefelter's syndrome. Clin Anat 2016; 29:606-619

275.   Schoenau E, Neu CM, Mokov E, Wassmer G, Manz F. Influence of puberty on muscle area and cortical bone area of the forearm in boys and girls. J Clin Endocrinol Metab 2000; 85:1095-1098

276.   Finkelstein JS, Neer RM, Biller BM, Crawford JD, Klibanski A. Osteopenia in men with a history of delayed puberty. N Engl J Med 1992; 326:600-604

277.   Finkelstein JS, Klibanski A, Neer RM. A longitudinal evaluation of bone mineral density in adult men with histories of delayed puberty. J Clin Endocrinol Metab 1996; 81:1152-1155

278.   Seeman E, Duan Y, Fong C, Edmonds J. Fracture site-specific deficits in bone size and volumetric density in men with spine or hip fractures. J Bone Miner Res 2001; 16:120-127

279.   Behre HM, Kliesch S, Leifke E, Link TM, Nieschlag E. Long-term effect of testosterone therapy on bone mineral density in hypogonadal men. J Clin Endocrinol Metab 1997; 82:2386-2390

280.   Leifke E, Korner HC, Link TM, Behre HM, Peters PE, Nieschlag E. Effects of testosterone replacement therapy on cortical and trabecular bone mineral density, vertebral body area and paraspinal muscle area in hypogonadal men. Eur J Endocrinol 1998; 138:51-58

281.   Guo CY, Jones TH, Eastell R. Treatment of isolated hypogonadotropic hypogonadism effect on bone mineral density and bone turnover. J Clin Endocrinol Metab 1997; 82:658-665

282.   Aminorroaya A, Kelleher S, Conway AJ, Ly LP, Handelsman DJ. Adequacy of androgen replacement influences bone density response to testosterone in androgen-deficient men. Eur J Endocrinol 2005; 152:881-886

283.   Wang C, Swerdloff RS, Iranmanesh A, Dobs A, Snyder PJ, Cunningham G, Matsumoto AM, Weber T, Berman N. Effects of transdermal testosterone gel on bone turnover markers and bone mineral density in hypogonadal men. Clin Endocrinol (Oxf) 2001; 54:739-750

284.   Boonen S, Vanderschueren D, Geusens P, Bouillon R. Age-associated endocrine deficiencies as potential determinants of femoral neck (type II) osteoporotic fracture occurrence in elderly men. Int J Androl 1997; 20:134-143

285.   Khosla S, Melton LJ, 3rd, Robb RA, Camp JJ, Atkinson EJ, Oberg AL, Rouleau PA, Riggs BL. Relationship of volumetric BMD and structural parameters at different skeletal sites to sex steroid levels in men. J Bone Miner Res 2005; 20:730-740

286.   Stanley HL, Schmitt BP, Poses RM, Deiss WP. Does hypogonadism contribute to the occurrence of a minimal trauma hip fracture in elderly men? J Am Geriatr Soc 1991; 39:766-771

287.   LeBlanc ES, Nielson CM, Marshall LM, Lapidus JA, Barrett-Connor E, Ensrud KE, Hoffman AR, Laughlin G, Ohlsson C, Orwoll ES, Osteoporotic Fractures in Men Study G. The effects of serum testosterone, estradiol, and sex hormone binding globulin levels on fracture risk in older men. J Clin Endocrinol Metab 2009; 94:3337-3346

288.   Yeap BB, Alfonso H, Chubb SAP, Center JR, Beilin J, Hankey GJ, Almeida OP, Golledge J, Norman PE, Flicker L. U-Shaped Association of Plasma Testosterone, and no Association of Plasma Estradiol, with Incidence of Fractures in Men. J Clin Endocrinol Metab 2020; 105

289.   Ilangovan R, Sittadjody S, Balaganesh M, Sivakumar R, Ravi Sankar B, Balasubramanian K, Srinivasan S, Subramanian C, Thompson DM, Queimado L, Srinivasan N. Dihydrotestosterone is a determinant of calcaneal bone mineral density in men. J Steroid Biochem Mol Biol 2009; 117:132-138

290.   Rosenberg EA, Buzkova P, Fink HA, Robbins JA, Shores MM, Matsumoto AM, Mukamal KJ. Testosterone, dihydrotestosterone, bone density, and hip fracture risk among older men: The Cardiovascular Health Study. Metabolism 2021; 114:154399

291.   Eriksson AL, Perry JRB, Coviello AD, Delgado GE, Ferrucci L, Hoffman AR, Huhtaniemi IT, Ikram MA, Karlsson MK, Kleber ME, Laughlin GA, Liu Y, Lorentzon M, Lunetta KL, Mellstrom D, Murabito JM, Murray A, Nethander M, Nielson CM, Prokopenko I, Pye SR, Raffel LJ, Rivadeneira F, Srikanth P, Stolk L, Teumer A, Travison TG, Uitterlinden AG, Vaidya D, Vanderschueren D, Zmuda JM, Marz W, Orwoll ES, Ouyang P, Vandenput L, Wu FCW, de Jong FH, Bhasin S, Kiel DP, Ohlsson C. Genetic Determinants of Circulating Estrogen Levels and Evidence of a Causal Effect of Estradiol on Bone Density in Men. J Clin Endocrinol Metab 2018; 103:991-1004

292.   Nethander M, Vandenput L, Eriksson AL, Windahl S, Funck-Brentano T, Ohlsson C. Evidence of a Causal Effect of Estradiol on Fracture Risk in Men. J Clin Endocrinol Metab 2019; 104:433-442

293.   Amory JK, Watts NB, Easley KA, Sutton PR, Anawalt BD, Matsumoto AM, Bremner WJ, Tenover JL. Exogenous testosterone or testosterone with finasteride increases bone mineral density in older men with low serum testosterone. J Clin Endocrinol Metab 2004; 89:503-510

294.   Snyder PJ, Peachey H, Hannoush P, Berlin JA, Loh L, Holmes JH, Dlewati A, Staley J, Santanna J, Kapoor SC, Attie MF, Haddad JG, Jr., Strom BL. Effect of testosterone treatment on bone mineral density in men over 65 years of age. J Clin Endocrinol Metab 1999; 84:1966-1972

295.   Tracz MJ, Sideras K, Bolona ER, Haddad RM, Kennedy CC, Uraga MV, Caples SM, Erwin PJ, Montori VM. Testosterone use in men and its effects on bone health. A systematic review and meta-analysis of randomized placebo-controlled trials. J Clin Endocrinol Metab 2006; 91:2011-2016

296.   Snyder PJ, Kopperdahl DL, Stephens-Shields AJ, Ellenberg SS, Cauley JA, Ensrud KE, Lewis CE, Barrett-Connor E, Schwartz AV, Lee DC, Bhasin S, Cunningham GR, Gill TM, Matsumoto AM, Swerdloff RS, Basaria S, Diem SJ, Wang C, Hou X, Cifelli D, Dougar D, Zeldow B, Bauer DC, Keaveny TM. Effect of Testosterone Treatment on Volumetric Bone Density and Strength in Older Men With Low Testosterone: A Controlled Clinical Trial. JAMA Intern Med 2017; 177:471-479

297.   Ng Tang Fui M, Hoermann R, Bracken K, Handelsman DJ, Inder WJ, Stuckey BGA, Yeap BB, Ghasem-Zadeh A, McLachlan R, Robledo KP, Jesudason D, Zajac JD, Wittert GA, Grossmann M. Effect of Testosterone treatment on bone microarchitecture and bone mineral density in men: a two-year RCT. J Clin Endocrinol Metab 2021;

298.   Anderson FH, Francis RM, Peaston RT, Wastell HJ. Androgen supplementation in eugonadal men with osteoporosis: effects of six months' treatment on markers of bone formation and resorption. J Bone Miner Res 1997; 12:472-478

299.   Leder BZ, LeBlanc KM, Schoenfeld DA, Eastell R, Finkelstein JS. Differential effects of androgens and estrogens on bone turnover in normal men. J Clin Endocrinol Metab 2003; 88:204-210

300.   Falahati-Nini A, Riggs BL, Atkinson EJ, O'Fallon WM, Eastell R, Khosla S. Relative contributions of testosterone and estrogen in regulating bone resorption and formation in normal elderly men. J Clin Invest 2000; 106:1553-1560

301.   Riggs BL, Khosla S, Melton LJ, 3rd. Sex steroids and the construction and conservation of the adult skeleton. Endocr Rev 2002; 23:279-302

302.   Sims NA, Clement-Lacroix P, Minet D, Fraslon-Vanhulle C, Gaillard-Kelly M, Resche-Rigon M, Baron R. A functional androgen receptor is not sufficient to allow estradiol to protect bone after gonadectomy in estradiol receptor-deficient mice. J Clin Invest 2003; 111:1319-1327

303.   Syed FA, Modder UI, Fraser DG, Spelsberg TC, Rosen CJ, Krust A, Chambon P, Jameson JL, Khosla S. Skeletal effects of estrogen are mediated by opposing actions of classical and nonclassical estrogen receptor pathways. J Bone Miner Res 2005; 20:1992-2001

304.   Vidal O, Lindberg MK, Hollberg K, Baylink DJ, Andersson G, Lubahn DB, Mohan S, Gustafsson JA, Ohlsson C. Estrogen receptor specificity in the regulation of skeletal growth and maturation in male mice. Proc Natl Acad Sci U S A 2000; 97:5474-5479

305.   Lindberg MK, Alatalo SL, Halleen JM, Mohan S, Gustafsson JA, Ohlsson C. Estrogen receptor specificity in the regulation of the skeleton in female mice. J Endocrinol 2001; 171:229-236

306.   Vandenput L, Ederveen AG, Erben RG, Stahr K, Swinnen JV, Van Herck E, Verstuyf A, Boonen S, Bouillon R, Vanderschueren D. Testosterone prevents orchidectomy-induced bone loss in estrogen receptor-alpha knockout mice. Biochem Biophys Res Commun 2001; 285:70-76

307.   Vandenput L, Swinnen JV, Boonen S, Van Herck E, Erben RG, Bouillon R, Vanderschueren D. Role of the androgen receptor in skeletal homeostasis: the androgen-resistant testicular feminized male mouse model. J Bone Miner Res 2004; 19:1462-1470

308.   Venken K, De Gendt K, Boonen S, Ophoff J, Bouillon R, Swinnen JV, Verhoeven G, Vanderschueren D. Relative impact of androgen and estrogen receptor activation in the effects of androgens on trabecular and cortical bone in growing male mice: a study in the androgen receptor knockout mouse model. J Bone Miner Res 2006; 21:576-585

309.   Ren J, Wang XH, Wang GC, Wu JH. 17beta estradiol regulation of connexin 43-based gap junction and mechanosensitivity through classical estrogen receptor pathway in osteocyte-like MLO-Y4 cells. Bone 2013; 53:587-596

310.   Dias JP, Melvin D, Simonsick EM, Carlson O, Shardell MD, Ferrucci L, Chia CW, Basaria S, Egan JM. Effects of aromatase inhibition vs. testosterone in older men with low testosterone: randomized-controlled trial. Andrology 2016; 4:33-40

311.   Finkelstein JS, Lee H, Leder BZ, Burnett-Bowie SA, Goldstein DW, Hahn CW, Hirsch SC, Linker A, Perros N, Servais AB, Taylor AP, Webb ML, Youngner JM, Yu EW. Gonadal steroid-dependent effects on bone turnover and bone mineral density in men. J Clin Invest 2016; 126:1114-1125

312.   Huber DM, Bendixen AC, Pathrose P, Srivastava S, Dienger KM, Shevde NK, Pike JW. Androgens suppress osteoclast formation induced by RANKL and macrophage-colony stimulating factor. Endocrinology 2001; 142:3800-3808

313.   Colvard DS, Eriksen EF, Keeting PE, Wilson EM, Lubahn DB, French FS, Riggs BL, Spelsberg TC. Identification of androgen receptors in normal human osteoblast-like cells. Proc Natl Acad Sci U S A 1989; 86:854-857

314.   Kasperk CH, Wergedal JE, Farley JR, Linkhart TA, Turner RT, Baylink DJ. Androgens directly stimulate proliferation of bone cells in vitro. Endocrinology 1989; 124:1576-1578

315.   Lapauw B, Vandewalle S, Taes Y, Goemaere S, Zmierczak H, Collette J, Kaufman JM. Serum sclerostin levels in men with idiopathic osteoporosis. Eur J Endocrinol 2013; 168:615-620

316.   Zhang XZ, Kalu DN, Erbas B, Hopper JL, Seeman E. The effects of gonadectomy on bone size, mass, and volumetric density in growing rats are gender-, site-, and growth hormone-specific. J Bone Miner Res 1999; 14:802-809

317.   Di Nisio A, De Toni L, Rocca MS, Ghezzi M, Selice R, Taglialavoro G, Ferlin A, Foresta C. Negative Association Between Sclerostin and INSL3 in Isolated Human Osteocytes and in Klinefelter Syndrome: New Hints for Testis-Bone Crosstalk. J Clin Endocrinol Metab 2018; 103:2033-2041

318.   Zoch ML, Clemens TL, Riddle RC. New insights into the biology of osteocalcin. Bone 2016; 82:42-49

319.   Kousteni S, Bellido T, Plotkin LI, O'Brien CA, Bodenner DL, Han L, Han K, DiGregorio GB, Katzenellenbogen JA, Katzenellenbogen BS, Roberson PK, Weinstein RS, Jilka RL, Manolagas SC. Nongenotropic, sex-nonspecific signaling through the estrogen or androgen receptors: dissociation from transcriptional activity. Cell 2001; 104:719-730

320.   Kousteni S, Chen JR, Bellido T, Han L, Ali AA, O'Brien CA, Plotkin L, Fu Q, Mancino AT, Wen Y, Vertino AM, Powers CC, Stewart SA, Ebert R, Parfitt AM, Weinstein RS, Jilka RL, Manolagas SC. Reversal of bone loss in mice by nongenotropic signaling of sex steroids. Science 2002; 298:843-846

321.   Coviello AD, Kaplan B, Lakshman KM, Chen T, Singh AB, Bhasin S. Effects of graded doses of testosterone on erythropoiesis in healthy young and older men. J Clin Endocrinol Metab 2008; 93:914-919

322.   Bachman E, Travison TG, Basaria S, Davda MN, Guo W, Li M, Connor Westfall J, Bae H, Gordeuk V, Bhasin S. Testosterone induces erythrocytosis via increased erythropoietin and suppressed hepcidin: evidence for a new erythropoietin/hemoglobin set point. J Gerontol A Biol Sci Med Sci 2014; 69:725-735

323.   Wu JY, Scadden DT, Kronenberg HM. Role of the osteoblast lineage in the bone marrow hematopoietic niches. J Bone Miner Res 2009; 24:759-764

324.   Valderrabano RJ, Wu JY. Bone and blood interactions in human health and disease. Bone 2019; 119:65-70

325.   Valderrabano RJ, Lui LY, Lee J, Cummings SR, Orwoll ES, Hoffman AR, Wu JY, Osteoporotic Fractures in Men Study Research G. Bone Density Loss Is Associated With Blood Cell Counts. J Bone Miner Res 2017; 32:212-220

326.   Valderrabano RJ, Lee J, Lui LY, Hoffman AR, Cummings SR, Orwoll ES, Wu JY, Osteoporotic Fractures in Men Study Research G. Older Men With Anemia Have Increased Fracture Risk Independent of Bone Mineral Density. J Clin Endocrinol Metab 2017; 102:2199-2206

327.   Valderrabano RJ, Buzkova P, Chang PY, Zakai NA, Fink HA, Robbins JA, Wu JY, Lee JS, Cardiovascular Health Study g. Associations of hemoglobin and change in hemoglobin with risk of incident hip fracture in older men and women: the cardiovascular health study. Osteoporos Int 2021; 32:1669-1677

328.   Ferrucci L, Maggio M, Bandinelli S, Basaria S, Lauretani F, Ble A, Valenti G, Ershler WB, Guralnik JM, Longo DL. Low testosterone levels and the risk of anemia in older men and women. Arch Intern Med 2006; 166:1380-1388

329.   Roy CN, Snyder PJ, Stephens-Shields AJ, Artz AS, Bhasin S, Cohen HJ, Farrar JT, Gill TM, Zeldow B, Cella D, Barrett-Connor E, Cauley JA, Crandall JP, Cunningham GR, Ensrud KE, Lewis CE, Matsumoto AM, Molitch ME, Pahor M, Swerdloff RS, Cifelli D, Hou X, Resnick SM, Walston JD, Anton S, Basaria S, Diem SJ, Wang C, Schrier SL, Ellenberg SS. Association of Testosterone Levels With Anemia in Older Men: A Controlled Clinical Trial. JAMA Intern Med 2017; 177:480-490

330.   Simerly RB, Chang C, Muramatsu M, Swanson LW. Distribution of androgen and estrogen receptor mRNA-containing cells in the rat brain: an in situ hybridization study. J Comp Neurol 1990; 294:76-95

331.   Lu S, Simon NG, Wang Y, Hu S. Neural androgen receptor regulation: effects of androgen and antiandrogen. J Neurobiol 1999; 41:505-512

332.   Lustig RH. Sex hormone modulation of neural development in vitro. Horm Behav 1994; 28:383-395

333.   Rubinow DR, Schmidt PJ. Androgens, brain, and behavior. Am J Psychiatry 1996; 153:974-984

334.   Tobin VA, Millar RP, Canny BJ. Testosterone acts directly at the pituitary to regulate gonadotropin-releasing hormone-induced calcium signals in male rat gonadotropes. Endocrinology 1997; 138:3314-3319

335.   Melcangi RC, Celotti F, Castano P, Martini L. Differential localization of the 5 alpha-reductase and the 3 alpha-hydroxysteroid dehydrogenase in neuronal and glial cultures. Endocrinology 1993; 132:1252-1259

336.   Reddy DS. Testosterone modulation of seizure susceptibility is mediated by neurosteroids 3alpha-androstanediol and 17beta-estradiol. Neuroscience 2004; 129:195-207

337.   Handa RJ, Sharma D, Uht R. A role for the androgen metabolite, 5alpha androstane 3beta, 17beta diol (3beta-diol) in the regulation of the hypothalamo-pituitary-adrenal axis. Front Endocrinol (Lausanne) 2011; 2:65

338.   Hsu B, Cumming RG, Waite LM, Blyth FM, Naganathan V, Le Couteur DG, Seibel MJ, Handelsman DJ. Longitudinal Relationships between Reproductive Hormones and Cognitive Decline in Older Men: The Concord Health and Ageing in Men Project. J Clin Endocrinol Metab 2015; 100:2223-2230

339.   Maccoby EE, Jacklin CN. The Psychology of Sex Differences. Stanford, CA: Stanford University Press; 1974.

340.   Christiansen K. Sex hormone-related variations of cognitive performance in !Kung San hunter-gatherers of Namibia. Neuropsychobiology 1993; 27:97-107

341.   Nass R, Baker S. Androgen effects on cognition: congenital adrenal hyperplasia. Psychoneuroendocrinology 1991; 16:189-201

342.   Jones BA, Watson NV. Spatial memory performance in androgen insensitive male rats. Physiol Behav 2005; 85:135-141

343.   Silverman I, Kastuk D, Choi J, Phillips K. Testosterone levels and spatial ability in men. Psychoneuroendocrinology 1999; 24:813-822

344.   Hooven CK, Chabris CF, Ellison PT, Kosslyn SM. The relationship of male testosterone to components of mental rotation. Neuropsychologia 2004; 42:782-790

345.   Moffat SD, Hampson E. A curvilinear relationship between testosterone and spatial cognition in humans: possible influence of hand preference. Psychoneuroendocrinology 1996; 21:323-337

346.   Moffat SD, Zonderman AB, Metter EJ, Blackman MR, Harman SM, Resnick SM. Longitudinal assessment of serum free testosterone concentration predicts memory performance and cognitive status in elderly men. J Clin Endocrinol Metab 2002; 87:5001-5007

347.   LeBlanc ES, Wang PY, Janowsky JS, Neiss MB, Fink HA, Yaffe K, Marshall LM, Lapidus JA, Stefanick ML, Orwoll ES, Osteoporotic Fractures in Men Research G. Association between sex steroids and cognition in elderly men. Clin Endocrinol (Oxf) 2010; 72:393-403

348.   Lessov-Schlaggar CN, Reed T, Swan GE, Krasnow RE, DeCarli C, Marcus R, Holloway L, Wolf PA, Carmelli D. Association of sex steroid hormones with brain morphology and cognition in healthy elderly men. Neurology 2005; 65:1591-1596

349.   Gouras GK, Xu H, Gross RS, Greenfield JP, Hai B, Wang R, Greengard P. Testosterone reduces neuronal secretion of Alzheimer's beta-amyloid peptides. Proc Natl Acad Sci U S A 2000; 97:1202-1205

350.   Ramsden M, Nyborg AC, Murphy MP, Chang L, Stanczyk FZ, Golde TE, Pike CJ. Androgens modulate beta-amyloid levels in male rat brain. J Neurochem 2003; 87:1052-1055

351.   Pike CJ, Nguyen TV, Ramsden M, Yao M, Murphy MP, Rosario ER. Androgen cell signaling pathways involved in neuroprotective actions. Horm Behav 2008; 53:693-705

352.   Rosario ER, Carroll J, Pike CJ. Testosterone regulation of Alzheimer-like neuropathology in male 3xTg-AD mice involves both estrogen and androgen pathways. Brain Res 2010; 1359:281-290

353.   Rosario ER, Carroll JC, Oddo S, LaFerla FM, Pike CJ. Androgens regulate the development of neuropathology in a triple transgenic mouse model of Alzheimer's disease. J Neurosci 2006; 26:13384-13389

354.   Zhang QG, Wang R, Khan M, Mahesh V, Brann DW. Role of Dickkopf-1, an antagonist of the Wnt/beta-catenin signaling pathway, in estrogen-induced neuroprotection and attenuation of tau phosphorylation. J Neurosci 2008; 28:8430-8441

355.   Yao M, Nguyen TV, Rosario ER, Ramsden M, Pike CJ. Androgens regulate neprilysin expression: role in reducing beta-amyloid levels. J Neurochem 2008; 105:2477-2488

356.   Papasozomenos S, Shanavas A. Testosterone prevents the heat shock-induced overactivation of glycogen synthase kinase-3 beta but not of cyclin-dependent kinase 5 and c-Jun NH2-terminal kinase and concomitantly abolishes hyperphosphorylation of tau: implications for Alzheimer's disease. Proc Natl Acad Sci U S A 2002; 99:1140-1145

357.   Papasozomenos SC. The heat shock-induced hyperphosphorylation of tau is estrogen-independent and prevented by androgens: implications for Alzheimer disease. Proc Natl Acad Sci U S A 1997; 94:6612-6617

358.   Liu XA, Zhu LQ, Zhang Q, Shi HR, Wang SH, Wang Q, Wang JZ. Estradiol attenuates tau hyperphosphorylation induced by upregulation of protein kinase-A. Neurochem Res 2008; 33:1811-1820

359.   Jones KJ, Brown TJ, Damaser M. Neuroprotective effects of gonadal steroids on regenerating peripheral motoneurons. Brain Res Brain Res Rev 2001; 37:372-382

360.   Jones KJ, Coers S, Storer PD, Tanzer L, Kinderman NB. Androgenic regulation of the central glia response following nerve damage. J Neurobiol 1999; 40:560-573

361.   Hammond J, Le Q, Goodyer C, Gelfand M, Trifiro M, LeBlanc A. Testosterone-mediated neuroprotection through the androgen receptor in human primary neurons. J Neurochem 2001; 77:1319-1326

362.   Kujawa KA, Emeric E, Jones KJ. Testosterone differentially regulates the regenerative properties of injured hamster facial motoneurons. J Neurosci 1991; 11:3898-3906

363.   Kujawa KA, Jacob JM, Jones KJ. Testosterone regulation of the regenerative properties of injured rat sciatic motor neurons. J Neurosci Res 1993; 35:268-273

364.   Tetzlaff JE, Huppenbauer CB, Tanzer L, Alexander TD, Jones KJ. Motoneuron injury and repair: New perspectives on gonadal steroids as neurotherapeutics. J Mol Neurosci 2006; 28:53-64

365.   Rhodes ME, Frye CA. Androgens in the hippocampus can alter, and be altered by, ictal activity. Pharmacol Biochem Behav 2004; 78:483-493

366.   Nunez JL, Jurgens HA, Juraska JM. Androgens reduce cell death in the developing rat visual cortex. Brain Res Dev Brain Res 2000; 125:83-88

367.   Hamson DK, Wainwright SR, Taylor JR, Jones BA, Watson NV, Galea LA. Androgens increase survival of adult-born neurons in the dentate gyrus by an androgen receptor-dependent mechanism in male rats. Endocrinology 2013; 154:3294-3304

368.   Ramsden M, Shin TM, Pike CJ. Androgens modulate neuronal vulnerability to kainate lesion. Neuroscience 2003; 122:573-578

369.   Nguyen TV, Yao M, Pike CJ. Androgens activate mitogen-activated protein kinase signaling: role in neuroprotection. J Neurochem 2005; 94:1639-1651

370.   Jayaraman A, Lent-Schochet D, Pike CJ. Diet-induced obesity and low testosterone increase neuroinflammation and impair neural function. J Neuroinflammation 2014; 11:162

371.   Xu J, Itoh Y, Hayashi H, Takii T, Miyazawa K, Onozaki K. Dihydrotestosterone inhibits interleukin-1alpha or tumor necrosis factor alpha-induced proinflammatory cytokine production via androgen receptor-dependent inhibition of nuclear factor-kappaB activation in rheumatoid fibroblast-like synovial cell line. Biol Pharm Bull 2011; 34:1724-1730

372.   Roof RL. The dentate gyrus is sexually dimorphic in prepubescent rats: testosterone plays a significant role. Brain Res 1993; 610:148-151

373.   Scharfman HE, MacLusky NJ. Differential regulation of BDNF, synaptic plasticity and sprouting in the hippocampal mossy fiber pathway of male and female rats. Neuropharmacology 2014; 76 Pt C:696-708

374.   Parducz A, Garcia-Segura LM. Sexual differences in the synaptic connectivity in the rat dentate gyrus. Neurosci Lett 1993; 161:53-56

375.   Meyer G, Ferres-Torres R, Mas M. The effects of puberty and castration on hippocampal dendritic spines of mice. A Golgi study. Brain Res 1978; 155:108-112

376.   Naghdi N, Asadollahi A. Genomic and nongenomic effects of intrahippocampal microinjection of testosterone on long-term memory in male adult rats. Behav Brain Res 2004; 153:1-6

377.   Naghdi N, Majlessi N, Bozorgmehr T. The effect of intrahippocampal injection of testosterone enanthate (an androgen receptor agonist) and anisomycin (protein synthesis inhibitor) on spatial learning and memory in adult, male rats. Behav Brain Res 2005; 156:263-268

378.   Flores-Ramos M, Alcauter S, Lopez-Titla M, Bernal-Santamaria N, Calva-Coraza E, Edden RAE. Testosterone is related to GABA+ levels in the posterior-cingulate in unmedicated depressed women during reproductive life. J Affect Disord 2019; 242:143-149

379.   Hogervorst E, Combrinck M, Smith AD. Testosterone and gonadotropin levels in men with dementia. Neuro Endocrinol Lett 2003; 24:203-208

380.   Hogervorst E, Lehmann DJ, Warden DR, McBroom J, Smith AD. Apolipoprotein E epsilon4 and testosterone interact in the risk of Alzheimer's disease in men. Int J Geriatr Psychiatry 2002; 17:938-940

381.   Hogervorst E, Williams J, Budge M, Barnetson L, Combrinck M, Smith AD. Serum total testosterone is lower in men with Alzheimer's disease. Neuro Endocrinol Lett 2001; 22:163-168

382.   Moffat SD, Zonderman AB, Metter EJ, Kawas C, Blackman MR, Harman SM, Resnick SM. Free testosterone and risk for Alzheimer disease in older men. Neurology 2004; 62:188-193

383.   Paoletti AM, Congia S, Lello S, Tedde D, Orru M, Pistis M, Pilloni M, Zedda P, Loddo A, Melis GB. Low androgenization index in elderly women and elderly men with Alzheimer's disease. Neurology 2004; 62:301-303

384.   Rosario ER, Chang L, Stanczyk FZ, Pike CJ. Age-related testosterone depletion and the development of Alzheimer disease. JAMA 2004; 292:1431-1432

385.   Hier DB, Crowley WF, Jr. Spatial ability in androgen-deficient men. N Engl J Med 1982; 306:1202-1205

386.   Hogervorst E, Matthews FE, Brayne C. Are optimal levels of testosterone associated with better cognitive function in healthy older women and men? Biochim Biophys Acta 2010; 1800:1145-1152

387.   Matousek RH, Sherwin BB. Sex steroid hormones and cognitive functioning in healthy, older men. Horm Behav 2010; 57:352-359

388.   Muller M, Aleman A, Grobbee DE, de Haan EH, van der Schouw YT. Endogenous sex hormone levels and cognitive function in aging men: is there an optimal level? Neurology 2005; 64:866-871

389.   Hua JT, Hildreth KL, Pelak VS. Effects of Testosterone Therapy on Cognitive Function in Aging: A Systematic Review. Cogn Behav Neurol 2016; 29:122-138

390.   Resnick SM, Matsumoto AM, Stephens-Shields AJ, Ellenberg SS, Gill TM, Shumaker SA, Pleasants DD, Barrett-Connor E, Bhasin S, Cauley JA, Cella D, Crandall JP, Cunningham GR, Ensrud KE, Farrar JT, Lewis CE, Molitch ME, Pahor M, Swerdloff RS, Cifelli D, Anton S, Basaria S, Diem SJ, Wang C, Hou X, Snyder PJ. Testosterone Treatment and Cognitive Function in Older Men With Low Testosterone and Age-Associated Memory Impairment. JAMA 2017; 317:717-727

391.   Lu PH, Masterman DA, Mulnard R, Cotman C, Miller B, Yaffe K, Reback E, Porter V, Swerdloff R, Cummings JL. Effects of testosterone on cognition and mood in male patients with mild Alzheimer disease and healthy elderly men. Arch Neurol 2006; 63:177-185

392.   Fukai S, Akishita M, Yamada S, Toba K, Ouchi Y. Effects of testosterone in older men with mild-to-moderate cognitive impairment. J Am Geriatr Soc 2010; 58:1419-1421

393.   Cherrier MM, Craft S, Matsumoto AH. Cognitive changes associated with supplementation of testosterone or dihydrotestosterone in mildly hypogonadal men: a preliminary report. J Androl 2003; 24:568-576

394.   Huang G, Wharton W, Bhasin S, Harman SM, Pencina KM, Tsitouras P, Li Z, Hally KA, Asthana S, Storer TW, Basaria S. Effects of long-term testosterone administration on cognition in older men with low or low-to-normal testosterone concentrations: a prespecified secondary analysis of data from the randomised, double-blind, placebo-controlled TEAAM trial. Lancet Diabetes Endocrinol 2016; 4:657-665

395.   Devanand DP, Nobler MS, Singer T, Kiersky JE, Turret N, Roose SP, Sackeim HA. Is dysthymia a different disorder in the elderly? Am J Psychiatry 1994; 151:1592-1599

396.   Shores MM, Sloan KL, Matsumoto AM, Moceri VM, Felker B, Kivlahan DR. Increased incidence of diagnosed depressive illness in hypogonadal older men. Arch Gen Psychiatry 2004; 61:162-167

397.   Schweiger U, Deuschle M, Weber B, Korner A, Lammers CH, Schmider J, Gotthardt U, Heuser I. Testosterone, gonadotropin, and cortisol secretion in male patients with major depression. Psychosom Med 1999; 61:292-296

398.   Bhasin S, Seidman SN. Testosterone Treatment of Depressive Disorders in Men – Too Much Smoke, not Enough High Quality Evidence. JAMA Psychiatry 2018; in press

399.   Seidman SN, Spatz E, Rizzo C, Roose SP. Testosterone replacement therapy for hypogonadal men with major depressive disorder: a randomized, placebo-controlled clinical trial. J Clin Psychiatry 2001; 62:406-412

400.   Wang C, Alexander G, Berman N, Salehian B, Davidson T, McDonald V, Steiner B, Hull L, Callegari C, Swerdloff RS. Testosterone replacement therapy improves mood in hypogonadal men--a clinical research center study. J Clin Endocrinol Metab 1996; 81:3578-3583

401.   Pope HG, Jr., Cohane GH, Kanayama G, Siegel AJ, Hudson JI. Testosterone gel supplementation for men with refractory depression: a randomized, placebo-controlled trial. Am J Psychiatry 2003; 160:105-111

402.   Seidman SN, Miyazaki M, Roose SP. Intramuscular testosterone supplementation to selective serotonin reuptake inhibitor in treatment-resistant depressed men: randomized placebo-controlled clinical trial. J Clin Psychopharmacol 2005; 25:584-588

403.   Walther A, Breidenstein J, Miller R. Association of Testosterone Treatment With Alleviation of Depressive Symptoms in Men: A Systematic Review and Meta-analysis. JAMA Psychiatry 2019; 76:31-40

404.   Bhasin S, Seidman S. Testosterone Treatment of Depressive Disorders in Men: Too Much Smoke, Not Enough High-Quality Evidence. JAMA Psychiatry 2019; 76:9-10

405.   Shores MM, Kivlahan DR, Sadak TI, Li EJ, Matsumoto AM. A randomized, double-blind, placebo-controlled study of testosterone treatment in hypogonadal older men with subthreshold depression (dysthymia or minor depression). J Clin Psychiatry 2009; 70:1009-1016

406.   Seidman SN, Orr G, Raviv G, Levi R, Roose SP, Kravitz E, Amiaz R, Weiser M. Effects of testosterone replacement in middle-aged men with dysthymia: a randomized, placebo-controlled clinical trial. J Clin Psychopharmacol 2009; 29:216-221

407.   Rabkin JG, Ferrando SJ, Wagner GJ, Rabkin R. DHEA treatment for HIV+ patients: effects on mood, androgenic and anabolic parameters. Psychoneuroendocrinology 2000; 25:53-68

408.   Guo W, Bachman E, Li M, Roy CN, Blusztajn J, Wong S, Chan SY, Serra C, Jasuja R, Travison TG, Muckenthaler MU, Nemeth E, Bhasin S. Testosterone administration inhibits hepcidin transcription and is associated with increased iron incorporation into red blood cells. Aging Cell 2013; 12:280-291

409.   Guo W, Li M, Bhasin S. Testosterone supplementation improves anemia in aging male mice. J Gerontol A Biol Sci Med Sci 2014; 69:505-513

410.   Guo W, Wong S, Li M, Liang W, Liesa M, Serra C, Jasuja R, Bartke A, Kirkland JL, Shirihai O, Bhasin S. Testosterone plus low-intensity physical training in late life improves functional performance, skeletal muscle mitochondrial biogenesis, and mitochondrial quality control in male mice. PLoS One 2012; 7:e51180

411.   Kouri EM, Lukas SE, Pope HG, Jr., Oliva PS. Increased aggressive responding in male volunteers following the administration of gradually increasing doses of testosterone cypionate. Drug Alcohol Depend 1995; 40:73-79

412.   Pope HG, Jr., Katz DL. Affective and psychotic symptoms associated with anabolic steroid use. Am J Psychiatry 1988; 145:487-490

413.   Calof OM, Singh AB, Lee ML, Kenny AM, Urban RJ, Tenover JL, Bhasin S. Adverse events associated with testosterone replacement in middle-aged and older men: a meta-analysis of randomized, placebo-controlled trials. J Gerontol A Biol Sci Med Sci 2005; 60:1451-1457

414.   Rolf C, Nieschlag E. Potential adverse effects of long-term testosterone therapy. Baillieres Clin Endocrinol Metab 1998; 12:521-534

415.   Liu PY, Death AK, Handelsman DJ. Androgens and cardiovascular disease. Endocr Rev 2003; 24:313-340

416.   Gagliano-Juca T, Basaria S. Trials of testosterone replacement reporting cardiovascular adverse events. Asian J Androl 2018; 20:131-137

417.   Gagliano-Juca T, Basaria S. Testosterone replacement therapy and cardiovascular risk. Nat Rev Cardiol 2019; 16:555-574

418.   Haffner SM, Laakso M, Miettinen H, Mykkanen L, Karhapaa P, Rainwater DL. Low levels of sex hormone-binding globulin and testosterone are associated with smaller, denser low density lipoprotein in normoglycemic men. J Clin Endocrinol Metab 1996; 81:3697-3701

419.   Khaw KT, Barrett-Connor E. Endogenous sex hormones, high density lipoprotein cholesterol, and other lipoprotein fractions in men. Arterioscler Thromb 1991; 11:489-494

420.   Page ST, Mohr BA, Link CL, O'Donnell AB, Bremner WJ, McKinlay JB. Higher testosterone levels are associated with increased high-density lipoprotein cholesterol in men with cardiovascular disease: results from the Massachusetts Male Aging Study. Asian J Androl 2008; 10:193-200

421.   Zhang N, Zhang H, Zhang X, Zhang B, Wang F, Wang C, Zhao M, Yu C, Gao L, Zhao J, Guan Q. The relationship between endogenous testosterone and lipid profile in middle-aged and elderly Chinese men. Eur J Endocrinol 2014; 170:487-494

422.   Haffner SM, Mykkanen L, Valdez RA, Katz MS. Relationship of sex hormones to lipids and lipoproteins in nondiabetic men. J Clin Endocrinol Metab 1993; 77:1610-1615

423.   De Pergola G, De Mitrio V, Sciaraffia M, Pannacciulli N, Minenna A, Giorgino F, Petronelli M, Laudadio E, Giorgino R. Lower androgenicity is associated with higher plasma levels of prothrombotic factors irrespective of age, obesity, body fat distribution, and related metabolic parameters in men. Metabolism 1997; 46:1287-1293

424.   Crist DM, Peake GT, Stackpole PJ. Lipemic and lipoproteinemic effects of natural and synthetic androgens in humans. Clin Exp Pharmacol Physiol 1986; 13:513-518

425.   Herbst KL, Amory JK, Brunzell JD, Chansky HA, Bremner WJ. Testosterone administration to men increases hepatic lipase activity and decreases HDL and LDL size in 3 wk. Am J Physiol Endocrinol Metab 2003; 284:E1112-1118

426.   Hurley BF, Seals DR, Hagberg JM, Goldberg AC, Ostrove SM, Holloszy JO, Wiest WG, Goldberg AP. High-density-lipoprotein cholesterol in bodybuilders v powerlifters. Negative effects of androgen use. JAMA 1984; 252:507-513

427.   Thompson PD, Cullinane EM, Sady SP, Chenevert C, Saritelli AL, Sady MA, Herbert PN. Contrasting effects of testosterone and stanozolol on serum lipoprotein levels. JAMA 1989; 261:1165-1168

428.   Snyder PJ, Peachey H, Berlin JA, Rader D, Usher D, Loh L, Hannoush P, Dlewati A, Holmes JH, Santanna J, Strom BL. Effect of transdermal testosterone treatment on serum lipid and apolipoprotein levels in men more than 65 years of age. Am J Med 2001; 111:255-260

429.   Whitsel EA, Boyko EJ, Matsumoto AM, Anawalt BD, Siscovick DS. Intramuscular testosterone esters and plasma lipids in hypogonadal men: a meta-analysis. Am J Med 2001; 111:261-269

430.   Mohler ER, 3rd, Ellenberg SS, Lewis CE, Wenger NK, Budoff MJ, Lewis MR, Barrett-Connor E, Swerdloff RS, Stephens-Shields A, Bhasin S, Cauley JA, Crandall JP, Cunningham GR, Ensrud KE, Gill TM, Matsumoto AM, Molitch ME, Pahor M, Preston PE, Hou X, Cifelli D, Snyder PJ. The Effect of Testosterone on Cardiovascular Biomarkers in the Testosterone Trials. J Clin Endocrinol Metab 2018; 103:681-688

431.   Rubinow KB, Vaisar T, Tang C, Matsumoto AM, Heinecke JW, Page ST. Testosterone replacement in hypogonadal men alters the HDL proteome but not HDL cholesterol efflux capacity. J Lipid Res 2012; 53:1376-1383

432.   Glueck CJ, Glueck HI, Stroop D, Speirs J, Hamer T, Tracy T. Endogenous testosterone, fibrinolysis, and coronary heart disease risk in hyperlipidemic men. J Lab Clin Med 1993; 122:412-420

433.   Eugster M, Reinhart WH. The influence of the haematocrit on primary haemostasis in vitro. Thromb Haemost 2005; 94:1213-1218

434.   Gagliano-Juca T, Pencina KM, Guo W, Li Z, Huang G, Basaria S, Bhasin S. Differential effects of testosterone on circulating neutrophils, monocytes, and platelets in men: Findings from two trials. Andrology 2020; 8:1324-1331

435.   Welsh C, Welsh P, Mark PB, Celis-Morales CA, Lewsey J, Gray SR, Lyall DM, Iliodromiti S, Gill JMR, Pell J, Jhund PS, Sattar N. Association of Total and Differential Leukocyte Counts With Cardiovascular Disease and Mortality in the UK Biobank. Arterioscler Thromb Vasc Biol 2018; 38:1415-1423

436.   Choi SH, Kim JH, Lim S, Lim JY, Kim KW, Park KS, Jang HC. Monocyte count as a predictor of cardiovascular mortality in older Korean people. Age Ageing 2017; 46:433-438

437.   Ajayi AA, Mathur R, Halushka PV. Testosterone increases human platelet thromboxane A2 receptor density and aggregation responses. Circulation 1995; 91:2742-2747

438.   Ajayi AA, Halushka PV. Castration reduces platelet thromboxane A2 receptor density and aggregability. QJM 2005; 98:349-356

439.   Martinez C, Suissa S, Rietbrock S, Katholing A, Freedman B, Cohen AT, Handelsman DJ. Testosterone treatment and risk of venous thromboembolism: population based case-control study. BMJ 2016; 355:i5968

440.   Ramasamy R, Scovell J, Mederos M, Ren R, Jain L, Lipshultz L. Association Between Testosterone Supplementation Therapy and Thrombotic Events in Elderly Men. Urology 2015; 86:283-285

441.   Sharma R, Oni OA, Chen G, Sharma M, Dawn B, Sharma R, Parashara D, Savin VJ, Barua RS, Gupta K. Association Between Testosterone Replacement Therapy and the Incidence of DVT and Pulmonary Embolism: A Retrospective Cohort Study of the Veterans Administration Database. Chest 2016; 150:563-571

442.   Shores MM. Testosterone treatment and cardiovascular events in prescription database studies. Asian J Androl 2018; 20:138-144

443.   Schoenfeld MJ, Shortridge E, Cui Z, Muram D. Medication adherence and treatment patterns for hypogonadal patients treated with topical testosterone therapy: a retrospective medical claims analysis. J Sex Med 2013; 10:1401-1409

444.   Zhang Y, Gao Y, Tan A, Yang X, Zhang H, Zhang S, Wu C, Lu Z, Wang M, Liao M, Qin X, Li L, Hu Y, Mo Z. Endogenous sex hormones and C-reactive protein in healthy Chinese men. Clin Endocrinol (Oxf) 2013; 78:60-66

445.   Kaplan SA, Johnson-Levonas AO, Lin J, Shah AK, Meehan AG. Elevated high sensitivity C-reactive protein levels in aging men with low testosterone. Aging Male 2010; 13:108-112

446.   Pastuszak AW, Kohn TP, Estis J, Lipshultz LI. Low Plasma Testosterone Is Associated With Elevated Cardiovascular Disease Biomarkers. J Sex Med 2017; 14:1095-1103

447.   Tsilidis KK, Rohrmann S, McGlynn KA, Nyante SJ, Lopez DS, Bradwin G, Feinleib M, Joshu CE, Kanarek N, Nelson WG, Selvin E, Platz EA. Association between endogenous sex steroid hormones and inflammatory biomarkers in US men. Andrology 2013; 1:919-928

448.   Maggio M, Basaria S, Ble A, Lauretani F, Bandinelli S, Ceda GP, Valenti G, Ling SM, Ferrucci L. Correlation between testosterone and the inflammatory marker soluble interleukin-6 receptor in older men. J Clin Endocrinol Metab 2006; 91:345-347

449.   Haring R, Baumeister SE, Volzke H, Dorr M, Kocher T, Nauck M, Wallaschofski H. Prospective inverse associations of sex hormone concentrations in men with biomarkers of inflammation and oxidative stress. J Androl 2012; 33:944-950

450.   Ng MK, Liu PY, Williams AJ, Nakhla S, Ly LP, Handelsman DJ, Celermajer DS. Prospective study of effect of androgens on serum inflammatory markers in men. Arterioscler Thromb Vasc Biol 2002; 22:1136-1141

451.   Singh AB, Hsia S, Alaupovic P, Sinha-Hikim I, Woodhouse L, Buchanan TA, Shen R, Bross R, Berman N, Bhasin S. The effects of varying doses of T on insulin sensitivity, plasma lipids, apolipoproteins, and C-reactive protein in healthy young men. J Clin Endocrinol Metab 2002; 87:136-143

452.   Gagliano-Juca T, Burak MF, Pencina KM, Li Z, Edwards RR, Travison TG, Basaria S. Metabolic Changes in Androgen Deprived Non-Diabetic Men with Prostate Cancer are not mediated by Cytokines or aP2. J Clin Endocrinol Metab 2018;

453.   Phillips GB, Pinkernell BH, Jing TY. The association of hypotestosteronemia with coronary artery disease in men. Arterioscler Thromb 1994; 14:701-706

454.   Tibblin G, Adlerberth A, Lindstedt G, Bjorntorp P. The pituitary-gonadal axis and health in elderly men: a study of men born in 1913. Diabetes 1996; 45:1605-1609

455.   Arnlov J, Pencina MJ, Amin S, Nam BH, Benjamin EJ, Murabito JM, Wang TJ, Knapp PE, D'Agostino RB, Sr., Bhasin S, Vasan RS. Endogenous sex hormones and cardiovascular disease incidence in men. Ann Intern Med 2006; 145:176-184

456.   Wu SZ, Weng XZ. Therapeutic effects of an androgenic preparation on myocardial ischemia and cardiac function in 62 elderly male coronary heart disease patients. Chin Med J (Engl) 1993; 106:415-418

457.   Jaffe MD. Effect of testosterone cypionate on postexercise ST segment depression. Br Heart J 1977; 39:1217-1222

458.   Ong PJ, Patrizi G, Chong WC, Webb CM, Hayward CS, Collins P. Testosterone enhances flow-mediated brachial artery reactivity in men with coronary artery disease. Am J Cardiol 2000; 85:269-272

459.   Rosano GM, Leonardo F, Pagnotta P, Pelliccia F, Panina G, Cerquetani E, della Monica PL, Bonfigli B, Volpe M, Chierchia SL. Acute anti-ischemic effect of testosterone in men with coronary artery disease. Circulation 1999; 99:1666-1670

460.   Webb CM, Adamson DL, de Zeigler D, Collins P. Effect of acute testosterone on myocardial ischemia in men with coronary artery disease. Am J Cardiol 1999; 83:437-439, A439

461.   English KM, Steeds RP, Jones TH, Diver MJ, Channer KS. Low-dose transdermal testosterone therapy improves angina threshold in men with chronic stable angina: A randomized, double-blind, placebo-controlled study. Circulation 2000; 102:1906-1911

462.   Thompson PD, Ahlberg AW, Moyna NM, Duncan B, Ferraro-Borgida M, White CM, McGill CC, Heller GV. Effect of intravenous testosterone on myocardial ischemia in men with coronary artery disease. Am Heart J 2002; 143:249-256

463.   Yue P, Chatterjee K, Beale C, Poole-Wilson PA, Collins P. Testosterone relaxes rabbit coronary arteries and aorta. Circulation 1995; 91:1154-1160

464.   Yu J, Akishita M, Eto M, Ogawa S, Son BK, Kato S, Ouchi Y, Okabe T. Androgen receptor-dependent activation of endothelial nitric oxide synthase in vascular endothelial cells: role of phosphatidylinositol 3-kinase/akt pathway. Endocrinology 2010; 151:1822-1828

465.   Scragg JL, Jones RD, Channer KS, Jones TH, Peers C. Testosterone is a potent inhibitor of L-type Ca(2+) channels. Biochem Biophys Res Commun 2004; 318:503-506

466.   Nathan L, Shi W, Dinh H, Mukherjee TK, Wang X, Lusis AJ, Chaudhuri G. Testosterone inhibits early atherogenesis by conversion to estradiol: critical role of aromatase. Proc Natl Acad Sci U S A 2001; 98:3589-3593

467.   Budoff MJ, Ellenberg SS, Lewis CE, Mohler ER, 3rd, Wenger NK, Bhasin S, Barrett-Connor E, Swerdloff RS, Stephens-Shields A, Cauley JA, Crandall JP, Cunningham GR, Ensrud KE, Gill TM, Matsumoto AM, Molitch ME, Nakanishi R, Nezarat N, Matsumoto S, Hou X, Basaria S, Diem SJ, Wang C, Cifelli D, Snyder PJ. Testosterone Treatment and Coronary Artery Plaque Volume in Older Men With Low Testosterone. JAMA 2017; 317:708-716

468.   Salem JE, Alexandre J, Bachelot A, Funck-Brentano C. Influence of steroid hormones on ventricular repolarization. Pharmacol Ther 2016; 167:38-47

469.   Ridley JM, Shuba YM, James AF, Hancox JC. Modulation by testosterone of an endogenous hERG potassium channel current. J Physiol Pharmacol 2008; 59:395-407

470.   Er F, Michels G, Brandt MC, Khan I, Haase H, Eicks M, Lindner M, Hoppe UC. Impact of testosterone on cardiac L-type calcium channels and Ca2+ sparks: acute actions antagonize chronic effects. Cell Calcium 2007; 41:467-477

471.   Vicente J, Johannesen L, Galeotti L, Strauss DG. Mechanisms of sex and age differences in ventricular repolarization in humans. Am Heart J 2014; 168:749-756

472.   Zhang Y, Ouyang P, Post WS, Dalal D, Vaidya D, Blasco-Colmenares E, Soliman EZ, Tomaselli GF, Guallar E. Sex-steroid hormones and electrocardiographic QT-interval duration: findings from the third National Health and Nutrition Examination Survey and the Multi-Ethnic Study of Atherosclerosis. Am J Epidemiol 2011; 174:403-411

473.   Gagliano-Juca T, Icli TB, Pencina KM, Li Z, Tapper J, Huang G, Travison TG, Tsitouras P, Harman SM, Storer TW, Bhasin S, Basaria S. Effects of Testosterone Replacement on Electrocardiographic Parameters in Men: Findings From Two Randomized Trials. J Clin Endocrinol Metab 2017; 102:1478-1485

474.   Schwartz JB, Volterrani M, Caminiti G, Marazzi G, Fini M, Rosano GM, Iellamo F. Effects of testosterone on the Q-T interval in older men and older women with chronic heart failure. Int J Androl 2011; 34:e415-421

475.   Gagliano-Juca T, Travison TG, Kantoff PW, Nguyen PL, Taplin ME, Kibel AS, Huang G, Bearup R, Schram H, Manley R, Beleva YM, Edwards RR, Basaria S. Androgen Deprivation Therapy Is Associated With Prolongation of QTc Interval in Men With Prostate Cancer. J Endocr Soc 2018; 2:485-496

476.   Zhang Y, Post WS, Blasco-Colmenares E, Dalal D, Tomaselli GF, Guallar E. Electrocardiographic QT interval and mortality: a meta-analysis. Epidemiology 2011; 22:660-670

477.   Noseworthy PA, Peloso GM, Hwang SJ, Larson MG, Levy D, O'Donnell CJ, Newton-Cheh C. QT interval and long-term mortality risk in the Framingham Heart Study. Ann Noninvasive Electrocardiol 2012; 17:340-348

478.   Nielsen JB, Graff C, Rasmussen PV, Pietersen A, Lind B, Olesen MS, Struijk JJ, Haunso S, Svendsen JH, Kober L, Gerds TA, Holst AG. Risk prediction of cardiovascular death based on the QTc interval: evaluating age and gender differences in a large primary care population. Eur Heart J 2014; 35:1335-1344

479.   Keating NL, O'Malley AJ, Smith MR. Diabetes and cardiovascular disease during androgen deprivation therapy for prostate cancer. J Clin Oncol 2006; 24:4448-4456

480.   Haque R, UlcickasYood M, Xu X, Cassidy-Bushrow AE, Tsai H-T, Keating NL, Van Den Eeden SK, Potosky AL. Cardiovascular disease risk and androgen deprivation therapy in patients with localised prostate cancer: a prospective cohort study. British Journal of Cancer 2017;

481.   Salem JE, Waintraub X, Courtillot C, Shaffer CM, Gandjbakhch E, Maupain C, Moslehi JJ, Badilini F, Haroche J, Gougis P, Fressart V, Glazer AM, Hidden-Lucet F, Touraine P, Lebrun-Vignes B, Roden DM, Bachelot A, Funck-Brentano C. Hypogonadism as a Reversible Cause of Torsades de Pointes in Men. Circulation 2018; 138:110-113

482.   Magnani JW, Moser CB, Murabito JM, Sullivan LM, Wang N, Ellinor PT, Vasan RS, Benjamin EJ, Coviello AD. Association of sex hormones, aging, and atrial fibrillation in men: the Framingham Heart Study. Circ Arrhythm Electrophysiol 2014; 7:307-312

483.   Rosenberg MA, Shores MM, Matsumoto AM, Buzkova P, Lange LA, Kronmal RA, Heckbert SR, Mukamal KJ. Serum androgens and risk of atrial fibrillation in older men: The Cardiovascular Health Study. Clin Cardiol 2018; 41:830-836

484.   Zeller T, Schnabel RB, Appelbaum S, Ojeda F, Berisha F, Schulte-Steinberg B, Brueckmann BE, Kuulasmaa K, Jousilahti P, Blankenberg S, Palosaari T, Salomaa V, Karakas M. Low testosterone levels are predictive for incident atrial fibrillation and ischaemic stroke in men, but protective in women - results from the FINRISK study. Eur J Prev Cardiol 2018; 25:1133-1139

485.   Sharma R, Oni OA, Gupta K, Sharma M, Sharma R, Singh V, Parashara D, Kamalakar S, Dawn B, Chen G, Ambrose JA, Barua RS. Normalization of Testosterone Levels After Testosterone Replacement Therapy Is Associated With Decreased Incidence of Atrial Fibrillation. J Am Heart Assoc 2017; 6

486.   Fernandez-Balsells MM, Murad MH, Lane M, Lampropulos JF, Albuquerque F, Mullan RJ, Agrwal N, Elamin MB, Gallegos-Orozco JF, Wang AT, Erwin PJ, Bhasin S, Montori VM. Clinical review 1: Adverse effects of testosterone therapy in adult men: a systematic review and meta-analysis. J Clin Endocrinol Metab 2010; 95:2560-2575

487.   Xu L, Freeman G, Cowling BJ, Schooling CM. Testosterone therapy and cardiovascular events among men: a systematic review and meta-analysis of placebo-controlled randomized trials. BMC Med 2013; 11:108

488.   Basaria S, Davda MN, Travison TG, Ulloor J, Singh R, Bhasin S. Risk factors associated with cardiovascular events during testosterone administration in older men with mobility limitation. J Gerontol A Biol Sci Med Sci 2013; 68:153-160

489.   Sattler FR, Castaneda-Sceppa C, Binder EF, Schroeder ET, Wang Y, Bhasin S, Kawakubo M, Stewart Y, Yarasheski KE, Ulloor J, Colletti P, Roubenoff R, Azen SP. Testosterone and growth hormone improve body composition and muscle performance in older men. J Clin Endocrinol Metab 2009; 94:1991-2001

490.   Johannsson G, Gibney J, Wolthers T, Leung KC, Ho KK. Independent and combined effects of testosterone and growth hormone on extracellular water in hypopituitary men. J Clin Endocrinol Metab 2005; 90:3989-3994

491.   Alexander GC, Iyer G, Lucas E, Lin D, Singh S. Cardiovascular Risks of Exogenous Testosterone Use Among Men: A Systematic Review and Meta-Analysis. Am J Med 2017; 130:293-305

492.   Albert SG, Morley JE. Testosterone therapy, association with age, initiation and mode of therapy with cardiovascular events: a systematic review. Clin Endocrinol (Oxf) 2016; 85:436-443

493.   Corona G, Maseroli E, Rastrelli G, Isidori AM, Sforza A, Mannucci E, Maggi M. Cardiovascular risk associated with testosterone-boosting medications: a systematic review and meta-analysis. Expert Opin Drug Saf 2014; 13:1327-1351

494.   Corona G, Rastrelli G, Di Pasquale G, Sforza A, Mannucci E, Maggi M. Testosterone and Cardiovascular Risk: Meta-Analysis of Interventional Studies. J Sex Med 2018; 15:820-838

495.   Vigen R, O'Donnell CI, Baron AE, Grunwald GK, Maddox TM, Bradley SM, Barqawi A, Woning G, Wierman ME, Plomondon ME, Rumsfeld JS, Ho PM. Association of testosterone therapy with mortality, myocardial infarction, and stroke in men with low testosterone levels. JAMA 2013; 310:1829-1836

496.   Shores MM, Smith NL, Forsberg CW, Anawalt BD, Matsumoto AM. Testosterone treatment and mortality in men with low testosterone levels. J Clin Endocrinol Metab 2012; 97:2050-2058

497.   Finkle WD, Greenland S, Ridgeway GK, Adams JL, Frasco MA, Cook MB, Fraumeni JF, Jr., Hoover RN. Increased risk of non-fatal myocardial infarction following testosterone therapy prescription in men. PLoS One 2014; 9:e85805

498.   Baillargeon J, Urban RJ, Kuo YF, Ottenbacher KJ, Raji MA, Du F, Lin YL, Goodwin JS. Risk of Myocardial Infarction in Older Men Receiving Testosterone Therapy. Ann Pharmacother 2014; 48:1138-1144

499.   Khaw KT, Barrett-Connor E. Lower endogenous androgens predict central adiposity in men. Ann Epidemiol 1992; 2:675-682

500.   Seidell JC, Bjorntorp P, Sjostrom L, Kvist H, Sannerstedt R. Visceral fat accumulation in men is positively associated with insulin, glucose, and C-peptide levels, but negatively with testosterone levels. Metabolism 1990; 39:897-901

501.   Marin P, Oden B, Bjorntorp P. Assimilation and mobilization of triglycerides in subcutaneous abdominal and femoral adipose tissue in vivo in men: effects of androgens. J Clin Endocrinol Metab 1995; 80:239-243

502.   Holmang A, Bjorntorp P. The effects of testosterone on insulin sensitivity in male rats. Acta Physiol Scand 1992; 146:505-510

503.   Hobbs CJ, Jones RE, Plymate SR. Nandrolone, a 19-nortestosterone, enhances insulin-independent glucose uptake in normal men. J Clin Endocrinol Metab 1996; 81:1582-1585

504.   Ramirez ME, McMurry MP, Wiebke GA, Felten KJ, Ren K, Meikle AW, Iverius PH. Evidence for sex steroid inhibition of lipoprotein lipase in men: comparison of abdominal and femoral adipose tissue. Metabolism 1997; 46:179-185

505.   Pitteloud N, Mootha VK, Dwyer AA, Hardin M, Lee H, Eriksson KF, Tripathy D, Yialamas M, Groop L, Elahi D, Hayes FJ. Relationship between testosterone levels, insulin sensitivity, and mitochondrial function in men. Diabetes Care 2005; 28:1636-1642

506.   Endre T, Mattiasson I, Berglund G, Hulthen UL. Low testosterone and insulin resistance in hypertension-prone men. J Hum Hypertens 1996; 10:755-761

507.   Defay R, Papoz L, Barny S, Bonnot-Lours S, Caces E, Simon D. Hormonal status and NIDDM in the European and Melanesian populations of New Caledonia: a case-control study. The CALedonia DIAbetes Mellitus (CALDIA) Study Group. Int J Obes Relat Metab Disord 1998; 22:927-934

508.   Oh JY, Barrett-Connor E, Wedick NM, Wingard DL, Rancho Bernardo S. Endogenous sex hormones and the development of type 2 diabetes in older men and women: the Rancho Bernardo study. Diabetes Care 2002; 25:55-60

509.   Haffner SM, Shaten J, Stern MP, Smith GD, Kuller L. Low levels of sex hormone-binding globulin and testosterone predict the development of non-insulin-dependent diabetes mellitus in men. MRFIT Research Group. Multiple Risk Factor Intervention Trial. Am J Epidemiol 1996; 143:889-897

510.   Stellato RK, Feldman HA, Hamdy O, Horton ES, McKinlay JB. Testosterone, sex hormone-binding globulin, and the development of type 2 diabetes in middle-aged men: prospective results from the Massachusetts male aging study. Diabetes Care 2000; 23:490-494

511.   Dhindsa S, Ghanim H, Batra M, Kuhadiya ND, Abuaysheh S, Sandhu S, Green K, Makdissi A, Hejna J, Chaudhuri A, Punyanitya M, Dandona P. Insulin Resistance and Inflammation in Hypogonadotropic Hypogonadism and Their Reduction After Testosterone Replacement in Men With Type 2 Diabetes. Diabetes Care 2016; 39:82-91

512.   Selvin E, Feinleib M, Zhang L, Rohrmann S, Rifai N, Nelson WG, Dobs A, Basaria S, Golden SH, Platz EA. Androgens and diabetes in men: results from the Third National Health and Nutrition Examination Survey (NHANES III). Diabetes Care 2007; 30:234-238

513.   Svartberg J, Jenssen T, Sundsfjord J, Jorde R. The associations of endogenous testosterone and sex hormone-binding globulin with glycosylated hemoglobin levels, in community dwelling men. The Tromso Study. Diabetes Metab 2004; 30:29-34

514.   Laaksonen DE, Niskanen L, Punnonen K, Nyyssonen K, Tuomainen TP, Valkonen VP, Salonen R, Salonen JT. Testosterone and sex hormone-binding globulin predict the metabolic syndrome and diabetes in middle-aged men. Diabetes Care 2004; 27:1036-1041

515.   Ding EL, Song Y, Malik VS, Liu S. Sex differences of endogenous sex hormones and risk of type 2 diabetes: a systematic review and meta-analysis. JAMA 2006; 295:1288-1299

516.   Kapoor D, Aldred H, Clark S, Channer KS, Jones TH. Clinical and biochemical assessment of hypogonadism in men with type 2 diabetes: correlations with bioavailable testosterone and visceral adiposity. Diabetes Care 2007; 30:911-917

517.   Yeap BB, Chubb SA, Hyde Z, Jamrozik K, Hankey GJ, Flicker L, Norman PE. Lower serum testosterone is independently associated with insulin resistance in non-diabetic older men: the Health In Men Study. Eur J Endocrinol 2009; 161:591-598

518.   Vikan T, Schirmer H, Njolstad I, Svartberg J. Low testosterone and sex hormone-binding globulin levels and high estradiol levels are independent predictors of type 2 diabetes in men. Eur J Endocrinol 2010; 162:747-754

519.   Muller M, Grobbee DE, den Tonkelaar I, Lamberts SW, van der Schouw YT. Endogenous sex hormones and metabolic syndrome in aging men. J Clin Endocrinol Metab 2005; 90:2618-2623

520.   Chin KY, Ima-Nirwana S, Mohamed IN, Aminuddin A, Ngah WZ. Total testosterone and sex hormone-binding globulin are significantly associated with metabolic syndrome in middle-aged and elderly men. Exp Clin Endocrinol Diabetes 2013; 121:407-412

521.   Svartberg J, Schirmer H, Wilsgaard T, Mathiesen EB, Njolstad I, Lochen ML, Jorde R. Single-nucleotide polymorphism, rs1799941 in the Sex Hormone-Binding Globulin (SHBG) gene, related to both serum testosterone and SHBG levels and the risk of myocardial infarction, type 2 diabetes, cancer and mortality in men: the Tromso Study. Andrology 2014; 2:212-218

522.   Perry JR, Weedon MN, Langenberg C, Jackson AU, Lyssenko V, Sparso T, Thorleifsson G, Grallert H, Ferrucci L, Maggio M, Paolisso G, Walker M, Palmer CN, Payne F, Young E, Herder C, Narisu N, Morken MA, Bonnycastle LL, Owen KR, Shields B, Knight B, Bennett A, Groves CJ, Ruokonen A, Jarvelin MR, Pearson E, Pascoe L, Ferrannini E, Bornstein SR, Stringham HM, Scott LJ, Kuusisto J, Nilsson P, Neptin M, Gjesing AP, Pisinger C, Lauritzen T, Sandbaek A, Sampson M, Magic, Zeggini E, Lindgren CM, Steinthorsdottir V, Thorsteinsdottir U, Hansen T, Schwarz P, Illig T, Laakso M, Stefansson K, Morris AD, Groop L, Pedersen O, Boehnke M, Barroso I, Wareham NJ, Hattersley AT, McCarthy MI, Frayling TM. Genetic evidence that raised sex hormone binding globulin (SHBG) levels reduce the risk of type 2 diabetes. Hum Mol Genet 2010; 19:535-544

523.   Saltiki K, Stamatelopoulos K, Voidonikola P, Lazaros L, Mantzou E, Georgiou I, Anastasiou E, Papamichael C, Alevizaki M. Association of the SHBG gene promoter polymorphism with early markers of atherosclerosis in apparently healthy women. Atherosclerosis 2011; 219:205-210

524.   Ding EL, Song Y, Manson JE, Hunter DJ, Lee CC, Rifai N, Buring JE, Gaziano JM, Liu S. Sex hormone-binding globulin and risk of type 2 diabetes in women and men. N Engl J Med 2009; 361:1152-1163

525.   Lakshman KM, Bhasin S, Araujo AB. Sex hormone-binding globulin as an independent predictor of incident type 2 diabetes mellitus in men. J Gerontol A Biol Sci Med Sci 2010; 65:503-509

526.   Goldman AL, Bhasin S, Wu FCW, Krishna M, Matsumoto AM, Jasuja R. A Reappraisal of Testosterone's Binding in Circulation: Physiological and Clinical Implications. Endocr Rev 2017; 38:302-324

527.   Ruth KS, Day FR, Tyrrell J, Thompson DJ, Wood AR, Mahajan A, Beaumont RN, Wittemans L, Martin S, Busch AS, Erzurumluoglu AM, Hollis B, O'Mara TA, Endometrial Cancer Association C, McCarthy MI, Langenberg C, Easton DF, Wareham NJ, Burgess S, Murray A, Ong KK, Frayling TM, Perry JRB. Using human genetics to understand the disease impacts of testosterone in men and women. Nat Med 2020; 26:252-258

528.   Yialamas MA, Dwyer AA, Hanley E, Lee H, Pitteloud N, Hayes FJ. Acute sex steroid withdrawal reduces insulin sensitivity in healthy men with idiopathic hypogonadotropic hypogonadism. J Clin Endocrinol Metab 2007; 92:4254-4259

529.   Basaria S, Muller DC, Carducci MA, Egan J, Dobs AS. Relation between duration of androgen deprivation therapy and degree of insulin resistance in men with prostate cancer. Arch Intern Med 2007; 167:612-613

530.   Nguyen PL, Jarolim P, Basaria S, Zuflacht JP, Milian J, Kadivar S, Graham PL, Hyatt A, Kantoff PW, Beckman JA. Androgen deprivation therapy reversibly increases endothelium-dependent vasodilation in men with prostate cancer. J Am Heart Assoc 2015; 4

531.   Keating NL, O'Malley AJ, Freedland SJ, Smith MR. Diabetes and cardiovascular disease during androgen deprivation therapy: observational study of veterans with prostate cancer. J Natl Cancer Inst 2010; 102:39-46

532.   Jones TH, Arver S, Behre HM, Buvat J, Meuleman E, Moncada I, Morales AM, Volterrani M, Yellowlees A, Howell JD, Channer KS, Investigators T. Testosterone replacement in hypogonadal men with type 2 diabetes and/or metabolic syndrome (the TIMES2 study). Diabetes Care 2011; 34:828-837

533.   Corona G, Monami M, Rastrelli G, Aversa A, Sforza A, Lenzi A, Forti G, Mannucci E, Maggi M. Type 2 diabetes mellitus and testosterone: a meta-analysis study. Int J Androl 2011; 34:528-540

534.   Basu R, Dalla Man C, Campioni M, Basu A, Nair KS, Jensen MD, Khosla S, Klee G, Toffolo G, Cobelli C, Rizza RA. Effect of 2 years of testosterone replacement on insulin secretion, insulin action, glucose effectiveness, hepatic insulin clearance, and postprandial glucose turnover in elderly men. Diabetes Care 2007; 30:1972-1978

535.   Gianatti EJ, Dupuis P, Hoermann R, Strauss BJ, Wentworth JM, Zajac JD, Grossmann M. Effect of testosterone treatment on glucose metabolism in men with type 2 diabetes: a randomized controlled trial. Diabetes Care 2014; 37:2098-2107

536.   Grossmann M, Hoermann R, Wittert G, Yeap BB. Effects of testosterone treatment on glucose metabolism and symptoms in men with type 2 diabetes and the metabolic syndrome: a systematic review and meta-analysis of randomized controlled clinical trials. Clin Endocrinol (Oxf) 2015; 83:344-351

537.   Huang G, Pencina KM, Li Z, Basaria S, Bhasin S, Travison TG, Storer TW, Harman SM, Tsitouras P. Long-Term Testosterone Administration on Insulin Sensitivity in Older Men With Low or Low-Normal Testosterone Levels. J Clin Endocrinol Metab 2018; 103:1678-1685

538.   Wittert G, Bracken K, Robledo KP, Grossmann M, Yeap BB, Handelsman DJ, Stuckey B, Conway A, Inder W, McLachlan R, Allan C, Jesudason D, Fui MNT, Hague W, Jenkins A, Daniel M, Gebski V, Keech A. Testosterone treatment to prevent or revert type 2 diabetes in men enrolled in a lifestyle programme (T4DM): a randomised, double-blind, placebo-controlled, 2-year, phase 3b trial. Lancet Diabetes Endocrinol 2021; 9:32-45

539.   Warburton D, Hobaugh C, Wang G, Lin H, Wang R. Testosterone replacement therapy and the risk of prostate cancer. Asian J Androl 2015; 17:878-881; discussion 880

540.   Debruyne FM, Behre HM, Roehrborn CG, Maggi M, Wu FC, Schroder FH, Jones TH, Porst H, Hackett G, Wheaton OA, Martin-Morales A, Meuleman E, Cunningham GR, Divan HA, Rosen RC, Investigators R. Testosterone treatment is not associated with increased risk of prostate cancer or worsening of lower urinary tract symptoms: prostate health outcomes in the Registry of Hypogonadism in Men. BJU Int 2017; 119:216-224

541.   Cui Y, Zong H, Yan H, Zhang Y. The effect of testosterone replacement therapy on prostate cancer: a systematic review and meta-analysis. Prostate Cancer Prostatic Dis 2014; 17:132-143

542.   Boyle P, Koechlin A, Bota M, d'Onofrio A, Zaridze DG, Perrin P, Fitzpatrick J, Burnett AL, Boniol M. Endogenous and exogenous testosterone and the risk of prostate cancer and increased prostate-specific antigen (PSA) level: a meta-analysis. BJU Int 2016; 118:731-741

543.   Bhasin S, Singh AB, Mac RP, Carter B, Lee MI, Cunningham GR. Managing the risks of prostate disease during testosterone replacement therapy in older men: recommendations for a standardized monitoring plan. J Androl 2003; 24:299-311

544.   Fowler JE, Jr., Whitmore WF, Jr. The response of metastatic adenocarcinoma of the prostate to exogenous testosterone. J Urol 1981; 126:372-375

545.   Watts EL, Appleby PN, Perez-Cornago A, Bueno-de-Mesquita HB, Chan JM, Chen C, Cohn BA, Cook MB, Flicker L, Freedman ND, Giles GG, Giovannucci E, Gislefoss RE, Hankey GJ, Kaaks R, Knekt P, Kolonel LN, Kubo T, Le Marchand L, Luben RN, Luostarinen T, Mannisto S, Metter EJ, Mikami K, Milne RL, Ozasa K, Platz EA, Quiros JR, Rissanen H, Sawada N, Stampfer M, Stanczyk FZ, Stattin P, Tamakoshi A, Tangen CM, Thompson IM, Tsilidis KK, Tsugane S, Ursin G, Vatten L, Weiss NS, Yeap BB, Allen NE, Key TJ, Travis RC. Low Free Testosterone and Prostate Cancer Risk: A Collaborative Analysis of 20 Prospective Studies. Eur Urol 2018;

546.   Watts EL, Fensom GK, Smith Byrne K, Perez-Cornago A, Allen NE, Knuppel A, Gunter MJ, Holmes MV, Martin RM, Murphy N, Tsilidis KK, Yeap BB, Key TJ, Travis RC. Circulating insulin-like growth factor-I, total and free testosterone concentrations and prostate cancer risk in 200 000 men in UK Biobank. Int J Cancer 2021; 148:2274-2288

547.   Manni A, Bartholomew M, Caplan R, Boucher A, Santen R, Lipton A, Harvey H, Simmonds M, White-Hershey D, Gordon R, et al. Androgen priming and chemotherapy in advanced prostate cancer: evaluation of determinants of clinical outcome. J Clin Oncol 1988; 6:1456-1466

548.   Babaian RJ, Johnston DA, Naccarato W, Ayala A, Bhadkamkar VA, Fritsche HH, Jr. The incidence of prostate cancer in a screening population with a serum prostate specific antigen between 2.5 and 4.0 ng/ml: relation to biopsy strategy. J Urol 2001; 165:757-760

549.   Gatling RR. Prostate carcinoma: an autopsy evaluation of the influence of age, tumor grade, and therapy on tumor biology. South Med J 1990; 83:782-784

550.   Siegel RL, Miller KD, Jemal A. Cancer statistics, 2018. CA Cancer J Clin 2018; 68:7-30

551.   Guileyardo JM, Johnson WD, Welsh RA, Akazaki K, Correa P. Prevalence of latent prostate carcinoma in two U.S. populations. J Natl Cancer Inst 1980; 65:311-316

552.   Torre LA, Bray F, Siegel RL, Ferlay J, Lortet-Tieulent J, Jemal A. Global cancer statistics, 2012. CA Cancer J Clin 2015; 65:87-108

553.   Cook MB, Rosenberg PS, McCarty FA, Wu M, King J, Eheman C, Anderson WF. Racial disparities in prostate cancer incidence rates by census division in the United States, 1999-2008. Prostate 2015; 75:758-763

554.   Siegel RL, Miller KD, Jemal A. Cancer Statistics, 2017. CA Cancer J Clin 2017; 67:7-30

555.   Holmang S, Marin P, Lindstedt G, Hedelin H. Effect of long-term oral testosterone undecanoate treatment on prostate volume and serum prostate-specific antigen concentration in eugonadal middle-aged men. Prostate 1993; 23:99-106

556.   Morgentaler A, Bruning CO, 3rd, DeWolf WC. Occult prostate cancer in men with low serum testosterone levels. JAMA 1996; 276:1904-1906

557.   Hoffman MA, DeWolf WC, Morgentaler A. Is low serum free testosterone a marker for high grade prostate cancer? J Urol 2000; 163:824-827

558.   Cunningham GR, Ellenberg SS, Bhasin S, Matsumoto AM, Parsons JK, Preston P, Cauley JA, Gill TM, Swerdloff RS, Wang C, Ensrud KE, Lewis CE, Pahor M, Crandall JP, Molitch ME, Cifelli D, Basaria S, Diem SJ, Stephens-Shields AJ, Hou X, Snyder PJ. Prostate-Specific Antigen Levels During Testosterone Treatment of Hypogonadal Older Men: Data from a Controlled Trial. J Clin Endocrinol Metab 2019; 104:6238-6246

559.   Marks LS, Mazer NA, Mostaghel E, Hess DL, Dorey FJ, Epstein JI, Veltri RW, Makarov DV, Partin AW, Bostwick DG, Macairan ML, Nelson PS. Effect of testosterone replacement therapy on prostate tissue in men with late-onset hypogonadism: a randomized controlled trial. JAMA 2006; 296:2351-2361

560.   Page ST, Lin DW, Mostaghel EA, Hess DL, True LD, Amory JK, Nelson PS, Matsumoto AM, Bremner WJ. Persistent intraprostatic androgen concentrations after medical castration in healthy men. J Clin Endocrinol Metab 2006; 91:3850-3856

561.   Mostaghel EA, Page ST, Lin DW, Fazli L, Coleman IM, True LD, Knudsen B, Hess DL, Nelson CC, Matsumoto AM, Bremner WJ, Gleave ME, Nelson PS. Intraprostatic androgens and androgen-regulated gene expression persist after testosterone suppression: therapeutic implications for castration-resistant prostate cancer. Cancer Res 2007; 67:5033-5041

562.   Behre HM, Bohmeyer J, Nieschlag E. Prostate volume in testosterone-treated and untreated hypogonadal men in comparison to age-matched normal controls. Clin Endocrinol (Oxf) 1994; 40:341-349

563.   Cooper CS, Perry PJ, Sparks AE, MacIndoe JH, Yates WR, Williams RD. Effect of exogenous testosterone on prostate volume, serum and semen prostate specific antigen levels in healthy young men. J Urol 1998; 159:441-443

564.   Douglas TH, Connelly RR, McLeod DG, Erickson SJ, Barren R, 3rd, Murphy GP. Effect of exogenous testosterone replacement on prostate-specific antigen and prostate-specific membrane antigen levels in hypogonadal men. J Surg Oncol 1995; 59:246-250

565.   Guay AT, Perez JB, Fitaihi WA, Vereb M. Testosterone treatment in hypogonadal men: prostate-specific antigen level and risk of prostate cancer. Endocr Pract 2000; 6:132-138

566.   Meikle AW, Arver S, Dobs AS, Adolfsson J, Sanders SW, Middleton RG, Stephenson RA, Hoover DR, Rajaram L, Mazer NA. Prostate size in hypogonadal men treated with a nonscrotal permeation-enhanced testosterone transdermal system. Urology 1997; 49:191-196

567.   Sasagawa I, Nakada T, Kazama T, Satomi S, Terada T, Katayama T. Volume change of the prostate and seminal vesicles in male hypogonadism after androgen replacement therapy. Int Urol Nephrol 1990; 22:279-284

568.   Shibasaki T, Sasagawa I, Suzuki Y, Yazawa H, Ichiyanagi O, Matsuki S, Miura M, Nakada T. Effect of testosterone replacement therapy on serum PSA in patients with Klinefelter syndrome. Arch Androl 2001; 47:173-176

569.   Svetec DA, Canby ED, Thompson IM, Sabanegh ES, Jr. The effect of parenteral testosterone replacement on prostate specific antigen in hypogonadal men with erectile dysfunction. J Urol 1997; 158:1775-1777

570.   Gormley GJ, Stoner E, Bruskewitz RC, Imperato-McGinley J, Walsh PC, McConnell JD, Andriole GL, Geller J, Bracken BR, Tenover JS, et al. The effect of finasteride in men with benign prostatic hyperplasia. The Finasteride Study Group. N Engl J Med 1992; 327:1185-1191

571.   Thompson IM, Goodman PJ, Tangen CM, Lucia MS, Miller GJ, Ford LG, Lieber MM, Cespedes RD, Atkins JN, Lippman SM, Carlin SM, Ryan A, Szczepanek CM, Crowley JJ, Coltman CA, Jr. The influence of finasteride on the development of prostate cancer. N Engl J Med 2003; 349:215-224

572.   Manseck A, Pilarsky C, Froschermaier S, Menschikowski M, Wirth MP. Diagnostic significance of prostate-specific antigen velocity at intermediate PSA serum levels in relation to the standard deviation of different test systems. Urol Int 1998; 60:25-27

573.   Riehmann M, Rhodes PR, Cook TD, Grose GS, Bruskewitz RC. Analysis of variation in prostate-specific antigen values. Urology 1993; 42:390-397

574.   Wenzl TB, Riehmann M, Cook TD, Bruskewitz RC. Variation in PSA values in patients without malignancy. Urology 1998; 52:932

575.   Carter HB, Pearson JD. PSA velocity for the diagnosis of early prostate cancer. A new concept. Urol Clin North Am 1993; 20:665-670

576.   Carter HB, Pearson JD, Waclawiw Z, Metter EJ, Chan DW, Guess HA, Walsh PC. Prostate-specific antigen variability in men without prostate cancer: effect of sampling interval on prostate-specific antigen velocity. Urology 1995; 45:591-596

577.   Fang J, Metter EJ, Landis P, Carter HB. PSA velocity for assessing prostate cancer risk in men with PSA levels between 2.0 and 4.0 ng/ml. Urology 2002; 59:889-893; discussion 893-884

578.   Bhasin S, Woodhouse L, Casaburi R, Singh AB, Mac RP, Lee M, Yarasheski KE, Sinha-Hikim I, Dzekov C, Dzekov J, Magliano L, Storer TW. Older men are as responsive as young men to the anabolic effects of graded doses of testosterone on the skeletal muscle. J Clin Endocrinol Metab 2005; 90:678-688

579.   Kathrins M, Doersch K, Nimeh T, Canto A, Niederberger C, Seftel A. The Relationship Between Testosterone-Replacement Therapy and Lower Urinary Tract Symptoms: A Systematic Review. Urology 2016; 88:22-32

580.   Wu FC, Farley TM, Peregoudov A, Waites GM. Effects of testosterone enanthate in normal men: experience from a multicenter contraceptive efficacy study. World Health Organization Task Force on Methods for the Regulation of Male Fertility. Fertil Steril 1996; 65:626-636

581.   Carter HB, Pearson JD, Metter EJ, Chan DW, Andres R, Fozard JL, Rosner W, Walsh PC. Longitudinal evaluation of serum androgen levels in men with and without prostate cancer. Prostate 1995; 27:25-31

582.   Fried W, Marver D, Lange RD, Gurney CW. Studies on the erythropoietic stimulating factor in the plasma of mice after receiving testosterone. J Lab Clin Med 1966; 68:947-951

583.   Rencricca NJ, Solomon J, Fimian WJ, Jr., Howard D, Rizzoli V, Stohlman F, Jr. The effect of testosterone on erythropoiesis. Scand J Haematol 1969; 6:431-436

584.   Naets JP, Wittek M. The mechanism of action of androgens on erythropoiesis. Ann N Y Acad Sci 1968; 149:366-376

585.   Dhindsa S, Ghanim H, Batra M, Kuhadiya ND, Abuaysheh S, Green K, Makdissi A, Chaudhuri A, Dandona P. Effect of testosterone on hepcidin, ferroportin, ferritin and iron binding capacity in patients with hypogonadotropic hypogonadism and type 2 diabetes. Clin Endocrinol (Oxf) 2016; 85:772-780

586.   Dobs AS, Meikle AW, Arver S, Sanders SW, Caramelli KE, Mazer NA. Pharmacokinetics, efficacy, and safety of a permeation-enhanced testosterone transdermal system in comparison with bi-weekly injections of testosterone enanthate for the treatment of hypogonadal men. J Clin Endocrinol Metab 1999; 84:3469-3478

587.   Bachman E, Feng R, Travison T, Li M, Olbina G, Ostland V, Ulloor J, Zhang A, Basaria S, Ganz T, Westerman M, Bhasin S. Testosterone suppresses hepcidin in men: a potential mechanism for testosterone-induced erythrocytosis. J Clin Endocrinol Metab 2010; 95:4743-4747

588.   Gagliano-Juca T, Pencina KM, Ganz T, Travison TG, Kantoff PW, Nguyen PL, Taplin ME, Kibel AS, Li Z, Huang G, Edwards RR, Nemeth E, Basaria S. Mechanisms Responsible for Reduced Erythropoiesis during Androgen Deprivation Therapy in Men with Prostate Cancer. Am J Physiol Endocrinol Metab 2018;

589.   Cistulli PA, Grunstein RR, Sullivan CE. Effect of testosterone administration on upper airway collapsibility during sleep. Am J Respir Crit Care Med 1994; 149:530-532

590.   Emery MJ, Hlastala MP, Matsumoto AM. Depression of hypercapnic ventilatory drive by testosterone in the sleeping infant primate. J Appl Physiol (1985) 1994; 76:1786-1793

591.   Schiavi RC, White D, Mandeli J. Pituitary-gonadal function during sleep in healthy aging men. Psychoneuroendocrinology 1992; 17:599-609

592.   Hoyos CM, Killick R, Yee BJ, Grunstein RR, Liu PY. Effects of testosterone therapy on sleep and breathing in obese men with severe obstructive sleep apnoea: a randomized placebo-controlled trial. Clin Endocrinol (Oxf) 2012; 77:599-607

593.   Matsumoto AM, Sandblom RE, Schoene RB, Lee KA, Giblin EC, Pierson DJ, Bremner WJ. Testosterone replacement in hypogonadal men: effects on obstructive sleep apnoea, respiratory drives, and sleep. Clin Endocrinol (Oxf) 1985; 22:713-721

594.   Schneider BK, Pickett CK, Zwillich CW, Weil JV, McDermott MT, Santen RJ, Varano LA, White DP. Influence of testosterone on breathing during sleep. J Appl Physiol (1985) 1986; 61:618-623

595.   Kirbas G, Abakay A, Topcu F, Kaplan A, Unlu M, Peker Y. Obstructive sleep apnoea, cigarette smoking and serum testosterone levels in a male sleep clinic cohort. J Int Med Res 2007; 35:38-45

596.   Luboshitzky R, Aviv A, Hefetz A, Herer P, Shen-Orr Z, Lavie L, Lavie P. Decreased pituitary-gonadal secretion in men with obstructive sleep apnea. J Clin Endocrinol Metab 2002; 87:3394-3398

597.   Gambineri A, Pelusi C, Pasquali R. Testosterone levels in obese male patients with obstructive sleep apnea syndrome: relation to oxygen desaturation, body weight, fat distribution and the metabolic parameters. J Endocrinol Invest 2003; 26:493-498

598.   Leproult R, Van Cauter E. Effect of 1 week of sleep restriction on testosterone levels in young healthy men. JAMA 2011; 305:2173-2174

599.   Luboshitzky R, Lavie L, Shen-Orr Z, Lavie P. Pituitary-gonadal function in men with obstructive sleep apnea. The effect of continuous positive airways pressure treatment. Neuro Endocrinol Lett 2003; 24:463-467

600.   Hoyos CM, Yee BJ, Phillips CL, Machan EA, Grunstein RR, Liu PY. Body compositional and cardiometabolic effects of testosterone therapy in obese men with severe obstructive sleep apnoea: a randomised placebo-controlled trial. Eur J Endocrinol 2012; 167:531-541

601.   Liu PY, Yee B, Wishart SM, Jimenez M, Jung DG, Grunstein RR, Handelsman DJ. The short-term effects of high-dose testosterone on sleep, breathing, and function in older men. J Clin Endocrinol Metab 2003; 88:3605-3613

602.   Swerdlow AJ, Schoemaker MJ, Higgins CD, Wright AF, Jacobs PA, Group UKCC. Cancer incidence and mortality in men with Klinefelter syndrome: a cohort study. J Natl Cancer Inst 2005; 97:1204-1210

603.   Morley JE, Charlton E, Patrick P, Kaiser FE, Cadeau P, McCready D, Perry HM, 3rd. Validation of a screening questionnaire for androgen deficiency in aging males. Metabolism 2000; 49:1239-1242

604.   T'Sjoen G, Goemaere S, De Meyere M, Kaufman JM. Perception of males' aging symptoms, health and well-being in elderly community-dwelling men is not related to circulating androgen levels. Psychoneuroendocrinology 2004; 29:201-214

605.   Smith KW, Feldman HA, McKinlay JB. Construction and field validation of a self-administered screener for testosterone deficiency (hypogonadism) in ageing men. Clin Endocrinol (Oxf) 2000; 53:703-711

606.   Bhasin S. Testosterone replacement in aging men: an evidence-based patient-centric perspective. J Clin Invest 2021; 131

607.   Seymour FI, Duffy C, Korner A. A Case of Authenticated Fertility in a Man, Aged 94. Journal of the American Medical Association 1935; 105:1423

608.   Plas E, Berger P, Hermann M, Pfluger H. Effects of aging on male fertility? Exp Gerontol 2000; 35:543-551

609.   Rolf C, Nieschlag E. Reproductive functions, fertility and genetic risks of ageing men. Exp Clin Endocrinol Diabetes 2001; 109:68-74

610.   New guidelines for the use of semen donor insemination: 1990. The American Fertility Society. Fertil Steril 1990; 53:1S-13S

611.   Practice Committee of American Society for Reproductive M, Practice Committee of Society for Assisted Reproductive T. 2008 Guidelines for gamete and embryo donation: a Practice Committee report. Fertil Steril 2008; 90:S30-44

612.   Silber SJ. Effect of Age on Male Fertility. Seminars in Reproductive Medicine 1991; 9:241-248

613.   Kidd SA, Eskenazi B, Wyrobek AJ. Effects of male age on semen quality and fertility: a review of the literature. Fertil Steril 2001; 75:237-248

614.   Sloter E, Nath J, Eskenazi B, Wyrobek AJ. Effects of male age on the frequencies of germinal and heritable chromosomal abnormalities in humans and rodents. Fertil Steril 2004; 81:925-943

615.   Wiener-Megnazi Z, Auslender R, Dirnfeld M. Advanced paternal age and reproductive outcome. Asian J Androl 2012; 14:69-76

616.   Fonseka KG, Griffin DK. Is there a paternal age effect for aneuploidy? Cytogenet Genome Res 2011; 133:280-291

617.   Lian ZH, Zack MM, Erickson JD. Paternal age and the occurrence of birth defects. Am J Hum Genet 1986; 39:648-660

618.   Brown AS, Schaefer CA, Wyatt RJ, Begg MD, Goetz R, Bresnahan MA, Harkavy-Friedman J, Gorman JM, Malaspina D, Susser ES. Paternal age and risk of schizophrenia in adult offspring. Am J Psychiatry 2002; 159:1528-1533

619.   Goriely A, McGrath JJ, Hultman CM, Wilkie AO, Malaspina D. "Selfish spermatogonial selection": a novel mechanism for the association between advanced paternal age and neurodevelopmental disorders. Am J Psychiatry 2013; 170:599-608

620.   Goriely A, Wilkie AO. Paternal age effect mutations and selfish spermatogonial selection: causes and consequences for human disease. Am J Hum Genet 2012; 90:175-200

621.   Lim J, Maher GJ, Turner GD, Dudka-Ruszkowska W, Taylor S, Rajpert-De Meyts E, Goriely A, Wilkie AO. Selfish spermatogonial selection: evidence from an immunohistochemical screen in testes of elderly men. PLoS One 2012; 7:e42382

622.   Wyrobek AJ, Eskenazi B, Young S, Arnheim N, Tiemann-Boege I, Jabs EW, Glaser RL, Pearson FS, Evenson D. Advancing age has differential effects on DNA damage, chromatin integrity, gene mutations, and aneuploidies in sperm. Proc Natl Acad Sci U S A 2006; 103:9601-9606

623.   Kong A, Frigge ML, Masson G, Besenbacher S, Sulem P, Magnusson G, Gudjonsson SA, Sigurdsson A, Jonasdottir A, Jonasdottir A, Wong WS, Sigurdsson G, Walters GB, Steinberg S, Helgason H, Thorleifsson G, Gudbjartsson DF, Helgason A, Magnusson OT, Thorsteinsdottir U, Stefansson K. Rate of de novo mutations and the importance of father's age to disease risk. Nature 2012; 488:471-475

624.   Olshan AF, Schnitzer PG, Baird PA. Paternal age and the risk of congenital heart defects. Teratology 1994; 50:80-84

625.   Frans EM, Sandin S, Reichenberg A, Langstrom N, Lichtenstein P, McGrath JJ, Hultman CM. Autism risk across generations: a population-based study of advancing grandpaternal and paternal age. JAMA Psychiatry 2013; 70:516-521

626.   Harlap S, Paltiel O, Deutsch L, Knaanie A, Masalha S, Tiram E, Caplan LS, Malaspina D, Friedlander Y. Paternal age and preeclampsia. Epidemiology 2002; 13:660-667

627.   Kimura M, Itoh N, Takagi S, Sasao T, Takahashi A, Masumori N, Tsukamoto T. Balance of apoptosis and proliferation of germ cells related to spermatogenesis in aged men. J Androl 2003; 24:185-191

628.   Luetjens CM, Rolf C, Gassner P, Werny JE, Nieschlag E. Sperm aneuploidy rates in younger and older men. Hum Reprod 2002; 17:1826-1832

629.   Fisch H, Hyun G, Golden R, Hensle TW, Olsson CA, Liberson GL. The influence of paternal age on down syndrome. J Urol 2003; 169:2275-2278

630.   Stene E, Stene J, Stengel-Rutkowski S. A reanalysis of the New York State prenatal diagnosis data on Down's syndrome and paternal age effects. Hum Genet 1987; 77:299-302

631.   Sloter ED, Marchetti F, Eskenazi B, Weldon RH, Nath J, Cabreros D, Wyrobek AJ. Frequency of human sperm carrying structural aberrations of chromosome 1 increases with advancing age. Fertil Steril 2007; 87:1077-1086

632.   Hellstrom WJ, Overstreet JW, Sikka SC, Denne J, Ahuja S, Hoover AM, Sides GD, Cordell WH, Harrison LM, Whitaker JS. Semen and sperm reference ranges for men 45 years of age and older. J Androl 2006; 27:421-428

633.   Eskenazi B, Wyrobek AJ, Sloter E, Kidd SA, Moore L, Young S, Moore D. The association of age and semen quality in healthy men. Hum Reprod 2003; 18:447-454

634.   Gallardo E, Simon C, Levy M, Guanes PP, Remohi J, Pellicer A. Effect of age on sperm fertility potential: oocyte donation as a model. Fertil Steril 1996; 66:260-264

635.   Jung A, Schuppe HC, Schill WB. Comparison of semen quality in older and younger men attending an andrology clinic. Andrologia 2002; 34:116-122

636.   Haidl G, Badura B, Hinsch KD, Ghyczy M, Gareiss J, Schill WB. Disturbances of sperm flagella due to failure of epididymal maturation and their possible relationship to phospholipids. Hum Reprod 1993; 8:1070-1073

637.   Handelsman DJ, Staraj S. Testicular size: the effects of aging, malnutrition, and illness. J Androl 1985; 6:144-151

638.   Handelsman DJ. Male reproductive ageing: human fertility, androgens and hormone dependent disease. Novartis Found Symp 2002; 242:66-77; discussion 77-81

639.   Johnson L, Zane RS, Petty CS, Neaves WB. Quantification of the human Sertoli cell population: its distribution, relation to germ cell numbers, and age-related decline. Biol Reprod 1984; 31:785-795

640.   Tulina N, Matunis E. Control of stem cell self-renewal in Drosophila spermatogenesis by JAK-STAT signaling. Science 2001; 294:2546-2549

641.   Black A, Lane MA. Nonhuman primate models of skeletal and reproductive aging. Gerontology 2002; 48:72-80

642.   Gruenewald DA, Naai MA, Hess DL, Matsumoto AM. The Brown Norway rat as a model of male reproductive aging: evidence for both primary and secondary testicular failure. J Gerontol 1994; 49:B42-50

643.   Wang C, Leung A, Sinha-Hikim AP. Reproductive aging in the male brown-Norway rat: a model for the human. Endocrinology 1993; 133:2773-2781

644.   Taylor GT, Weiss J, Pitha J. Epididymal sperm profiles in young adult, middle-aged, and testosterone-supplemented old rats. Gamete Res 1988; 19:401-409

645.   Oakes CC, Smiraglia DJ, Plass C, Trasler JM, Robaire B. Aging results in hypermethylation of ribosomal DNA in sperm and liver of male rats. Proc Natl Acad Sci U S A 2003; 100:1775-1780

646.   Zirkin BR, Santulli R, Strandberg JD, Wright WW, Ewing LL. Testicular steroidogenesis in the aging brown Norway rat. J Androl 1993; 14:118-123

647.   Wright WW, Fiore C, Zirkin BR. The effect of aging on the seminiferous epithelium of the brown Norway rat. J Androl 1993; 14:110-117

648.   Le Magueresse B, Jegou B. In vitro effects of germ cells on the secretory activity of Sertoli cells recovered from rats of different ages. Endocrinology 1988; 122:1672-1680

649.   Humphreys PN. The histology of the testis in aging and senile rats. Exp Gerontol 1977; 12:27-34

650.   Syntin P, Robaire B. Sperm structural and motility changes during aging in the Brown Norway rat. J Androl 2001; 22:235-244

651.   Tramer F, Rocco F, Micali F, Sandri G, Panfili E. Antioxidant systems in rat epididymal spermatozoa. Biol Reprod 1998; 59:753-758

652.   Edelmann P, Gallant J. On the translational error theory of aging. Proc Natl Acad Sci U S A 1977; 74:3396-3398

653.   Marden JH, Rogina B, Montooth KL, Helfand SL. Conditional tradeoffs between aging and organismal performance of Indy long-lived mutant flies. Proc Natl Acad Sci U S A 2003; 100:3369-3373

654.   Jones LS, Berndtson WE. A quantitative study of Sertoli cell and germ cell populations as related to sexual development and aging in the stallion. Biol Reprod 1986; 35:138-148

655.   Tenover JS, McLachlan RI, Dahl KD, Burger HG, de Kretser DM, Bremner WJ. Decreased serum inhibin levels in normal elderly men: evidence for a decline in Sertoli cell function with aging. J Clin Endocrinol Metab 1988; 67:455-459

656.   Bohring C, Krause W. Serum levels of inhibin B in men of different age groups. Aging Male 2003; 6:73-78

657.   Haji M, Tanaka S, Nishi Y, Yanase T, Takayanagi R, Hasegawa Y, Sasamoto S, Nawata H. Sertoli cell function declines earlier than Leydig cell function in aging Japanese men. Maturitas 1994; 18:143-153

658.   Kaler LW, Neaves WB. Attrition of the human Leydig cell population with advancing age. Anat Rec 1978; 192:513-518

659.   Neaves WB, Johnson L, Petty CS. Age-related change in numbers of other interstitial cells in testes of adult men: evidence bearing on the fate of Leydig cells lost with increasing age. Biol Reprod 1985; 33:259-269

660.   Paniagua R, Amat P, Nistal M, Martin A. Ultrastructure of Leydig cells in human ageing testes. J Anat 1986; 146:173-183

661.   Neaves WB, Johnson L, Porter JC, Parker CR, Jr., Petty CS. Leydig cell numbers, daily sperm production, and serum gonadotropin levels in aging men. J Clin Endocrinol Metab 1984; 59:756-763

662.   Nistal M, Santamaria L, Paniagua R, Regadera J, Codesal J. Multinucleate Leydig cells in normal human testes. Andrologia 1986; 18:268-272


Dyslipidemia in Chronic Kidney Disease

ABSTRACT

Chronic kidney disease (CKD) is associated with a dyslipidemia comprising high triglycerides, low HDL-cholesterol and altered lipoprotein composition. Cardiovascular diseases are the leading cause of mortality in CKD, especially in end stage renal disease patients. Thus, therapies to reduce cardiovascular risk are urgently needed in CKD. Robust clinical trial evidence has found that use of statins in pre-end stage CKD patients, as well as in renal transplant recipients, can decrease cardiovascular events; however, providers need to be aware of dose restrictions for statin therapy in CKD subjects. Furthermore, statin therapy does not reduce cardiovascular events in dialysis patients, nor does statin therapy confer any protection against progression of renal disease. Niacin and fibrates are effective in lipid lowering in CKD and appear to have some cardiovascular benefit but further study is needed to clearly define their role. Novel therapies with PCSK 9 inhibitors, bempedoic acid, and inclisiran have all been shown to decrease LDL cholesterol levels but there is currently limited data for reduction of cardiovascular events or mortality in patients with CKD/ESRD. This article reviews the epidemiology of CKD, association of CKD with cardiovascular events, and the effects of CKD on lipid levels and metabolism. The article discusses clinical trial evidence for and against statin and non-statin lipid lowering therapy in CKD patients.

CHRONIC KIDNEY DISEASE (CKD) EPIDEMIOLOGY

Chronic kidney disease (CKD) is defined as renal impairment greater than 3 months duration that results in an estimated glomerular filtration rate (eGFR) < 60ml/min/1.73m2. CKD is classified into 5 stages based on the eGFR (Table 1). CKD is a world-wide health problem with rising incidence and prevalence. CKD, especially in the early stages is often asymptomatic; thus, the actual prevalence may be even higher than estimated. End stage renal disease (ESRD) is defined as needing dialysis or transplant, and the prevalence and incidence of ESRD have doubled over the past 10 years (1). The annual mortality rate of dialysis patients is greater than 20%. The burden of co-morbidities and the cost of caring for CKD patients is high, and thus a major focus is increased screening and early detection of CKD when interventions to delay or prevent progression to ESRD may be effective. There are multiple causes of CKD with the most common causes in Westernized nations being hypertension and diabetes; however, a wide range of etiologies including infectious, auto-immune, genetic, obstructive, and ischemic injury are all prevalent. There are ethnic differences in susceptibility with increased prevalence in Mexican-Americans and non-Hispanic blacks compared to Caucasians (2).

Table 1. Stages of CKD

CKD stage

GFR (ml/min/1.73 m2)

CKD 1

≥ 90 (with renal damage or injury)

CKD 2 (mild)

60-89

CKD 3 (moderate)

30-59

CKD 4 (severe)

15-29

CKD 5 (end stage)

<15, dialysis, or transplant

While the burden of CKD itself is significant, the leading causes of morbidity and mortality in CKD are cardiovascular diseases (CVD), primarily atherosclerotic coronary artery disease. Risk factors for CVD in CKD include the traditional risk factors – hypertension, sex, age, smoking, and family history and CKD patients appear to benefit similar to non-CKD patients from therapies targeting these risk factors. Regardless of the cause of CKD, patients with CKD are at increased risk for CVD, which has led to the National Kidney Foundation classifying all patients with CKD as “highest risk” for CVD regardless of their levels of traditional CVD risk factors. The focus of this chapter is on the dyslipidemia of CKD and the risk of CVD in CKD.

Nephrotic Syndrome

Nephrotic syndrome differs from other types of CKD in its presentation and risks. Nephrotic syndrome is comprised of significant proteinuria (typically > 3g/24h), hypoalbuminemia, peripheral (+/- central) edema, and significant hyperlipidemia and lipiduria may also be seen. It is frequently seen in children, and the etiology includes minimal change disease (up to 85%), focal segmental glomerulosclerosis (up to 15%), and secondary causes (rare) including systemic lupus erythematosus, Henoch Schonlein Purpura, or membrano-proliferative glomerulopathy. In adults, the etiology is more likely to involve a systemic disease such as diabetes, amyloidosis, or lupus. Nephrotic syndrome may be transient or persistent. Most (approximately 80% of children) cases of nephrotic syndrome are successfully treated with glucocorticoids with resolution of all features including hyperlipidemia; however, steroid-resistant nephrotic syndrome patients often have persistent dyslipidemia, which may place them at increased risk for CVD. For example, a small study found increased CVD markers including pulse wave velocity, carotid artery intima-media thickness, and left ventricular mass in patients with steroid-resistant nephrotic syndrome compared to controls (3), implying increased risk for CVD events. Treatment of nephrotic syndrome dyslipidemia includes therapies specifically targeting the renal disease (primarily glucocorticoids, but also renin-angiotensin system antagonists which can help decrease proteinuria) and lipid lowering agents.

 CVD IN CKD

CVD accounts for 40-50% of all deaths in ESRD patients, with CVD mortality rates approximately 15 times that seen in the general population (4). However, CVD is highly prevalent in patients who progress to ESRD implying that earlier stages of CKD increase the development of CVD. A number of factors have been proposed as risk factors for CVD in CKD including proteinuria, inflammation, anemia, malnutrition, oxidative stress, and uremic toxins (5). Ongoing research is investigating whether these (and other) markers may be therapeutic targets. Interestingly, proteinuria correlates with blood pressure, total cholesterol, triglycerides, and inversely correlates with HDL-cholesterol (6). Thus, it remains unclear if proteinuria itself is a risk factor (e.g., a cause of CVD) or a biomarker. Meta-analyses of general population and high-risk population cohorts found that both lower eGFR (<60 ml/min/1.73 m2) and higher albuminuria (>10 mg/g creatinine) are predictors of total mortality and CVD mortality; furthermore, eGFR and albuminuria are independent of each other and of traditional CVD risk factors (7, 8). Estimated GFR > 60 ml/min/1.73 m2 is not a risk factor for CVD or total mortality.

Dyslipidemia in CKD

EFFECT OF CKD ON LIPID LEVELS

CKD is associated with a dyslipidemia comprised of elevated triglycerides and low HDL-cholesterol. Levels of LDL-cholesterol (and thus, total cholesterol) are generally not elevated; however, proteinuria correlates with cholesterol and triglycerides. CKD leads to a down regulation of lipoprotein lipase and the LDL-receptor, and increased triglycerides in CKD are due to delayed catabolism of triglyceride rich lipoproteins, with no differences in production rate (9). CKD is associated with lower levels of apoA-I (due to decreased hepatic expression (10)) and higher apoB/apoA-I. Decreased lecithin-cholesterol acyltransferase (LCAT) activity and increased cholesteryl ester transfer protein (CETP) activity contribute to decreased HDL-cholesterol levels. Beyond decreased HDL cholesterol levels, the HDL in CKD is less effective in its anti-oxidative and anti-inflammatory functions [for review see (11)].

As CKD progresses the dyslipidemia often worsens. In an evaluation of 2001-2010 National Health and Nutrition Examination Survey (NHANES), the prevalence of dyslipidemia increased from 45.5% in CKD stage 1 to 67.8% in CKD stage 4; similarly, the use of lipid lowering agents increased from 18.1% in CKD stage 1 to 44.7% in CKD stage 4 (12).  Of more than 1000 hemodialysis patients studied only 20% had “normal” lipid levels (defined as LDL<130 mg/dl, HDL > 40 and triglycerides < 150); of 317 peritoneal dialysis patients only 15% had “normal” lipid levels (13). A larger study evaluating dyslipidemia in > 21,000 incident dialysis patients found 82% prevalence of dyslipidemia and suggested a threshold of non-HDL cholesterol > 100 mg/dl (2.6mmol/L) to identify dyslipidemia in CKD stage 5 subjects (14). Peritoneal dialysis is associated with higher cholesterol levels than hemodialysis, although the reasons aren’t fully understood. In subjects who switched from peritoneal dialysis to hemodialysis there was a drop in cholesterol levels of almost 20% following transition (15). The National Kidney Foundation recommends routine screening of all adults and adolescents with CKD using a standard fasting lipid profile (total cholesterol, LDL-cholesterol, HDL-cholesterol and triglycerides), and follows the classification of the National Cholesterol Education Panel for levels (desirable, borderline or high). Although some studies have found associations between Lp(a) and dialysis patients, this is not well defined and there is no current indication for routine screening of Lp(a).

EFFECT OF CKD ON LIPOPROTEIN COMPOSITION

Beyond simply measuring lipid levels, emerging evidence implies that lipoprotein particle size and composition is altered in CKD, with increased small dense LDL and decreased larger LDL particles in CKD subjects compared to controls (16). Small dense LDL is thought to be more atherogenic than larger LDL particles. An emerging theory is that beyond lipid levels or lipoprotein size, lipoprotein particle “cargo” can affect atherosclerosis development and progression. Lipoprotein particles transport numerous bioactive lipids, microRNAs, other small RNAs, proteins, hormones, etc. For example, a recent study compared LDL particle composition between subjects with stage 4/5 CKD and non-CKD controls, and found similar total lipid and cholesterol content, but altered content of various lipid subclasses; for example decreased phosphatidylcholines, sulfatides, and ceramides and increased N-acyltaurines (17). Many of these lipid species are known to have either pro- or anti-atherogenic properties and thus could directly affect atherogenesis.

EFFECT OF RENAL TRANSPLANTATION ON LIPID LEVELS

Dyslipidemia is frequently seen in renal transplant recipients, including increased total cholesterol, LDL-cholesterol, and triglycerides, and decreased HDL-cholesterol. The dyslipidemia may have existed pre-transplant or be related to transplantation associated factors. Cyclosporine increases LDL-cholesterol via both increased production and decreased clearance. Corticosteroids increase both cholesterol and triglyceride levels in a dose-dependent manner. The adverse effects of cyclosporine and corticosteroids on lipid levels appear to be additive (18). Tacrolimus and azathioprine appear to have less induction of dyslipidemia than cyclosporine (19). Sirolimus increases both cholesterol and triglycerides, in part due to decreased LDL-clearance (20).

EFFECT OF NEPHROTIC SYNDROME ON LIPID LEVELS

The dyslipidemia in nephrotic syndrome can be striking with significant elevations of cholesterol, LDL-cholesterol, triglycerides, and lipoprotein(a); HDL cholesterol is often low, especially HDL2. The cause of elevated lipid levels is multi-factorial, including reduction in oncotic pressure which stimulates apoB synthesis (although the exact mechanism by which this occurs is not known), decreased metabolism of lipoproteins, and decreased clearance. Patients with nephrotic syndrome have decreased LDL-receptor activity and increased acyl-CoA cholesterol acytransferase (ACAT) and HMG-CoA reductase activity leading to increased LDL-cholesterol levels (21, 22). Low HDL-cholesterol is thought to be due at least in part to LCAT deficiency secondary to accelerated renal loss of LCAT (23). Triglycerides are elevated due to impaired clearance of chylomicrons and triglyceride-rich lipoproteins, as well as increased triglyceride production (24).

EVIDENCE FOR/AGAINST LIPID LOWERING THERAPY IN CKD FOR CVD OUTCOMES

Given the high prevalence of CVD in CKD, and the robust clinical evidence in non-CKD subjects that lipid lowering reduces CVD outcomes, there is great interest in using lipid lowering therapy in CKD subjects. Statins are the most commonly used lipid-lowering medications and thus far have been shown to reduce CVD events and/or mortality in virtually every population studied. However, CKD patients seem to be a unique population in that at present there is no evidence of benefit for CVD outcomes in dialysis patients with statin therapy. The Canadian Journal of Cardiology lists CKD as a statin indicated condition in its newest guidelines published in 2021 (25) while AHA/ACC lists CKD as a risk enhancer but not a high-risk condition based on 2018 guidelines (26).  Despite growing evidence to support CKD as a CVD risk equivalent, the use of statin therapy in CKD does not appear to be rising more than in the non-CKD population based on data from Mefford et al looking at trends in statin use amongst US adults with CKD from 1999-2014 (27). As discussed below it appears that statins can reduce CVD events in pre-end stage CKD subjects, and in post-renal transplant subjects, but not in dialysis patients (Table 2).

Use of Statins in Pre-ESRD CKD Patients

Although many of the initial statin CVD studies did not include many CKD patients, evidence from sub-group analyses of large statin studies suggested that CKD subjects had similar benefits to non-CKD individuals. For example, the Heart Protection Study (HPS) which assessed >20,000 subjects at high risk of CVD included a subgroup of 1329 subjects with impaired kidney function. In this subgroup those that received simvastatin had a 28% proportional risk reduction and an 11% absolute risk reduction of a major cardiovascular event compared to those randomized to placebo; similar to the effect on the overall cohort (28). Further, in the Pravastatin Pooling Project, 4,991 subjects with CKD3 were examined and a 23% reduction in cardiovascular events was seen in the pravastatin group (29).  In a retrospective study with 47,200 subjects followed through the Department of Veterans Affairs, starting statin therapy 12 months prior to transitioning to ESRD conferred a reduction in 12-month all-cause mortality (HR 0.79), cardiovascular events (HR 0.83) and hospitalization rate (HR 0.89) (30). Several other studies or meta-analyses similarly predicted that CKD subjects would have reduction in CVD with statin therapy. For example, a meta-analysis of 38 studies with >37,000 participants with CKD but not yet on dialysis found a consistent reduction in major cardiovascular events, all-cause mortality, cardiovascular death, and myocardial infarction in statin users compared to placebo groups. There was no clear effect of statin on stroke, nor was there any effect of statin use on progression of the renal disease (31). Thus, for CKD patients with pre-end stage renal disease statins effectively lower total cholesterol and LDL-cholesterol levels and decrease CVD risk. The different statins have different degrees of renal involvement in their metabolism, and providers should be aware of dose restrictions in CKD (Table 3).

Unclear Whether to Use Statins in Subjects with Nephrotic Syndrome

Several small clinical studies have investigated the use of lipid lowering therapies in nephrotic syndrome, but data is only available for statins and fibrates, and no CVD outcomes data is available. Several small studies using statins have found efficacy in lowering LDL-cholesterol, and that statins were safe and well tolerated (32, 33). Thus, the use of statins in nephrotic syndrome appears to be safe and efficacious in terms of lipid lowering; however, it is not clear if there is any corresponding benefit on either CVD or renal outcomes.

No Benefit to Statins in Subjects with only Microalbuminuria

The Prevention of Renal and Vascular Endstage Disease Intervention Trial (PREVEND IT) randomized 864 subjects with persistent microalbuminuria (urinary albumin of 15-300mg/24h x 2 samples) to fosinopril (an angiotensin converting enzyme inhibitor) or placebo and to pravastatin 20 mg or placebo. Inclusion criteria for the study included blood pressure <160/100 mm Hg and no use of antihypertensive medications and total cholesterol < 300 mg/dl (8 mmol/L) or < 192 mg/dl (5 mmol/L) if patient had known CVD and no use of lipid lowering medications. Although diabetes was not an exclusion criteria, <3% of the subjects had diabetes (34). The use of statin did not affect either urinary albumin excretion or cardiovascular events; however, the use of fosinopril significantly decreased albuminuria and had a trend to reduction in cardiovascular events. Thus, in the absence of other indications for statin therapy, there appears to be no benefit in subjects that solely have microalbuminuria. However, a subsequent analysis found that the subjects with isolated microalbuminuria had an increased risk for CVD events and mortality compared to those without risk factors (35); thus, isolated microalbuminuria appears to indicate high risk and further study is needed to determine effective therapies to reduce risk.

No Benefit to Statins in Dialysis Patients

Studies specifically examining the role of statins in ESRD subjects have not found a benefit. The Deutsche Diabetes Dialyse Studie (4D) randomized 1255 type 2 diabetic subjects on maintenance hemodialysis to either 20 mg atorvastatin or placebo daily. The cholesterol and LDL-cholesterol reduction was similar to that seen in non-dialysis patients; however, unlike non-CKD subjects there was no significant reduction in cardiovascular death, nonfatal myocardial infarction or stroke with atorvastatin compared to placebo (36). A long-term follow-up of the 4D study population found similar effects after 11.5 years as were found at the end of the original study: no CVD benefit, but also no evidence of harm (37). Similarly, A Study to Evaluate the Use of Rosuvastatin in Subjects on Regular Hemodialysis (AURORA) randomized 2776 subjects on maintenance hemodialysis to rosuvastatin 10 mg or placebo. Again, the LDL-cholesterol lowering in dialysis patients was similar to that seen in other studies in non-dialysis patients, but there was no significant effect on the primary endpoint of cardiovascular death, nonfatal myocardial infarction or stroke (38). The Study of Heart and Renal Protection (SHARP) randomized 9270 CKD patients (3023 on dialysis) to simvastatin plus ezetimibe versus placebo. Unlike 4D and AURORA, the SHARP study did report a significant reduction in major atherosclerotic events in the simvastatin plus ezetimibe group, including the dialysis subgroup (39). However, a meta-analysis of 25 studies involving 8289 dialysis patients found no benefit of statin therapy on major cardiovascular events, cardiovascular mortality, all-cause mortality or myocardial infarction, despite efficacious lipid lowering (40). Nevertheless, a post-hoc analysis of the 4D study did demonstrate a benefit of statin therapy in the subgroup that had LDL cholesterol > 145 mg/dl (3.76mmol/l) (41). Although the use of statins in dialysis patients does not clearly cause harm, at present there is no indication for use in dialysis patients, with the exception of a possible benefit in those with significant elevation in LDL-cholesterol.

WHY IS STATIN THERAPY INEFFECTIVE IN DIALYSIS SUBJECTS?

Given the robust data demonstrating statin efficacy in CVD risk reduction in virtually all other populations studied, the lack of efficacy in ESRD subjects in perplexing. However, it may be due to different mechanisms of disease progression in ESRD populations compared to other populations. In ESRD subjects there is increased inflammation and oxidative stress as well as increased non-lipid-associated pro-atherogenic factors, which may be the major cause of atherosclerosis development or progression in CKD subjects [for review see (42)]. Therefore, the relative impact of dyslipidemia on CVD development and progression in ESRD subjects may be less than in other CKD and non-CKD subjects, and thus the potential benefit of lipid lowering therapy is reduced. In ESRD subjects with significant hyperlipidemia (such as genetic hyperlipidemias) there may still be a role for statins, or other lipid lowering therapies. Furthermore, while no benefit has been found for statins in dialysis subjects, there is no evidence of increased harm, and thus consideration of lipid lowering medications in particular individuals with ESRD is warranted.

Use of Statins in Renal Transplant Recipients

The Assessment of Lescol in Renal Transplant (ALERT) study randomized 2102 renal transplant recipients to fluvastatin or placebo. There was a non-significant 17% reduction in the combined primary endpoint (cardiac mortality, nonfatal myocardial infarction or coronary intervention procedures) but a significant reduction in cardiac death or myocardial infarction (43, 44). Furthermore, a post hoc analysis suggested that earlier initiation of statins post-transplant was associated with greater benefit (45). However, a recent small study found no benefit of statin therapy on coronary calcification in renal transplant patients (46). Furthermore, as with pre-end stage CKD patients there did not appear to be any benefit from statin therapy on progression of renal disease or graft loss in statin treated transplant recipients (47). Thus, following renal transplant patients should be considered for statin therapy for CVD risk reduction, but not for graft preservation. Several of the statins have drug interactions, particularly with cyclosporine, thus providers must be aware of dose and drug restrictions (Table 3).

Table 2. Use of Statins in Various CKD Subgroups

Patient population

Statin indicated? Yes/no

Microalbuminuria*

No

CKD 1-4

Yes

Nephrotic syndrome

Unclear

Dialysis patients

No

Renal transplant recipients

Yes

* In the absence of any other indication

EVIDENCE FOR/AGAINST LIPID LOWERING THERAPY IN CKD FOR RENAL OUTCOMES

Given the evidence that renal lipid deposition is associated with progression of renal disease itself, there has been an ongoing interest in whether targeting dyslipidemia in CKD can help delay the progression of the renal disease. The dyslipidemia in CKD is associated not only with increased CVD but also with adverse renal prognosis (48, 49). Biopsy studies have found that the amount of renal apoB/apoE is correlated with increased progression of the renal disease itself (50). Animal studies have supported this concept. A meta-analysis of several small, older studies suggested that the rate of decline in GFR was decreased in subjects receiving a lipid-lowering agent (the included studies mainly used statins but the meta-analysis also included a study using gemfibrozil and another using probucol) (51). However, the relationship between lipid levels and renal disease is unclear, as prospective cohort studies have not found any relationship of lipid levels to progression of kidney disease (52). Furthermore, the SHARP study, which included subjects with earlier stages of CKD (stages 3-5 were included) found no benefit of lipid lowering therapy on the progression of renal disease. A meta-analysis of statins in pre-end stage CKD patients found no overall effect of statins on renal disease progression (31) and the ALERT study found no benefit of statin use on renal graft or renal disease parameters (47). Thus, there does not appear to be any use for statins to improve renal function or CKD itself.

SAFETY OF STATINS IN CKD

Statin Safety– Renal Outcomes

An observational study using administrative databases containing information on > 2 million patients suggested that the use of high potency statins was associated with acute kidney injury, especially within the first 120 days of statin use (53). However, a subsequent analysis of 24 placebo-controlled statin studies and 2 high versus low-dose statin studies found no evidence of renal injury from statin use (54). These discrepant results can be explained by the quality of the data: in randomized controlled trials, albeit not designed or powered to look at renal injury, data quality tends to be higher than that in administrative data sets, which often contain bias for selection, ascertainment, and classification. Furthermore, statins appear to have a nephron-protective role in the prevention of contrast induced acute kidney injury. A meta-analysis of 15 trials examining the effect of statin pre-treatment before coronary angiography found a significant reduction in acute kidney injury in those treated with high dose statin compared to controls treated with either placebo or low dose statin (55). One study specifically examined the use of statins in subjects with diabetes and existing CKD undergoing angiography, and found a benefit to statin pre-treatment in reducing the risk of contrast induced acute renal injury (56). As discussed above, use of statins in pre-end stage CKD or post-renal transplant patients demonstrates neither benefit nor harm on renal outcomes. Thus, based on available evidence there does not seem to be any renal harm from statin use, and the presence of CKD should not be a contra-indication to statin use, although some statins require dose restrictions in CKD (Table 3).

Statin Safety – Diabetes Outcomes

As a class, emerging evidence demonstrates that statins increase new diagnoses of diabetes (57). As diabetes can lead to or exacerbate renal injury, this is another potential harm of statins. However, there is no evidence that statin therapy acutely raises normal fasting glucose into the diabetic range and rather the evidence from clinical trials suggests that statin therapy instead leads individuals at high risk of diabetes to progress to diabetes diagnosis sooner than may have happened without statin therapy. A subsequent meta-analysis of 5 statin trials with >32,000 patients without diabetes at baseline found that high dose statin was associated with increased risk for new diabetes diagnosis compared to low or moderate dose statin therapy (58). However, the number needed to harm (induce diabetes) is 498 whereas the number needed to treat (prevent cardiovascular events) is 155 for intensive statin therapy; implying that despite the increased risk of new onset diabetes, statin therapy’s benefits outweigh the risks.

Which Statins to Use in CKD?

The various statins have different degrees of renal clearance; thus, with CKD patients it is important to be aware of the metabolism of the agent of interest and understand if/when dose adjustments are needed. Most statins are primarily metabolized through hepatic pathways, and dose adjustment in early CKD is typically not needed (eGFR> 30 ml/min). However, with more advanced CKD, eGFR< 30 ml/min (or ESRD, although statins are not indicated in this population) most agents have maximum dose restrictions (Table 3). 

Table 3. Statin Dosing in CKD

Statin

Usual dose range (mg/d)

Clearance route

Dose range for CKD stages1-3

Dose range for CKD stages4-5

Use with cyclosporine

Atorvastatin

10-80

Liver

10-80

10-80

Avoid use with cyclosporine

Fluvastatin

20-80

Liver

20-80

20-40

Max dose 20 mg/d with cyclosporine

Lovastatin

10-80

Liver

10-80

10-20

Avoid use with cyclosporine

Pitavastatin

1-4

Liver/Kidney

1-2

1-2

Avoid use with cyclosporine

Pravastatin

10-80

Liver/Kidney

10-80

10-20

Max dose 20 mg/d when used with cyclosporine

Rosuvastatin

10-40

Liver/Kidney

5-40

5-10

Max dose 5 mg/d with cyclosporine

Simvastatin

5-40

Liver

5-40

5-40

Avoid use with cyclosporine

BEYOND STATINS

There has been relatively little research into the use of non-statin lipid lowering agents in CKD. There is an emerging interest in niacin in CKD patients for its phosphorus-lowering effects, and niacin has similar lipid-altering efficacy in CKD as opposed to non-CKD subjects. Fibrates are metabolized via the kidney and thus generally contraindicated in CKD. Ezetimibe has been shown to be safe and effective in reducing LDL for patients with CKD; however, studies have typically compared treatment with ezetimibe added to statin therapy vs control and few studies compare ezetimibe monotherapy vs control.  PCSK9-inhibitors have been shown to be safe in CKD and efficacious in lowering LDL but there remains limited data regarding morbidity and mortality outcomes with this therapy.  Newer therapies include bempedoic acid and inclisiran which both remain relatively unstudied in CKD/ESRD. The following sections summarize the available data on the use of other lipid lowering agents in CKD (Table 4).

Niacin

As niacin is not cleared via the kidney it is theoretically safe in CKD; however, its use is limited due to side effects (predominantly flushing) and a lack of data. Several short-term studies have evaluated niacin in CKD patients and it is efficacious in lipid lowering. There is an emerging interest in use of niacin or its analog niacinimide in CKD and ESRD patients for their effects to decrease phosphate levels. A meta-analysis of randomized controlled trials of niacin and niacinamide in dialysis patients found that niacin reduced serum phosphorus but did not change serum calcium levels; furthermore niacin increased HDL levels but had no significant effect on LDL-cholesterol, triglycerides, or total cholesterol levels; no CVD outcomes data were provided (59). Animal studies have suggested a beneficial effect of niacin on renal outcomes (60), and clinical literature is suggestive that this may occur in humans (61). Kang et al treated patients with CKD stages 2-4 with niacin 500mg/d x 6 months; niacin led to increased HDL-cholesterol and decreased triglyceride levels, and improved GFR compared to baseline levels (62). Laropiprant has been developed as an inhibitor of prostaglandin-medicated niacin-induced flushing. In a sub-study examining the use of niacin with laropiprant in dyslipidemic subjects with impaired renal function, the use of niacin resulted in a mean decrease in serum phosphorus of 11% with similar effects between those with eGFR above or below 60 ml/min/1.73 m2 (63); the parent study reported significant reduction in lipid parameters including a decrease in LDL-cholesterol of 18%, decrease in triglycerides of 25%, and an increase in HDL of 20% (64). Thus, there may be an indication for use of niacin in CKD subjects beyond lipid lowering considerations. However, cardiovascular outcome studies evaluating the combination of statin plus niacin have not found any additional benefit compared to statin alone (65, 66); thus, at this time further research is needed in CKD subjects to determine if niacin may be more beneficial than statins, or if the addition of niacin to statin may confer non-CVD benefit, for example, from phosphorus lowering.

Fibrates

Fibric acid derivatives are used primarily to raise HDL-cholesterol and lower triglycerides; thus, they target two major components of CKD associated dyslipidemia. However, fibrates are known to decrease renal blood flow and glomerular filtration and they are cleared renally (67); therefore, there is significant concern regarding their use in CKD. Furthermore, the fibric acid derivatives raise serum creatinine levels and may thus trigger medical investigations into renal disease progression. Thus, there is concern regarding their use in CKD. However, there is a potential for fibric acid derivatives to improve both CVD and CKD outcomes. The acute changes in serum creatinine do not necessarily indicate adverse renal effects. A meta-analysis (68)  examined the use of fibrates in CKD subjects and reported beneficial effects to reduce total cholesterol and triglyceride levels and raise HDL-cholesterol levels with no effect on LDL-cholesterol levels. In addition, 3 trials reporting on > 14,000 patients reported that fibrates reduced risk of albuminuria progression in diabetic subjects, with 2 trials (>2,000 patients) reporting albuminuria regression (69-71). This was associated with a reduction in major cardiovascular events, CVD death, stroke, and all-cause mortality in subjects with moderate renal dysfunction, but not in those with eGFR > 60 ml/min/1.73m2.  Thus, despite the elevations in serum creatinine seen with fibrates, there is the potential for both cardiac and renal benefit, and further studies specifically designed to evaluate these outcomes in CKD subjects are urgently needed. At this point, providers are encouraged to consider fibrate therapy for appropriate subjects, especially if statins are not tolerated or are contra-indicated.

Ezetimibe

Ezetimibe is presently the only member of the class of cholesterol absorption inhibitors. As monotherapy it can lower LDL approximately 15%; however, the majority of research has examined ezetimibe in combination with a statin (primarily simvastatin) where the addition of ezetimibe can induce a further 25% lowering of LDL cholesterol. Ezetimibe is metabolized through intestinal and hepatic metabolism, and does not require any dose adjustment in CKD or ESRD, making it potentially attractive therapy in CKD. The Improved Reduction of Outcomes: Vytorin Efficacy International Trial (IMPROVE IT) study demonstrated that the combination of statin + ezetimibe led to further LDL lowering and improved CVD outcomes compared to statin alone in high-risk patients (72).  A secondary analysis of this study evaluating outcomes based on eGFR shows that compared to statin alone, the combination of statin + ezetimibe was more effective in reducing risk of CVD outcomes in those with eGFR < 60/ml/min/1.73m2(73). The Study of Heart and Renal Protection (SHARP) compared CVD and renal effects in CKD patients treated with statin + ezetimibe versus placebo. There was a reduction in CVD events (39); however, there was no effect on renal disease progression (74). Note, neither of these studies included an ezetimibe only arm; thus, the effects of ezetimibe monotherapy on outcomes are unknown, although it can be expected to reduce CVD events in proportion to its degree of LDL-cholesterol lowering. A small study evaluating ezetimibe monotherapy in CKD patients found it safe and effective (75). Thus, the use of ezetimibe with or without statin is likely to benefit pre-end stage CKD patients in terms of CVD outcomes (given that the impact of ezetimibe is on lowering LDL-cholesterol we can anticipate lack of CVD benefit in ESRD subjects based on the statin studies and SHARP).

Fish Oil

Omega-3 polyunsaturated fatty acids can lower triglyceride levels, making them a potential therapy in CKD. The role of fish oil/ omega-3 supplements in the general population for prevention of CVD events remains unclear, with some studies suggesting benefit but others finding no CVD protection. A recent meta-analysis found no evidence for CVD protection (76) while a meta-analysis of thirteen randomized control trials involving 127,477 patients demonstrated marine omega-3 supplementation was associated with small but significantly lower risk of MI, CHD death, total CHD, CVD death and total CVD with linear relationship to dose (77).  In CKD patients there is little data to support the use of fish oil and much of the data it is conflicting. A small randomized study evaluated omega-3 fish oil supplements, coenzyme Q10, or both in subjects with CKD stage 3 for 8 weeks. The group that received the omega-3 supplements had decreased heart rate and blood pressure and triglycerides, but there was no effect on renal function (eGFR, or albuminuria) (78). Conversely, a study evaluating dietary omega-3 intake found that higher consumption was associated with reduced likelihood of CKD (79). A randomized controlled trial in patients with CKD and microalbuminuria showed that omega-3 fatty acid supplementation had no effect on urine albumin excretion; however, there was a beneficial effect on serum triglyceride levels and pulse wave velocity (80). Fish oil supplementation has not been found to have any clear benefit on hemodialysis arteriovenous graft function (81, 82)or on cardiovascular events or mortality in hemodialysis patients (83). Thus, there is no clear benefit to the use of fish oil supplements in CKD, but further research is needed.

Bile Acid Resins

The bile acid resins tend to be used less commonly than other classes of lipid lowering agents overall, and their use in CKD is limited by a lack of data. Bile acid resins as a class can lower LDL-cholesterol by 10-20% so they are less effective than statins; furthermore, they can raise triglyceride levels and their use is contra-indicated with elevated triglyceride levels, for example > 400-500 mg/dl (>4.5 – 5.6 mmol/L). Thus, overall bile acid resins are rarely used in CKD patients. However, their metabolism is intestinal and thus there are no required modifications for their use in mild-moderate CKD. Although there are no theoretical concerns regarding their use in ESRD there is no data to address safety or efficacy.

PCSK9 Inhibitors

Monoclonal antibodies against proprotein convertase subtilisin/kexin type 9 (PCSK9) have been developed and approved for patients for patients with clinical atherosclerotic CVD not meeting lipid goals despite maximally tolerated statin therapy. This class of drugs lowers LDL-C in addition to statin-mediated lowering and has been shown to decrease CVD events in outcome studies in secondary prevention populations (84). Two PCSK9 monoclonal antibody inhibitors are presently available in the US – evolucumab and alirocumab. PCSK9 plasma levels are not influenced by eGFR in CKD patients (85) but are increased in nephrotic syndrome (86). As monoclonal antibodies the inhibitors are not cleared by the kidney and thus are approved to use in CKD and ESRD with no dose adjustment. The ODYSSEY OUTCOME trial randomized post-acute coronary syndrome patients with LDL > 70mg/dL to maximally tolerated statin with placebo vs alirocumab; the intervention arm with alirocumab had nearly twice the absolute reduction in cardiovascular events (87). Of note patients with eGFR < 30 ml/min/m2 were excluded from the ODYSSEY OUTCOME trial. However, a later subanalysis looked at the effect of alirocumab on major adverse cardiovascular events based on renal function. The subanalysis showed that irrespective of eGFR alirocumab was efficacious in reducing LDL. Further, annualized incidence rates of major adverse cardiovascular events and death increased with decreasing eGFR but rates were lower in the alirocumab group compared to placebo and there was no significant difference in incidence of major adverse cardiovascular events between treatment groups with eGFR < 60 ml/min/m2 (88).  Further, data from a pooled analysis of nine trials comparing alirocumab vs control showed that among patients with ASCVD and LDL > 100 mg/dL those with additional risk factors including CKD had the greatest absolute cardiovascular benefit from alirocumab therapy in addition to maximally tolerated statin compared to placebo (89).  Studies remain ongoing to further look at mortality and morbidity outcome in PCSK-9 inhibitors specifically in at risk patients such as those with CKD. There remains very limited data to use in patients with ESRD and PCSK-9 inhibitor use as monotherapy for dyslipidemia.

Bempedoic Acid

Currently approved for use in combination with maximally tolerated statin therapy, bempedoic acid facilitates further LDL reduction by inhibiting cholesterol synthesis in the liver through blocking adenosine triphosphate-citrate lyase (ACL).  Currently, use in CKD is approved without dosage adjustment for eGFR > 30ml/minute/1.73m2; however, below this eGFR threshold there is insufficient data to guide its use. As bempedoic acid has hepatic metabolism it is presumably safe in CKD.  A 52-week study in very high-risk CVD patients demonstrated that bempedoic acid added to maximally tolerated statin therapy was safe and led to a significant reduction in LDL levels (90).  Further, combination with ezetimibe is safe and can increase the cholesterol-lowering effect more than either agent alone when added to standard therapy (91). A cardiovascular outcome study is presently underway (92) but at this time there are limited data regarding mortality and morbidity benefit and use in ESRD.

Inclisiran

Newest to the market, inclisiran is a small interfering RNA (siRNA) that acts in hepatocytes to break down mRNA for PCSK-9 which increases LDL cholesterol receptor recycling thus increasing LDL cholesterol uptake. It is FDA approved for use in heterozygous familial hypercholesterolemia and in secondary prevention of cardiovascular events as an adjunct to lifestyle and maximally tolerated statin. It is administered by subcutaneous injections at 3 and then 6-month intervals. There are no cardiovascular outcomes studies yet available. There is no recommended dosage adjustment in CKD, but there have been no studies done in patients with ESRD. An analysis of the ORION-1 and ORION-7 studies compared inclisiran in patients with renal impairment and those with normal renal function, and found similar safety and efficacy, suggesting no dose adjustment is needed in CKD (93). However, no patients on dialysis were studied in these trials.

Table 4. Non-Statin Treatments

Agent

Usual dose range (mg/d)

Clearance route

Dose range for CKD stages1-3

Dose range for CKD stages4-5

Use with cyclosporine

Niaspan

500-2000

Hepatic/renal

No data

No data

No data

Gemfibrozil

1200

Renal

Avoid if creatinine > 2.0 mg/dl

Avoid if creatinine > 2.0 mg/dl

Cautious use

Fenofibrate

40-200

renal

40-60

avoid

Cautious use

Ezetimibe

10

Intestinal/hepatic

10

10

Cautious use

Colsevelam

3750 (6 x 625 mg tablets daily)

Intestinal

No change

unknown

May reduce levels of cyclosporine

Fish oil

4000


No change

Caution

No data

PCSK9 inhibitors

Alirocumab 75-150mg SC q 2 weeks

Evolocumab 140mg weekly SC - 420mg monthly SC

Unknown

No change

Not defined

No data

Bempedoic acid

180 mg daily

Hepatic

No change

Not defined

No data

Inclisiran

284 mg SC at 0 and 3 months then every 6 months

Nucleases

No change

Not defined

No data

SUMMARY

CVD is the leading cause of mortality in CKD, and as with the non-CKD population dyslipidemia is a significant contributor. The dyslipidemia of CKD comprises primarily high triglyceride levels and low HDL-cholesterol levels; however, emerging data suggests that the composition of the lipoprotein particles is altered by CKD, and that altered composition and/or lipoprotein cargo may be a cause of the increased CVD in CKD. The use of statins has been shown to be safe and efficacious in lipid lowering in CKD, and of benefit in reducing CVD events in individuals with pre-end stage CKD, or post renal transplant, but not in dialysis patients. The various available agents have different clearance routes, and some statins need dose adjustment in CKD. In patients that cannot tolerate or who have contra-indications to statin therapy, there may be some benefit from use of PCSK9 inhibitors, fibrates niacin or newer therapies such as bempedoic acid and inclisiran, but further studies are needed to better investigate their use.

REFERENCES

  1. National Kidney Foundation. 2012. KDOQI Clinical Practice Guideline for Diabetes and CKD: 2012 Update. Am J Kidney Dis 60: 850-886.
  2. Collins, A. J., R. N. Foley, B. Chavers, D. Gilbertson, C. Herzog, K. Johansen, B. Kasiske, N. Kutner, J. Liu, W. St Peter, H. Guo, S. Gustafson, B. Heubner, K. Lamb, S. Li, Y. Peng, Y. Qiu, T. Roberts, M. Skeans, J. Snyder, C. Solid, B. Thompson, C. Wang, E. Weinhandl, D. Zaun, C. Arko, S. C. Chen, F. Daniels, J. Ebben, E. Frazier, C. Hanzlik, R. Johnson, D. Sheets, X. Wang, B. Forrest, E. Constantini, S. Everson, P. Eggers, and L. Agodoa. 2012. 'United States Renal Data System 2011 Annual Data Report: Atlas of chronic kidney disease & end-stage renal disease in the United States. Am J Kidney Dis 59: A7, e1-420.
  3. Candan, C., N. Canpolat, S. Gokalp, N. Yildiz, P. Turhan, M. Tasdemir, L. Sever, and S. Caliskan. 2014. Subclinical cardiovascular disease and its association with risk factors in children with steroid-resistant nephrotic syndrome. Pediatric nephrology 29: 95-102.
  4. Foley, R. N., P. S. Parfrey, and M. J. Sarnak. 1998. Clinical epidemiology of cardiovascular disease in chronic renal disease. Am J Kidney Dis 32: S112-119.
  5. Parfrey, P. S., and R. N. Foley. 1999. The clinical epidemiology of cardiac disease in chronic renal failure. J Am Soc Nephrol 10: 1606-1615.
  6. Sarnak, M. J., B. E. Coronado, T. Greene, S. R. Wang, J. W. Kusek, G. J. Beck, and A. S. Levey. 2002. Cardiovascular disease risk factors in chronic renal insufficiency. Clin Nephrol 57: 327-335.
  7. Chronic Kidney Disease Prognosis, C., K. Matsushita, M. van der Velde, B. C. Astor, M. Woodward, A. S. Levey, P. E. de Jong, J. Coresh, and R. T. Gansevoort. 2010. Association of estimated glomerular filtration rate and albuminuria with all-cause and cardiovascular mortality in general population cohorts: a collaborative meta-analysis. Lancet 375: 2073-2081.
  8. van der Velde, M., K. Matsushita, J. Coresh, B. C. Astor, M. Woodward, A. Levey, P. de Jong, R. T. Gansevoort, C. Chronic Kidney Disease Prognosis, M. van der Velde, K. Matsushita, J. Coresh, B. C. Astor, M. Woodward, A. S. Levey, P. E. de Jong, R. T. Gansevoort, A. Levey, M. El-Nahas, K. U. Eckardt, B. L. Kasiske, T. Ninomiya, J. Chalmers, S. Macmahon, M. Tonelli, B. Hemmelgarn, F. Sacks, G. Curhan, A. J. Collins, S. Li, S. C. Chen, K. P. Hawaii Cohort, B. J. Lee, A. Ishani, J. Neaton, K. Svendsen, J. F. Mann, S. Yusuf, K. K. Teo, P. Gao, R. G. Nelson, W. C. Knowler, H. J. Bilo, H. Joosten, N. Kleefstra, K. H. Groenier, P. Auguste, K. Veldhuis, Y. Wang, L. Camarata, B. Thomas, and T. Manley. 2011. Lower estimated glomerular filtration rate and higher albuminuria are associated with all-cause and cardiovascular mortality. A collaborative meta-analysis of high-risk population cohorts. Kidney Int 79: 1341-1352.
  9. Chan, D. T., G. K. Dogra, A. B. Irish, E. M. Ooi, P. H. Barrett, D. C. Chan, and G. F. Watts. 2009. Chronic kidney disease delays VLDL-apoB-100 particle catabolism: potential role of apolipoprotein C-III. J Lipid Res 50: 2524-2531.
  10. Vaziri, N. D., G. Deng, and K. Liang. 1999. Hepatic HDL receptor, SR-B1 and Apo A-I expression in chronic renal failure. Nephrol Dial Transplant 14: 1462-1466.
  11. Schuchardt, M., M. Tolle, and M. van der Giet. 2015. High-density lipoprotein: structural and functional changes under uremic conditions and the therapeutic consequences. Handbook of experimental pharmacology 224: 423-453.
  12. Kuznik, A., J. Mardekian, and L. Tarasenko. 2013. Evaluation of cardiovascular disease burden and therapeutic goal attainment in US adults with chronic kidney disease: an analysis of national health and nutritional examination survey data, 2001-2010. BMC nephrology 14: 132.
  13. Longenecker, J. C., J. Coresh, N. R. Powe, A. S. Levey, N. E. Fink, A. Martin, and M. J. Klag. 2002. Traditional cardiovascular disease risk factors in dialysis patients compared with the general population: the CHOICE Study. J Am Soc Nephrol 13: 1918-1927.
  14. Pennell, P., B. Leclercq, M. I. Delahunty, and B. A. Walters. 2006. The utility of non-HDL in managing dyslipidemia of stage 5 chronic kidney disease. Clin Nephrol 66: 336-347.
  15. Rao, R., D. Ansell, J. A. Gilg, S. J. Davies, E. J. Lamb, and C. R. Tomson. 2009. Effect of change in renal replacement therapy modality on laboratory variables: a cohort study from the UK Renal Registry. Nephrol Dial Transplant 24: 2877-2882.
  16. Chu, M., A. Y. Wang, I. H. Chan, S. H. Chui, and C. W. Lam. 2012. Serum small-dense LDL abnormalities in chronic renal disease patients. British journal of biomedical science 69: 99-102.
  17. Reis, A., A. Rudnitskaya, P. Chariyavilaskul, N. Dhaun, V. Melville, J. Goddard, D. J. Webb, A. R. Pitt, and C. M. Spickett. 2014. Top-down lipidomics of low density lipoprotein reveal altered lipid profiles in advanced chronic kidney disease. J Lipid Res.
  18. Hricik, D. E., J. T. Mayes, and J. A. Schulak. 1991. Independent effects of cyclosporine and prednisone on posttransplant hypercholesterolemia. Am J Kidney Dis 18: 353-358.
  19. Marcen, R., J. Chahin, A. Alarcon, and J. Bravo. 2006. Conversion from cyclosporine microemulsion to tacrolimus in stable kidney transplant patients with hypercholesterolemia is related to an improvement in cardiovascular risk profile: a prospective study. Transplantation proceedings 38: 2427-2430.
  20. Ma, K. L., X. Z. Ruan, S. H. Powis, Y. Chen, J. F. Moorhead, and Z. Varghese. 2007. Sirolimus modifies cholesterol homeostasis in hepatic cells: a potential molecular mechanism for sirolimus-associated dyslipidemia. Transplantation 84: 1029-1036.
  21. Vaziri, N. D. 2003. Molecular mechanisms of lipid disorders in nephrotic syndrome. Kidney Int 63: 1964-1976.
  22. Vaziri, N. D., T. Sato, and K. Liang. 2003. Molecular mechanisms of altered cholesterol metabolism in rats with spontaneous focal glomerulosclerosis. Kidney Int 63: 1756-1763.
  23. Vaziri, N. D., K. Liang, and J. S. Parks. 2001. Acquired lecithin-cholesterol acyltransferase deficiency in nephrotic syndrome. Am J Physiol Renal Physiol 280: F823-828.
  24. Vaziri, N. D., C. H. Kim, D. Phan, S. Kim, and K. Liang. 2004. Up-regulation of hepatic Acyl CoA: Diacylglycerol acyltransferase-1 (DGAT-1) expression in nephrotic syndrome. Kidney Int 66: 262-267.
  25. Pearson, G. J., G. Thanassoulis, T. J. Anderson, A. R. Barry, P. Couture, N. Dayan, G. A. Francis, J. Genest, J. Gregoire, S. A. Grover, M. Gupta, R. A. Hegele, D. Lau, L. A. Leiter, A. A. Leung, E. Lonn, G. B. J. Mancini, P. Manjoo, R. McPherson, D. Ngui, M. E. Piche, P. Poirier, J. Sievenpiper, J. Stone, R. Ward, and W. Wray. 2021. 2021 Canadian Cardiovascular Society Guidelines for the Management of Dyslipidemia for the Prevention of Cardiovascular Disease in Adults. The Canadian journal of cardiology 37: 1129-1150.
  26. Grundy, S. M., N. J. Stone, A. L. Bailey, C. Beam, K. K. Birtcher, R. S. Blumenthal, L. T. Braun, S. de Ferranti, J. Faiella-Tommasino, D. E. Forman, R. Goldberg, P. A. Heidenreich, M. A. Hlatky, D. W. Jones, D. Lloyd-Jones, N. Lopez-Pajares, C. E. Ndumele, C. E. Orringer, C. A. Peralta, J. J. Saseen, S. C. Smith, Jr., L. Sperling, S. S. Virani, and J. Yeboah. 2019. 2018 AHA/ACC/AACVPR/AAPA/ABC/ACPM/ADA/AGS/APhA/ASPC/NLA/PCNA Guideline on the Management of Blood Cholesterol: A Report of the American College of Cardiology/American Heart Association Task Force on Clinical Practice Guidelines. J Am Coll Cardiol 73: e285-e350.
  27. Mefford, M. T., R. S. Rosenson, L. Deng, R. M. Tanner, V. Bittner, M. M. Safford, B. Coll, K. E. Mues, K. L. Monda, and P. Muntner. 2019. Trends in Statin Use Among US Adults With Chronic Kidney Disease, 1999-2014. Journal of the American Heart Association 8: e010640.
  28. 2002. MRC/BHF Heart Protection Study of cholesterol lowering with simvastatin in 20,536 high-risk individuals: a randomised placebo-controlled trial. Lancet 360: 7-22.
  29. Tonelli, M., C. Isles, G. C. Curhan, A. Tonkin, M. A. Pfeffer, J. Shepherd, F. M. Sacks, C. Furberg, S. M. Cobbe, J. Simes, T. Craven, and M. West. 2004. Effect of pravastatin on cardiovascular events in people with chronic kidney disease. Circulation 110: 1557-1563.
  30. Soohoo, M., H. Moradi, Y. Obi, C. M. Rhee, E. O. Gosmanova, M. Z. Molnar, M. L. Kashyap, D. L. Gillen, C. P. Kovesdy, K. Kalantar-Zadeh, and E. Streja. 2019. Statin Therapy Before Transition to End-Stage Renal Disease With Posttransition Outcomes. Journal of the American Heart Association 8: e011869.
  31. Palmer, S. C., S. D. Navaneethan, J. C. Craig, D. W. Johnson, V. Perkovic, J. Hegbrant, and G. F. Strippoli. 2014. HMG CoA reductase inhibitors (statins) for people with chronic kidney disease not requiring dialysis. Cochrane Database Syst Rev 5: CD007784.
  32. Toto, R. D., S. M. Grundy, and G. L. Vega. 2000. Pravastatin treatment of very low density, intermediate density and low density lipoproteins in hypercholesterolemia and combined hyperlipidemia secondary to the nephrotic syndrome. Am J Nephrol 20: 12-17.
  33. Matzkies, F. K., U. Bahner, M. Teschner, H. Hohage, A. Heidland, and R. M. Schaefer. 1999. Efficiency of 1-year treatment with fluvastatin in hyperlipidemic patients with nephrotic syndrome. Am J Nephrol 19: 492-494.
  34. Asselbergs, F. W., G. F. Diercks, H. L. Hillege, A. J. van Boven, W. M. Janssen, A. A. Voors, D. de Zeeuw, P. E. de Jong, D. J. van Veldhuisen, W. H. van Gilst, R. Prevention of, and I. Vascular Endstage Disease Intervention Trial. 2004. Effects of fosinopril and pravastatin on cardiovascular events in subjects with microalbuminuria. Circulation 110: 2809-2816.
  35. Scheven, L., M. Van der Velde, H. J. Lambers Heerspink, P. E. De Jong, and R. T. Gansevoort. 2013. Isolated microalbuminuria indicates a poor medical prognosis. Nephrol Dial Transplant 28: 1794-1801.
  36. Wanner, C., V. Krane, W. Marz, M. Olschewski, J. F. Mann, G. Ruf, and E. Ritz. 2005. Atorvastatin in patients with type 2 diabetes mellitus undergoing hemodialysis. N Engl J Med 353: 238-248.
  37. Krane, V., K. R. Schmidt, L. J. Gutjahr-Lengsfeld, J. F. Mann, W. Marz, F. Swoboda, C. Wanner, and D. S. Investigators. 2016. Long-term effects following 4 years of randomized treatment with atorvastatin in patients with type 2 diabetes mellitus on hemodialysis. Kidney Int 89: 1380-1387.
  38. Fellstrom, B. C., A. G. Jardine, R. E. Schmieder, H. Holdaas, K. Bannister, J. Beutler, D. W. Chae, A. Chevaile, S. M. Cobbe, C. Gronhagen-Riska, J. J. De Lima, R. Lins, G. Mayer, A. W. McMahon, H. H. Parving, G. Remuzzi, O. Samuelsson, S. Sonkodi, D. Sci, G. Suleymanlar, D. Tsakiris, V. Tesar, V. Todorov, A. Wiecek, R. P. Wuthrich, M. Gottlow, E. Johnsson, and F. Zannad. 2009. Rosuvastatin and cardiovascular events in patients undergoing hemodialysis. N Engl J Med 360: 1395-1407.
  39. Baigent, C., M. J. Landray, C. Reith, J. Emberson, D. C. Wheeler, C. Tomson, C. Wanner, V. Krane, A. Cass, J. Craig, B. Neal, L. Jiang, L. S. Hooi, A. Levin, L. Agodoa, M. Gaziano, B. Kasiske, R. Walker, Z. A. Massy, B. Feldt-Rasmussen, U. Krairittichai, V. Ophascharoensuk, B. Fellstrom, H. Holdaas, V. Tesar, A. Wiecek, D. Grobbee, D. de Zeeuw, C. Gronhagen-Riska, T. Dasgupta, D. Lewis, W. Herrington, M. Mafham, W. Majoni, K. Wallendszus, R. Grimm, T. Pedersen, J. Tobert, J. Armitage, A. Baxter, C. Bray, Y. Chen, Z. Chen, M. Hill, C. Knott, S. Parish, D. Simpson, P. Sleight, A. Young, and R. Collins. 2011. The effects of lowering LDL cholesterol with simvastatin plus ezetimibe in patients with chronic kidney disease (Study of Heart and Renal Protection): a randomised placebo-controlled trial. Lancet 377: 2181-2192.
  40. Palmer, S. C., S. D. Navaneethan, J. C. Craig, D. W. Johnson, V. Perkovic, S. U. Nigwekar, J. Hegbrant, and G. F. Strippoli. 2013. HMG CoA reductase inhibitors (statins) for dialysis patients. Cochrane Database Syst Rev 9: CD004289.
  41. Marz, W., B. Genser, C. Drechsler, V. Krane, T. B. Grammer, E. Ritz, T. Stojakovic, H. Scharnagl, K. Winkler, I. Holme, H. Holdaas, C. Wanner, D. German, and I. Dialysis Study. 2011. Atorvastatin and low-density lipoprotein cholesterol in type 2 diabetes mellitus patients on hemodialysis. Clin J Am Soc Nephrol 6: 1316-1325.
  42. Vaziri, N. D., and K. C. Norris. 2013. Reasons for the lack of salutary effects of cholesterol-lowering interventions in end-stage renal disease populations. Blood purification 35: 31-36.
  43. Holdaas, H., B. Fellstrom, A. G. Jardine, I. Holme, G. Nyberg, P. Fauchald, C. Gronhagen-Riska, S. Madsen, H. H. Neumayer, E. Cole, B. Maes, P. Ambuhl, A. G. Olsson, A. Hartmann, D. O. Solbu, and T. R. Pedersen. 2003. Effect of fluvastatin on cardiac outcomes in renal transplant recipients: a multicentre, randomised, placebo-controlled trial. Lancet 361: 2024-2031.
  44. Jardine, A. G., H. Holdaas, B. Fellstrom, E. Cole, G. Nyberg, C. Gronhagen-Riska, S. Madsen, H. H. Neumayer, B. Maes, P. Ambuhl, A. G. Olsson, I. Holme, P. Fauchald, C. Gimpelwicz, T. R. Pedersen, and A. S. Investigators. 2004. fluvastatin prevents cardiac death and myocardial infarction in renal transplant recipients: post-hoc subgroup analyses of the ALERT Study. Am J Transplant 4: 988-995.
  45. Holdaas, H., B. Fellstrom, A. G. Jardine, G. Nyberg, C. Gronhagen-Riska, S. Madsen, H. H. Neumayer, E. Cole, B. Maes, P. Ambuhl, J. O. Logan, B. Staffler, C. Gimpelewicz, and A. S. Group. 2005. Beneficial effect of early initiation of lipid-lowering therapy following renal transplantation. Nephrol Dial Transplant 20: 974-980.
  46. Yazbek, D. C., A. B. de Carvalho, C. S. Barros, J. O. Medina Pestana, and M. E. Canziani. 2016. Effect of Statins on the Progression of Coronary Calcification in Kidney Transplant Recipients. PLoS One 11: e0151797.
  47. Fellstrom, B., H. Holdaas, A. G. Jardine, I. Holme, G. Nyberg, P. Fauchald, C. Gronhagen-Riska, S. Madsen, H. H. Neumayer, E. Cole, B. Maes, P. Ambuhl, A. G. Olsson, A. Hartmann, J. O. Logan, T. R. Pedersen, and I. Assessment of Lescol in Renal Transplantation Study. 2004. Effect of fluvastatin on renal end points in the Assessment of Lescol in Renal Transplant (ALERT) trial. Kidney Int 66: 1549-1555.
  48. Samuelsson, O., H. Mulec, C. Knight-Gibson, P. O. Attman, B. Kron, R. Larsson, L. Weiss, H. Wedel, and P. Alaupovic. 1997. Lipoprotein abnormalities are associated with increased rate of progression of human chronic renal insufficiency. Nephrol Dial Transplant 12: 1908-1915.
  49. Samuelsson, O., P. O. Attman, C. Knight-Gibson, R. Larsson, H. Mulec, L. Weiss, and P. Alaupovic. 1998. Complex apolipoprotein B-containing lipoprotein particles are associated with a higher rate of progression of human chronic renal insufficiency. J Am Soc Nephrol 9: 1482-1488.
  50. Sato, H., S. Suzuki, H. Kobayashi, S. Ogino, A. Inomata, and M. Arakawa. 1991. Immunohistological localization of apolipoproteins in the glomeruli in renal disease: specifically apoB and apoE. Clin Nephrol 36: 127-133.
  51. Fried, L. F., T. J. Orchard, and B. L. Kasiske. 2001. Effect of lipid reduction on the progression of renal disease: a meta-analysis. Kidney Int 59: 260-269.
  52. Rahman, M., W. Yang, S. Akkina, A. Alper, A. H. Anderson, L. J. Appel, J. He, D. S. Raj, J. Schelling, L. Strauss, V. Teal, D. J. Rader, and C. S. Investigators. 2014. Relation of serum lipids and lipoproteins with progression of CKD: The CRIC study. Clin J Am Soc Nephrol 9: 1190-1198.
  53. Dormuth, C. R., B. R. Hemmelgarn, J. M. Paterson, M. T. James, G. F. Teare, C. B. Raymond, J. P. Lafrance, A. Levy, A. X. Garg, P. Ernst, and S. Canadian Network for Observational Drug Effect. 2013. Use of high potency statins and rates of admission for acute kidney injury: multicenter, retrospective observational analysis of administrative databases. BMJ 346: f880.
  54. Bangalore, S., R. Fayyad, G. K. Hovingh, R. Laskey, L. Vogt, D. A. DeMicco, D. D. Waters, C. Treating to New Targets Steering, and Investigators. 2014. Statin and the risk of renal-related serious adverse events: Analysis from the IDEAL, TNT, CARDS, ASPEN, SPARCL, and other placebo-controlled trials. Am J Cardiol 113: 2018-2020.
  55. Lee, J. M., J. Park, K. H. Jeon, J. H. Jung, S. E. Lee, J. K. Han, H. L. Kim, H. M. Yang, K. W. Park, H. J. Kang, B. K. Koo, S. H. Jo, and H. S. Kim. 2014. Efficacy of short-term high-dose statin pretreatment in prevention of contrast-induced acute kidney injury: updated study-level meta-analysis of 13 randomized controlled trials. PLoS One 9: e111397.
  56. Han, Y., G. Zhu, L. Han, F. Hou, W. Huang, H. Liu, J. Gan, T. Jiang, X. Li, W. Wang, S. Ding, S. Jia, W. Shen, D. Wang, L. Sun, J. Qiu, X. Wang, Y. Li, J. Deng, J. Li, K. Xu, B. Xu, R. Mehran, and Y. Huo. 2014. Short-term rosuvastatin therapy for prevention of contrast-induced acute kidney injury in patients with diabetes and chronic kidney disease. J Am Coll Cardiol 63: 62-70.
  57. Sattar, N., D. Preiss, H. M. Murray, P. Welsh, B. M. Buckley, A. J. de Craen, S. R. Seshasai, J. J. McMurray, D. J. Freeman, J. W. Jukema, P. W. Macfarlane, C. J. Packard, D. J. Stott, R. G. Westendorp, J. Shepherd, B. R. Davis, S. L. Pressel, R. Marchioli, R. M. Marfisi, A. P. Maggioni, L. Tavazzi, G. Tognoni, J. Kjekshus, T. R. Pedersen, T. J. Cook, A. M. Gotto, M. B. Clearfield, J. R. Downs, H. Nakamura, Y. Ohashi, K. Mizuno, K. K. Ray, and I. Ford. 2010. Statins and risk of incident diabetes: a collaborative meta-analysis of randomised statin trials. Lancet 375: 735-742.
  58. Preiss, D., S. R. Seshasai, P. Welsh, S. A. Murphy, J. E. Ho, D. D. Waters, D. A. DeMicco, P. Barter, C. P. Cannon, M. S. Sabatine, E. Braunwald, J. J. Kastelein, J. A. de Lemos, M. A. Blazing, T. R. Pedersen, M. J. Tikkanen, N. Sattar, and K. K. Ray. 2011. Risk of incident diabetes with intensive-dose compared with moderate-dose statin therapy: a meta-analysis. JAMA 305: 2556-2564.
  59. He, Y. M., L. Feng, D. M. Huo, Z. H. Yang, and Y. H. Liao. 2014. Benefits and harm of niacin and its analog for renal dialysis patients: a systematic review and meta-analysis. Int Urol Nephrol 46: 433-442.
  60. Cho, K. H., H. J. Kim, V. S. Kamanna, and N. D. Vaziri. 2010. Niacin improves renal lipid metabolism and slows progression in chronic kidney disease. Biochim Biophys Acta 1800: 6-15.
  61. Streja, E., C. P. Kovesdy, D. A. Streja, H. Moradi, K. Kalantar-Zadeh, and M. L. Kashyap. 2015. Niacin and progression of CKD. Am J Kidney Dis 65: 785-798.
  62. Kang, H. L., D. Y. Kim, S. M. Lee, K. H. Kim, S. H. Han, H. K. Nam, K. H. Kim, S. E. Kim, Y. K. Son, and W. S. An. 2013. Effect of low-dose niacin on dyslipidemia, serum phophorus levels and adverse effects in patients with chornic kidney disease. Kidney Res Clin Pract 32: 21-26.
  63. Maccubbin, D., D. Tipping, O. Kuznetsova, W. A. Hanlon, and A. G. Bostom. 2010. Hypophosphatemic effect of niacin in patients without renal failure: a randomized trial. Clin J Am Soc Nephrol 5: 582-589.
  64. Maccubbin, D., H. E. Bays, A. G. Olsson, V. Elinoff, A. Elis, Y. Mitchel, W. Sirah, A. Betteridge, R. Reyes, Q. Yu, O. Kuznetsova, C. M. Sisk, R. C. Pasternak, and J. F. Paolini. 2008. Lipid-modifying efficacy and tolerability of extended-release niacin/laropiprant in patients with primary hypercholesterolaemia or mixed dyslipidaemia. International journal of clinical practice 62: 1959-1970.
  65. Boden, W. E., J. L. Probstfield, T. Anderson, B. R. Chaitman, P. Desvignes-Nickens, K. Koprowicz, R. McBride, K. Teo, and W. Weintraub. 2011. Niacin in patients with low HDL cholesterol levels receiving intensive statin therapy. N Engl J Med 365: 2255-2267.
  66. HPS2-THRIVE Collaborative Group, M. J. Landray, R. Haynes, J. C. Hopewell, S. Parish, T. Aung, J. Tomson, K. Wallendszus, M. Craig, L. Jiang, R. Collins, and J. Armitage. 2014. Effects of extended-release niacin with laropiprant in high-risk patients. N Engl J Med 371: 203-212.
  67. Sica, D. A. 2009. Fibrate therapy and renal function. Curr Atheroscler Rep 11: 338-342.
  68. Jun, M., B. Zhu, M. Tonelli, M. J. Jardine, A. Patel, B. Neal, T. Liyanage, A. Keech, A. Cass, and V. Perkovic. 2012. Effects of fibrates in kidney disease: a systematic review and meta-analysis. J Am Coll Cardiol 60: 2061-2071.
  69. Davis, T. M., R. Ting, J. D. Best, M. W. Donoghoe, P. L. Drury, D. R. Sullivan, A. J. Jenkins, R. L. O'Connell, M. J. Whiting, P. P. Glasziou, R. J. Simes, Y. A. Kesaniemi, V. J. Gebski, R. S. Scott, A. C. Keech, I. Fenofibrate, and i. Event Lowering in Diabetes Study. 2011. Effects of fenofibrate on renal function in patients with type 2 diabetes mellitus: the Fenofibrate Intervention and Event Lowering in Diabetes (FIELD) Study. Diabetologia 54: 280-290.
  70. Tonelli, M., D. Collins, S. Robins, H. Bloomfield, and G. C. Curhan. 2004. Gemfibrozil for secondary prevention of cardiovascular events in mild to moderate chronic renal insufficiency. Kidney Int 66: 1123-1130.
  71. Ting, R. D., A. C. Keech, P. L. Drury, M. W. Donoghoe, J. Hedley, A. J. Jenkins, T. M. Davis, S. Lehto, D. Celermajer, R. J. Simes, K. Rajamani, and K. Stanton. 2012. Benefits and safety of long-term fenofibrate therapy in people with type 2 diabetes and renal impairment: the FIELD Study. Diabetes Care 35: 218-225.
  72. Cannon, C. P., M. A. Blazing, R. P. Giugliano, A. McCagg, J. A. White, P. Theroux, H. Darius, B. S. Lewis, T. O. Ophuis, J. W. Jukema, G. M. De Ferrari, W. Ruzyllo, P. De Lucca, K. Im, E. A. Bohula, C. Reist, S. D. Wiviott, A. M. Tershakovec, T. A. Musliner, E. Braunwald, R. M. Califf, and IMPROVE-IT Investigators. 2015. Ezetimibe Added to Statin Therapy after Acute Coronary Syndromes. N Engl J Med 372: 2387-2397.
  73. Stanifer, J. W., D. M. Charytan, J. White, Y. Lokhnygina, C. P. Cannon, M. T. Roe, and M. A. Blazing. 2017. Benefit of Ezetimibe Added to Simvastatin in Reduced Kidney Function. J Am Soc Nephrol 28: 3034-3043.
  74. Haynes, R., D. Lewis, J. Emberson, C. Reith, L. Agodoa, A. Cass, J. C. Craig, D. de Zeeuw, B. Feldt-Rasmussen, B. Fellstrom, A. Levin, D. C. Wheeler, R. Walker, W. G. Herrington, C. Baigent, M. J. Landray, S. C. Group, and S. C. Group. 2014. Effects of lowering LDL cholesterol on progression of kidney disease. J Am Soc Nephrol 25: 1825-1833.
  75. Morita, T., S. Morimoto, C. Nakano, R. Kubo, Y. Okuno, M. Seo, K. Someya, M. Nakahigashi, H. Ueda, N. Toyoda, M. Kusabe, F. Jo, N. Takahashi, T. Iwasaka, and I. Shiojima. 2014. Renal and vascular protective effects of ezetimibe in chronic kidney disease. Internal medicine 53: 307-314.
  76. Rizos, E. C., E. E. Ntzani, E. Bika, M. S. Kostapanos, and M. S. Elisaf. 2012. Association between omega-3 fatty acid supplementation and risk of major cardiovascular disease events: a systematic review and meta-analysis. JAMA 308: 1024-1033.
  77. Hu, Y., F. B. Hu, and J. E. Manson. 2019. Marine Omega-3 Supplementation and Cardiovascular Disease: An Updated Meta-Analysis of 13 Randomized Controlled Trials Involving 127 477 Participants. Journal of the American Heart Association 8: e013543.
  78. Mori, T. A., V. Burke, I. Puddey, A. Irish, C. A. Cowpland, L. Beilin, G. Dogra, and G. F. Watts. 2009. The effects of [omega]3 fatty acids and coenzyme Q10 on blood pressure and heart rate in chronic kidney disease: a randomized controlled trial. J Hypertens 27: 1863-1872.
  79. Gopinath, B., D. C. Harris, V. M. Flood, G. Burlutsky, and P. Mitchell. 2011. Consumption of long-chain n-3 PUFA, alpha-linolenic acid and fish is associated with the prevalence of chronic kidney disease. The British journal of nutrition 105: 1361-1368.
  80. Bunout, D., G. Barrera, S. Hirsch, and E. Lorca. 2021. A Randomized, Double-Blind, Placebo-Controlled Clinical Trial of an Omega-3 Fatty Acid Supplement in Patients With Predialysis Chronic Kidney Disease. J Ren Nutr 31: 64-72.
  81. Lok, C. E., L. Moist, B. R. Hemmelgarn, M. Tonelli, M. A. Vazquez, M. Dorval, M. Oliver, S. Donnelly, M. Allon, and K. Stanley. 2012. Effect of fish oil supplementation on graft patency and cardiovascular events among patients with new synthetic arteriovenous hemodialysis grafts: a randomized controlled trial. Jama 307: 1809-1816.
  82. Irish, A. B., A. K. Viecelli, C. M. Hawley, L. S. Hooi, E. M. Pascoe, P. A. Paul-Brent, S. V. Badve, T. A. Mori, A. Cass, P. G. Kerr, D. Voss, L. M. Ong, K. R. Polkinghorne, A. Omega-3 Fatty, and G. Aspirin in Vascular Access Outcomes in Renal Disease Study Collaborative. 2017. Effect of Fish Oil Supplementation and Aspirin Use on Arteriovenous Fistula Failure in Patients Requiring Hemodialysis: A Randomized Clinical Trial. JAMA Intern Med 177: 184-193.
  83. Svensson, M., E. B. Schmidt, K. A. Jorgensen, and J. H. Christensen. 2006. N-3 fatty acids as secondary prevention against cardiovascular events in patients who undergo chronic hemodialysis: a randomized, placebo-controlled intervention trial. Clin J Am Soc Nephrol 1: 780-786.
  84. Sabatine, M. S., R. P. Giugliano, A. C. Keech, N. Honarpour, S. D. Wiviott, S. A. Murphy, J. F. Kuder, H. Wang, T. Liu, S. M. Wasserman, P. S. Sever, T. R. Pedersen, F. S. Committee, and Investigators. 2017. Evolocumab and Clinical Outcomes in Patients with Cardiovascular Disease. N Engl J Med 376: 1713-1722.
  85. Morena, M., C. Le May, L. Chenine, L. Arnaud, A. M. Dupuy, M. Pichelin, H. Leray-Moragues, L. Chalabi, B. Canaud, J. P. Cristol, and B. Cariou. 2017. Plasma PCSK9 concentrations during the course of nondiabetic chronic kidney disease: Relationship with glomerular filtration rate and lipid metabolism. J Clin Lipidol 11: 87-93.
  86. Pavlakou, P., E. Liberopoulos, E. Dounousi, and M. Elisaf. 2017. PCSK9 in chronic kidney disease. Int Urol Nephrol 49: 1015-1024.
  87. Schwartz, G. G., P. G. Steg, M. Szarek, D. L. Bhatt, V. A. Bittner, R. Diaz, J. M. Edelberg, S. G. Goodman, C. Hanotin, R. A. Harrington, J. W. Jukema, G. Lecorps, K. W. Mahaffey, A. Moryusef, R. Pordy, K. Quintero, M. T. Roe, W. J. Sasiela, J. F. Tamby, P. Tricoci, H. D. White, A. M. Zeiher, O. O. Committees, and Investigators. 2018. Alirocumab and Cardiovascular Outcomes after Acute Coronary Syndrome. N Engl J Med 379: 2097-2107.
  88. Tunon, J., P. G. Steg, D. L. Bhatt, V. A. Bittner, R. Diaz, S. G. Goodman, J. W. Jukema, Y. U. Kim, Q. H. Li, C. Mueller, A. Parkhomenko, R. Pordy, P. Sritara, M. Szarek, H. D. White, A. M. Zeiher, G. G. Schwartz, and O. O. Investigators. 2020. Effect of alirocumab on major adverse cardiovascular events according to renal function in patients with a recent acute coronary syndrome: prespecified analysis from the ODYSSEY OUTCOMES randomized clinical trial. Eur Heart J 41: 4114-4123.
  89. Vallejo-Vaz, A. J., K. K. Ray, H. N. Ginsberg, M. H. Davidson, R. H. Eckel, L. V. Lee, L. Bessac, R. Pordy, A. Letierce, and C. P. Cannon. 2019. Associations between lower levels of low-density lipoprotein cholesterol and cardiovascular events in very high-risk patients: Pooled analysis of nine ODYSSEY trials of alirocumab versus control. Atherosclerosis 288: 85-93.
  90. Ray, K. K., H. E. Bays, A. L. Catapano, N. D. Lalwani, L. T. Bloedon, L. R. Sterling, P. L. Robinson, C. M. Ballantyne, and C. H. Trial. 2019. Safety and Efficacy of Bempedoic Acid to Reduce LDL Cholesterol. N Engl J Med 380: 1022-1032.
  91. Powell, J., and C. Piszczatoski. 2021. Bempedoic Acid: A New Tool in the Battle Against Hyperlipidemia. Clin Ther 43: 410-420.
  92. Nicholls, S., A. M. Lincoff, H. E. Bays, L. Cho, D. E. Grobbee, J. J. Kastelein, P. Libby, P. M. Moriarty, J. Plutzky, K. K. Ray, P. D. Thompson, W. Sasiela, D. Mason, J. McCluskey, D. Davey, K. Wolski, and S. E. Nissen. 2021. Rationale and design of the CLEAR-outcomes trial: Evaluating the effect of bempedoic acid on cardiovascular events in patients with statin intolerance. Am Heart J 235: 104-112.
  93. Wright, R. S., M. G. Collins, R. M. Stoekenbroek, R. Robson, P. L. J. Wijngaard, U. Landmesser, L. A. Leiter, J. J. P. Kastelein, K. K. Ray, and D. Kallend. 2020. Effects of Renal Impairment on the Pharmacokinetics, Efficacy, and Safety of Inclisiran: An Analysis of the ORION-7 and ORION-1 Studies. Mayo Clin Proc 95: 77-89.