Archives

Infections in Endocrinology: Viruses

ABSTRACT


Viruses are one of the simplest pathogenic organisms infecting the human body. Association between viral infections and endocrine system is complex and has not been fully studied. Viral infections can induce several physiological changes in the human endocrine system, resulting in cytokine mediated activation of hypothalamo-pituitary-adrenal axis to increase cortisol production, thus modulating the immune response. Further, many viral infections impact different endocrine organs, either by direct viral invasion or by systemic or local inflammation resulting in transient or permanent endocrinopathies; both hyper and hypofunction of endocrine organs may ensue. Viruses can encode production of specific viral proteins that have structural and functional homology to human hormones. Since endocrine hormones have immunoregulatory functions, endocrinopathies may alter the susceptibility of human body for viral infections. Recently the pandemic causing SARS 2 CoV infection has been shown to affect multiple endocrine organs through a variety of mechanisms, highlighting the significance of viral infection related endocrinopathies in morbidity and mortality. With improving understanding of viruses and their role in the human endocrine system, further research on this field would be required to explore new targets for prevention and treatment of endocrinopathies.


INTRODUCTION


The endocrine system plays a vital role in homeostasis and immunity. Hormones modulate host defenses by strengthening or weakening the body’s immune system, being one of the key determinants of susceptibility of humans for infections. On the other hand, infective agents through different mechanisms may affect endocrine organs, causing endocrinopathies.


Viruses are the most abundant form of life on earth, estimate at 10 quintillion (1031) (1, 2). They are obligate parasites with single or double-stranded DNA or RNA, infecting a variety of hosts; bacteria, algae, fungi, plants, insects, and vertebrates. Viral infections are common among humans, resulting in diseases which may extend into epidemics. The literature is evolving on viral agents being important pathogens in endocrine disorders. Knowledge about the interplay between viruses and the human endocrine system would expand the understanding of acute and chronic effects of viral disease on the human body.


HUMANS VIROME


The role of viruses in the human body is diverse. Many viruses have been identified to play an essential part in the human microbiome, with an estimate of 380 trillion viral particles inhabiting the human body. This human virome consists of:


  1. Human Endogenous Retroviruses (HERV): These viruses are integrated viral genomic material which consists of 8% of the total human genome (1, 3). As they are incorporated into the human genome, they are transmitted vertically to offspring. The function of the HERV in the human genome is not known. However, transcription of these genes may produce proteins, which may alter the function of regulatory genes and elicit an immune response (autoimmune diseases) or cell growth (cancers) in the host (4, 5).


  1. Bacteriophages: These viruses inhabit their bacterial hosts, mainly in the human gut in addition to the skin and oral cavity (6, 7). Mostly they show a symbiotic relationship with their host. They may promote health or disease by phage-mediated lysis of pathogenic or commensal bacteria triggered by external factors, thereby controlling bacterial populations and promoting evolutionary advantages to host bacteria (e.g., antibiotic resistance through the transfer of genetic material)


  1. Eukaryotic viruses: These viruses infect human cells often resulting in symptomatic diseases or may exist in an asymptomatic carrier state (8).


PATHOGENESIS OF VIRAL INFECTIONS IN HUMANS


Being an obligate parasite, viruses need to enter the human cell in order to replicate and complete its life cycle. The first step of viral entry into a host cell involves recognition and binding to host cell specific receptors by viral surface proteins (fusion proteins/ spikes). This specificity determines the host range for a particular virus (e.g. HIV viral surface protein, gp120 specifically interact only with CD4, CCR5, and CXCR4 molecules on T lymphocytes) (9). Subsequent events are conformational change of fusion proteins and subsequent entry into the cell through endocytosis (e.g. Adenovirus), cell membrane fusion (e.g. HIV) or direct cell to cell contact (virological synapses e.g. HTLV1) (10). Once the viral DNA or RNA material is inside the host cell, they are incorporated into the host genome and replication of the viral genome and/or transcription of specific proteins will occur. The replicated viral genome gets assembled with viral proteins to produce an increased number of viral particles (virions), which will be released from the infected cell by cell lysis or budding from the host cell. Some viruses undergo a lysogenic cycle where the viral genome is incorporated into a specific location in the host chromosome. This viral genome is known as provirus and mostly remain non-functional within host cells until being activated at some point when the provirus gives rise to active virus which would lead to the cellular death, necrosis, or apoptosis of the host cell (9).


Many changes occur in the infected cell and its surrounding tissues leading to immune modulations. Direct cellular damage could occur in the infected host cell by viral proliferation/replication. Proteins encoded by the viral genome can also modulate cellular functions and cause damage to the infected cell (11). Further, the virus itself and infected tissues trigger the innate immune system through cytokines (IL-1, IL-6, IL-8, IL-12, TNF-α, IFN-α/β, TGF-β), complements, and natural killer cells (12, 13). The resultant immune response can cause inflammation or subsequent damage to the infected cell which may further progress to inflammation and damage of nearby uninfected cells (11, 14). Virus induced tissue inflammation increases the production of systemic mediators of inflammation, which may induce a systemic inflammatory condition in the host, affecting many other organs ((11, 15). Subsequently adaptive immunity develops where the host develops cell mediated immunity (to control disease) and humoral immunity with antibodies (to prevent reinfection) against specific viruses (12).  


VIRUS INDUCED ALTERATIONS IN THE ENDOCRINE SYSTEM


Virus induced changes of endocrine cells and organs can occur in several ways (11).


  1. Activation of the hypothalamo-pituitary-adrenal (HPA) axis indirectly as a result of systemic viral infection and inflammation.
  2. Damage to specific endocrine cells by direct viral infection of the cell (through stages of the viral cell cycle).
  3. Damage to specific endocrine cells by viral proteins produced within the cell as a result of viral replication within the cell.
  4. Damage of virus infected endocrine organs by inflammation through activation of an immune reaction (innate and cell mediated).
  5. Damage of uninfected endocrine organs through the systemic immune response as a result of the immune reaction to the viral infection.
  6. Damage of uninfected endocrine organs through autoimmune mechanisms/cross reaction of antibodies.
  7. Viral gene products may induce an alteration of hormonal activity/ production by endocrine cells.


Pituitary Gland


HPA AXIS RESPONSE TO VIRAL INFECTIONS


Any virus which causes systemic viremia and inflammation may stimulate the HPA axis to release cortisol through early innate proinflammatory cytokines (IL-1, IL-6 and TNF-α) and late acquired T cell cytokines (INF-ϒ and IL-2) during an acute viral infection (16). These mediators act on the CRH producing cells of the hypothalamus, corticotrophs in the anterior pituitary as well as on the adrenal cortex to increase glucocorticoids during the illness. Cytokines (IL-1, -2, -4, -7, -8, TNFα and INF-α) are responsible for the expression of glucocorticoid receptors on lymphocytes and neutrophils, enhancing the immune reaction (17). While the stress hormones norepinephrine and epinephrine mobilize immune cells into the blood stream, epinephrine and cortisol are responsible for enhancing differentiation of specific immune cells and directing the cells to the tissues where they are needed (18-20). On the other hand, elevations in glucocorticoids negatively regulate the immune system to reduce the further production of cytokines (e.g., HSV-1, MCMV, influenza,) and promote switching of cellular immunity to humoral immunity, thus protecting the body from an overactive immune response (16). The extent of viral induced glucocorticoid production is specific to the virus and the immune response stimulated by the virus; thus, in infections like LCMV clone E350 where no significant inflammation occurs, glucocorticoid production is minimal (21). However, mouse models with corneal inoculation of HSV-1 virus have shown that even without significant viremia, brainstem infection of HSV-1 can alter the HPA axis stress response through central mediated pathways (22).


ANTERIOR PITUITARY DYSFUNCTION


Hypothalamo-pituitary dysfunction due to infections remain underestimated (23). Isolated or multiple anterior pituitary hormone deficiencies had been identified during acute viral illnesses of the central nervous system, especially following viral meningo-encephalitis (24, 25). Pituitary dysfunction mainly involves corticotrophin deficiency and hyperprolactinemia and to a lesser extent gonadotrophin, growth hormone, or thyrotrophin deficiencies (24-27). The prevalence of individual deficiencies following viral infections vary among studies. Patterns of hormonal deficiencies following CNS infections depend on the type of causative agent, the localization of the infection, as well as with the severity of the disease (24). Partial or complete deficiency of specific hormones may occur depending on the degree of damage (28).


The main mechanisms involved in hypopituitarism with examples are shown in Table 1.


Table 1. Virus Induced Changes in Pituitary Function


Outcome

Mechanism

Hormone

Examples

Ref

HPA activation

Cytokines

T cell mediated

Cortisol

Any virus causing significant inflammation

(11, 16)

Hypopituitarism

Hypothalamic involvement

CRH, GHRH, TRH, GnRH

CMV, VZV, HIV, SARS

(29-32)

Hypophysitis by direct viral infiltration

ACTH, TSH, GH, LH, FSH

HSV-1/2, HIV, Hanta, SARS 

(29, 32-36)

Ischemia/infarction causing apoplexy

ACTH, TSH, GH, LH, FSH

Hanta, Influenza A

(33, 37)

Hemorrhage to pituitary (Later empty Sella)

GH, ACTH, TSH, LH, FSH,

Hanta, VZV

(28, 38-40)

Antibody mediated hypophysitis

ACTH,

GH, FSH, LH

SARS-COVID 19, Rubella

(41, 42)

Mechanism not identified


Coxsackie B5, Influenza A,

(24, 43, 44)

Hyperprolactinemia

Dopaminergic stress response

Prolactin


(52, 53)

SIADH

Damage to hypothalamic/ stalk / posterior pituitary cells

ADH

HSV-1, EBV

(45-47)

Diabetes insipidus

Direct viral invasion

ADH

Hanta, CMV, HSV, Coxackie B1

(48-51)


Hypophysitis can occur either early in the acute phase of the infection or at a later stage as a sequela of a CNS infection (24, 25). A proportion of patients who have deficiencies in anterior pituitary hormones during the acute phase of a viral infection recover hormonal function, typically within 1 year, indicating the transient nature of the damage in a subset of patients (25, 29). Delayed development of pituitary insufficiency can remain asymptomatic or present with vague symptoms. The deficiencies in such case will remain permanent, needing life-long hormonal replacement. If not for a high degree of suspicion, hypopituitarism can be misdiagnosed as the post-encephalic syndrome (23).


Acute viral infections can cause hyperprolactinemia in response to elevated cytokines IL-1, IL-2 and IL-6, which stimulate prolactin production (52). Further, certain viral infections (e.g., HIV) directly reduce the dopaminergic tone increasing prolactin levels (53). Macrophages, monocytes, lymphocytes, and natural killer cells possess prolactin receptors. Prolactin binding to these receptors activates downstream signaling pathways that will stimulate immune cell proliferation, differentiation, and survival (52). Prolactin also antagonizes the immunosuppressive effects of TNF-α and TGF-β (54). Therefore, elevated prolactin acts as an immunomodulator during acute infections.


Although rare, CNS viral infections may also present as an emergency with pituitary apoplexy, precipitating ischemia or bleeding in a normal pituitary gland or a pituitary tumor (33, 37, 38, 40). Some patients present with the empty sella syndrome following initial hemorrhagic insult to the pituitary, mostly with anterior pituitary hormonal deficiencies.


POSTERIOR PITUITARY DYSFUNCTION


SIADH is a well-known complication of infections, particularly CNS viral infections with HSV and tick-born infections(55, 56). The possible mechanism is cytokines released during inflammation, especially IL-6, causing non-osmotic release of vasopressin from the posterior pituitary (57). The presence and severity of hyponatremia depends on the infective agent, severity of the infection, and infected foci. Hyponatremia portends a worse prognosis (45).


Direct viral destruction of ADH and oxytocin producing neurons in the hypothalamus, pituitary stork, or posterior pituitary would result in central diabetes insipidus (49). It is usually associated with anterior pituitary hormone deficiency and is described mainly in immunocompromised patients with encephalitis (49, 58, 59). 


Thyroid Gland


Systemic viral infections may result in alterations of thyroid functions, giving rise to the “Sick Euthyroid syndrome”, “non-thyroidal illness syndrome”, or “Low T3 syndrome”(60). This is characterized by decreased levels of serum T3 and sometimes thyroxine (T4), without an increased secretion of TSH. Mechanisms involved are elevated circulating cytokines, cortisol, and free fatty acids influencing deactivation of deiodinase-1 enzyme (reduces T4 to T3 conversion), activation of deiodinase-3 enzyme (increased conversion of T3 to rT3), down regulation of hypothalamo-pituitary-thyroid axis resulting in normal or low TSH levels despite low T3 levels, and changes in thyroid binding proteins (61).


Direct viral invasion of the thyroid gland with subsequent cytotoxic T-cell mediated inflammation of the gland results in infiltration of thyroid follicles with disruption of the basement membrane leading to subacute thyroiditis and the release of thyroid hormones (62). Presence of viral material had been identified in diseased thyroid glands in certain patients (e.g., mumps) while others show viral IgG antibodies / rise in titers (Mumps, Coxsackie, adeno and influenza) (63, 64). However, elevated antibodies to common respiratory tract viruses may be an anamnestic response due to the inflammatory process (65). Epidemiological data has shown subacute thyroiditis during outbreaks of viral infections and seasonal clustering when viral infections are also commonly seen (66).


Viruses triggering the immune response leading to the development of autoimmune thyroid diseases like Hashimoto’s thyroiditis and Grave’s disease has been suggested (67, 68). Possible mechanism include (69);

  • Molecular mimicry: recognizing an epitope on an external antigen
  • TLR activation by virus and heat-shock protein effects
  • Enhanced thyroid expression of human leukocyte antigen molecules


The above mechanisms could facilitate the development of antigen-specific adaptive immunity, causing autoimmune thyroiditis (68, 70). In Grave’s disease, significant homology had been identified in HIV-1 induced viral Nef-protein and the human TSH receptor, raising the possibility of T cell activation through a viral antigen acting as an autoantigen (71). Further, EBV infection results in over-expression of HLA antigens, predisposing to immune mediated mechanisms of Grave’s disease (72).


Elevated levels of TBG had been observed in patients with HIV in both stable and ill patients (36). The mechanism of this finding is unknown but care should be taken in interpreting total T4/T3 levels in patients with HIV.


Table 2. Virus Induced Diseases of the Thyroid Gland

Outcome

Mechanism

Hormone

Example

Ref

Sick euthyroid syndrome

Deactivation of deiodiase-1 (through cytokine mediated inflammation)

Low T3

Normal or low T4/TSH

Any virus causing significant inflammation

(32, 61)

Activation of deiodinase-3

Down regulation of HPT axis

Changes in circulating proteins

Subacute thyroiditis

Direct viral invasion

Hyperthyroidism followed by hypothyroidism

(mostly reversible within 12 months)

Mumps, Coxsackie, adeno, influenza, SARS

(63, 64, 73)

Autoimmune hypothyroidism

Development of adaptive immune system through:

-        Molecular mimicry

-        TLR activation

-        HLA over expression


Antibody mediated

Overt hypothyroidism (Low T4/T3, Raised TSH

Parvovirus B19, mumps, rubella, coxsackie, HSV, Hep C, E, EBV

(66-68)

Subclinical hypothyroidism (normal T4/T3, raised TSH)

Autoimmune hyperthyroidism (Grave’s Disease)

Hyperthyroidism (Low TSH, raised T4/T3)

EBV, HIV-1

(71, 72, 74)


Parathyroid Glands and Calcium Metabolism


Although rare, parathyroid dysfunction following viral infections has been documented in case reports. Acute hyperparathyroidism has been reported with acute Hepatitis B infection, where hypercalcemia resolved following resolution of the hepatitis. It was postulated that antibody mediated lowering of the calcium set point in the  parathyroid gland had resulted in hyperparathyroidism (75).


Hypoparathyroidism is documented with several viral infections including HIV and SARS-COVID 19 (76-78). Parathyroid cells express a protein recognized by antibodies against CD4, the HIV-1 receptor. Therefore, it is possible for the virus to directly infect the parathyroid cells and also circulating autoantibodies against CD4, may impaired PTH release though direct interaction (76).


Hypocalcemia is a well-recognized metabolic derangement in some viral infections (e.g., Dengue, measles, SARS-COVID-19), indicating severe disease and worse outcomes (79-81). This is usually transient during the active disease and could be secondary to vitamin D deficiency, hypoalbuminemia secondary to infection, calcium influx into damaged cells, or hypoxia induced cytokine release mediating impaired PTH secretion or tissue response to PTH (82).


Pancreas


TYPE 1 DIABETES


Different viral infections are linked as a potential trigger for the development of Type 1 diabetes. This happens through different mechanisms; direct pancreatic β-cell lysis or immune mediated progressive β-cell destruction though autoimmunity generated from molecular mimicry, bystander activation of autoreactive T cells, and loss of regulatory T cells (83). As a result, hyperglycemia / new-onset insulin dependent diabetes develops.


Direct β-cell damage can occur as a result of viral invasion resulting in beta-cell lysis (e.g. coxsackieviruses, Rubella, mumps, enterovirus, influenza, Hep C (84-87) or inflammation following pancreatitis secondary to viral infection (hepatotropic virus, coxsackie virus, CMV, HSV, mumps, varicella-zoster virus), systemic inflammation, or immunomodulation (88). Although the incidence of diabetes following acute pancreatitis is as high as 23% (89), the incidence following viral pancreatitis had not been studied.


Virus induced autoimmunity appears to be the main mechanism for viral induced type 1 diabetes. However, the role of viruses seems to be more complex. Certain virus infections induce upregulation of  MHC class I on β cells, thereby enhancing recognition of β cells by autoreactive CD8+ cytotoxic T lymphocytes, thus inducing autoimmunity (90). However, some virus strains (LCMV, CVB) reduce the incidence or delay the onset of type 1 diabetes, probably through a TLR mediated mechanism (90). Whether inductive or protective autoimmunity depends on several factors; level of infection (more severe infections enhance diabetes while low-replicating strains of the same infection seem protective), genetic predisposition, presence of other detrimental environmental triggering factors like viruses, and direct β-cell toxins (91). Adding to the complexity, research on the intestinal virome has shown that certain changes in the intestinal virome precede autoimmunity, especially in developing type 1 diabetes in genetically susceptible people (92).


To-date, literature support viral infection (e.g. enterovirus, influenza virus, cytomegalovirus, mumps, rubella, rotavirus, and coxsackie virus) mediated autoimmune destruction of beta-cells through molecular mimicry or activating cross-reactive T cells as one of the potential mechanisms for the pathogenesis of type 1 diabetes (93).


Adrenal Glands


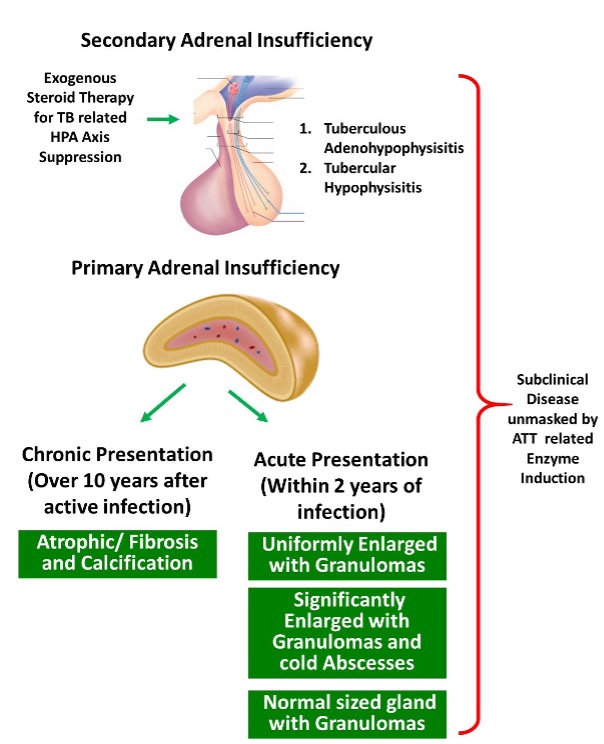
Primary adrenal insufficiency is a well-known consequence of certain viral infections. Common pathological mechanisms are direct viral invasion causing adrenalitis, adrenal hypofunction due to immunological impact from systemic inflammatory response, and viral-induced autoimmune destruction of the adrenal gland (94). Although less frequent, adrenal glands can be infected in early HSV-1 and -2 infections irrespective of the immune status of the host, with the adrenal gland having the highest number of viral particles of any organ (95). SARS-COVID 19 virus also affects the adrenals by direct cytopathic effects by the virus or due to the systemic inflammatory response (96). Antibody mediated adrenal insufficiency is also seen in SARS viral infection by producing molecular mimics to ACTH. Antibodies to the viral peptides bind both viral protein and host ACTH, may destroy ACTH or reduce the functionality of the hormone, thus reducing the ability of ACTH to induce cortisol production (97).


More severe forms of adrenal disruption (usually bilateral) are seen in less common fulminant viral infections; H5N1 avian influenza causing multifocal necrosis of adrenal cells (98),  filoviruses (e.g. Ebola) giving rise to liquefaction of the adrenals (99). Further, immunosuppression has been identified as a predisposing factor for severe adrenal infections. Echoviruses serotypes 6 and 11 which cause lethal disseminated intravascular coagulation in children can affect the adrenals with hemorrhagic necrosis (100). CMV adrenalitis had been reported in more than half of the patients with AIDS, with or without evidence of CMV viremia (101, 102).


Adrenal glands are the most commonly affected endocrine organ by HIV infection (103, 104). Early stages of HIV result in a rise in cortisol secretion, as an adaptive response to a stressor. In some patients, this rise in cortisol levels may precipitate reactivation of EBV. During the latter stages, adrenal ‘burnout’, direct viral infection, co-infection by opportunistic microbes (viral – CMV, bacterial, fungal), anti-adrenal cell antibodies (unique to HIV infection), and increased peripheral cortisol resistance may lead to progression to overt adrenal failure (105-107). An autopsy series has shown the adrenal gland to be pathologically compromised in 99.2% of cases of patients with AIDS, highlighting the degree of damage in immunocompromised state (108).


Some adrenal neoplasms have a viral etiological relationship, particularly in HIV infected people; EBV associated lymphoma of the adrenal gland and AIDS-associated neoplasms (e.g. Kaposi sarcoma from HHV-8, non-Hodgkin's lymphoma) (109).


Gonads


TESTES


Viruses are well known to cause orchitis, both unilateral and bilateral, as a consequence of a systemic viral infection. Mumps virus is the commonest viral infection affecting the testes, being the most common complication of mumps in post-pubertal men (110). Virus attacks the testicular tissues, leading to an innate immune response, inflammation, and perivascular intestinal lymphocyte infiltration. Resultant swelling exert pressure on intratesticular tissues and leads to testicular atrophy (111, 112). In addition to having varying degrees of hypogonadism, viral infection leads to subfertility; transient changes in sperm count, mobility, and morphology of fertility in unilateral disease while 30 – 87% having infertility due to oligo-asthenospermia in bilateral disease (113). Other viruses have also been identified to cause direct testicular damage including coxsackievirus, varicella, echovirus, Hep E, Zika virus, and cytomegalovirus, leading to varying degree of testicular damage but to a lesser extent than mumps virus (114-116). Certain viruses have also been detected in semen (e.g., Zika, Ebola, HIV, Hep B, Herpes and SARS-COV) and within spermatozoa (e.g., HIV, Hep B and Zika) of infected patients (117, 118). Although some of these could contribute to vertical transmission as well as affect fertility, the role of the viruses needs to be clarified with further research (119, 120).


HIV infects the testis early during the course of the disease, targeting testicular leucocytes and germ cells, but is not associated with any apparent morphological changes (121). Viral infection of the germ cells is important in vertical transmission of the disease. Further, HIV-2 and SIV but not HIV-1 are known to damage Leydig cells and reduce testosterone levels (122). HIV/AIDS also make the testes more susceptible for opportunistic infections like CMV, EBV and TB (123). Some evidence has emerged for an oncogenic effect of HIV and EBV infection on human testis but further research is needed (124). 


Although viral orchitis induces humoral immune response and result in anti-sperm antibodies, their causal link to subfertility or hypogonadism is unclear (110, 125).


OVARIES


Viruses affect ovaries through similar mechanisms as the testes; direct invasion and innate immune mediated oophoritis, resulting in changes in estrogen/progesterone to cause varying degrees of hypogonadism as well as affect fertility (126, 127). Mumps, Zika, HIV, and CMV viruses have been documented in the literature as common viral culprits affecting the ovaries and the clinical manifestations range from being silent infections to oophoritis resulting in premature menopause (126-128).


Further, some viruses (e.g. CMV) had been implicated in ovarian carcinogenesis but further studies need to clarify the exact causal effect and pathogenesis (129).


Viral Protein Mediated Modulation of Hormone System


New insights have shown that the viral genomes can produce viral peptide sequences that possess homology with human hormones, growth factors, and cytokines. Such viruses may affect human physiology not by infecting and damaging tissues nor by eliciting immune responses but by producing molecules which mimic the action of functional molecules. Recent research pointed out that viruses belonging to Iridoviridae family, which commonly infect fish, but have been also identified in the human virome (blood and feces), produce viral insulin like peptide (VILP), which has homology to human insulin/ IGF-1 (130). These VILPs could compete with endogenous ligands, stimulate or impair post receptor signaling in an autocrine, paracrine, and endocrine basis. They bind to human receptors and stimulate downstream signaling, increase glucose uptake by adipocytes in vitro and in vivo, and stimulate cell proliferation and growth, but less potently than human insulin/IGF-1 (130-132). The role of VILPs are not fully understood and further research is needed to explore the links between VILP and T1DM, insulin resistance, and certain neoplastic growths in association with viral infections.


Other “viral hormones” have also been identified, with structural and/or functional homology to human hormones including IGF-1 and IGF-2, endothelin-1 (ET1), endothelin-2, TGF-β1 and TGF-β2, fibroblast growth factors 19 and 21, inhibin, adiponectin, resistin, adipsin, and irisin in various viruses (132). However, their exact role in altering human physiology in a beneficial or harmful manner is yet to be identified.


Certain virus genome encoded proteins may alter the human genomic expression of particular hormones. A classic example is HTLV-1 infected cells producing PTHrP causing hypercalcemia by trans-activation of the PTHrP gene through the TAX viral gene product (133). Certain viral products act at the cellular receptor/post receptor level, resulting in alterations of intracellular hormonal signaling pathways. HIV-1 related Vpr and Tat protein may induce hypersensitivity of the glucocorticoid receptor (GR) resulting in lipodystrophy and insulin resistance (134). A similar mechanism is suggested for Paget’s disease, where there is a possible mumps viral peptide (Nucleocapsid transcript) induced hypersensitivity of osteoclastic receptors to vitamin D (135).  Inactivation of hormone receptor / post receptor signaling may be seen with some viruses; RSV protein miR-29a down regulates GR receptors (136); poxvirus MCV MC013L protein induces inhibition of glucocorticoid nuclear receptor transactivation (137), and E1A protein produced by Adenovirus blocks the action of glucocorticoids on transcription activity genes (138) resulting in resistance to glucocorticoids. As illustrated by the above examples, viral encoded proteins may affect the human endocrine system through alteration of endocrine signaling systems.


VIRAL INFECTIONS AS A COMPLICATION OF ENDOCRINE DISEASES


HPA Axis


Patients with untreated or undertreated adrenal insufficiency are at a higher risk of infections as well as 5-fold higher mortality from infection compared to the normal population (139, 140). Impaired innate immune function, especially with lower natural killer cells among patients with adrenal insufficiency has the potential to make them more susceptible to invading pathogens and cause a higher rate of death following viral infections (141-143). On the other hand, among patients with undiagnosed glucocorticoid deficiency, the initial HPA axis response to increase the level of glucocorticoids in response to the immune mediators will be altered, hence appropriate shaping of the downstream immune response will not take place. This may result in overactive immune response to the viral infections, affecting mortality and morbidity. Replacement regimes which restore physiological glucocorticoid secretion patterns have been shown to reduce susceptibility to infections as well as to improve mortality among patients with adrenal insufficiency (144). Therefore, appropriate steroid treatment regimens should be employed in patients with deficiencies in the HPA axis depending on their clinical state (Doubling steroid dose in mild viral infections, up to 200mg/24-hours hydrocortisone in moderate-severe viral infections) (145).


Stress induced hypercortisolemia and elevated epinephrine levels, which occur as a physiological mechanism, could mediate latent viral reactivation (HSV, EBV, VZV) through IL-6 mediated pathways, precipitating viral infections (146-148). However, the level of stress may also determine the threshold for reactivation (e.g. low stress levels precipitating VZV,  high stress levels precipitate an increase in HSV-1 DNA load) (148).


Viral infections have an increased prevalence and more severe disease course among patients who are immunosuppressed compared to the general population (149). Cushing’s syndrome or over treatment with steroids impair immune function and are considered as an immunocompromised state with high susceptibility for severe viral infections. Further, the high glucocorticoid levels may mask the initial symptoms of viral infection, delaying medical treatment and would lead to a clinical course which is more difficult to predict than in the normal population (150, 151). In addition, concordant viral infection may precipitate adrenal crisis in patients on glucocorticoid replacement therapy, which adds to the increased mortality from viral illness (139).


Pituitary


HYPOPITUITARISM


Several anterior pituitary hormones have immunoregulatory roles (152). GH, PRL, TSH, and gonadotrophins show stimulatory effects on immune cells while gonadal steroids tend to suppress immune mechanisms (153-156). Patients with multiple deficiencies of anterior pituitary hormones would therefore have variable alterations in their immune systems and show an increased susceptibility for infections and an increased tendency to develop serious infections (157).


HYPERPROLACTINEMIA


Elevated prolactin levels act as immunomodulators and enhance the host innate and adaptive immune system. Thus, prolactin may protect the host from viral infections as well as help in containing viral infections (52-54).


Thyroid Gland


Thyroidal diseases have not been shown to increase the susceptibility to viral infections.


Parathyroid Glands


HYPERPARATHYROIDISM


Several in vivo and in vitro studies have demonstrated the immunomodulatory effect of parathyroid hormone. PTH receptors had been identified on cells involved in immune pathways, including neutrophils and B and T lymphocytes (158). In patients with CKD and secondary hyperparathyroidism, elevated PTH has been shown to affect immune cells causing impaired migration, reduced phagocytic and bactericidal activity, and inhibited granulocyte chemotaxis (159, 160). T and B lymphocyte proliferation and antibody production are also affected by PTH. Thus, PTH may reduce the host response to viral infections and increase the susceptibility for severe viral infections (159).


Gonads


Gender had been one of the key epidemiological factors determining the prevalence and intensity of human viral infections, with men tending to be more susceptible (161). It was shown that females mount a stronger innate and adaptive immune response than males, giving rise to the above differences (162). Rodent studies had demonstrated that in addition to the influence of the sex chromosomes on immune cells, sex hormones also account for this difference through their effects on the immune systems by influencing cell signaling pathways resulting in differential production of cytokines / chemokines and also enhancing T-cell populations and adaptive immune systems through receptors on immune cells (163-165).


Low testosterone levels negatively impact the outcome of certain viral infections. Low levels seen in elderly men and in young men with hypogonadism result in higher morbidity and a worse clinical course following certain viral infections (e.g. Influenza) and antibody response is reduced compared to young healthy males (166). Furthermore, treatment with testosterone has been shown to reduce mortality and improve disease course in both young and elderly males with hypogonadism (166). These changes were mainly due to alterations in the immune response by testosterone receptor mediated leukocyte contraction to limit inflammation (monocytes, CD8+ T cells, degranulation and reduced cytokine production) rather than limiting viral replication (165, 167).


Estrogen acts as a potent anti-inflammatory hormone that reduces the severity of viral infections such as the influenza virus. Estrogen alters the production of chemokines, target organ recruitment of neutrophils, and cytokine responses of virus-specific CD8 T cells to protect against severe influenza (168). Estrogen shows bipotential effects; small or cyclical amounts enhancing proinflammatory cytokine responses and high or sustained circulating levels reducing production of proinflammatory cytokines and chemokines (169). Female hypogonadism in the form of natural menopause or pathological hypogonadism in young women has been shown to increase susceptibility for viral infections while the use of hormonal replacement therapy or estrogen replacement has reduced viral infections and hospital admissions (170).


Diabetes


Chronic hyperglycemia is known to be associated with altered innate immune response with reduced chemotaxis, phagocytosis, killing by polymorphonuclear cells and monocytes/macrophages, a reduced response of T cells, reduced neutrophil function, and varying disorders of humoral immunity (171). These defects in immune response predisposes patients with diabetes, especially individuals with poor glycemic control, to different viral infections as well as results in a more severe disease (172). Respiratory viruses like influenza  are known to affect patients with diabetes commonly and have a sixfold higher risk of hospitalization compared to non-diabetics (173). Further, SARS-CoV-2 virus also tends to result in more severe infections in patients with poorly controlled diabetes (174).


ENDOCRINE PARAMETERS AS MARKERS OF SEVERE VIRAL INFECTION


Severe systemic viral infections tend to cause changes in thyroid profile, which is known as Non-Thyroidal Illness (NTI)/ Sick Euthyroid syndrome. Classic changes in the thyroid profile are low T3 and normal/low TSH and fT4 levels. Low T3 levels and the presence of NTI has been associated with severe viral infections and poor outcomes in several viral infections (e.g., CNS viral infections, SARS-Cov-2) (60, 175).


Among many other markers of disease severity, low serum calcium level is also a predictor for severe disease and worse clinical outcome among patients with Dengue and SARS-COV-2 infections (82, 176, 177). The above markers could be used in addition to the usual clinical parameters for assessment and prediction of disease severity and prognosis.


COVID-19 AND THE ENDOCRINE SYSTEM


Severe acute respiratory syndrome coronavirus 2 (SARS-CoV-2) virus has spread across the globe rapidly since the end of 2019 (Corona virus disease 2019; COVID-19), causing an unprecedented pandemic with significant mortality and morbidity. Because of the novelty of the disease, the possible impact on the endocrine system is not fully understood. However, emerging evidence support that COVID-19 has significant effects on the endocrine system. Additionally, patients with certain endocrinopathies face a worse outcome from COVID-19 infections.


SARS-CoV-2 virus uses the host angiotensin-converting enzyme 2 (ACE2) as the receptor for fusion and entry into human cells in order to complete its life cycle (178). Lung is the principal target of COVID-19 virus due to an abundancy of ACE2 receptors and is responsible for the main symptoms of the disease but many endocrine organs (hypothalamus, pituitary, thyroid, pancreas, adrenals, gonads) also express ACE2 receptors abundantly and this predisposes viral entry into endocrine organs and subsequent viral induced changes (179, 180). Possible pathogenic mechanisms are direct viral entry and destruction of cells, inflammation induced cellular dysfunction, and immune/antibody mediated hormonal dysfunction.


COVID-19 and Endocrinopathies


Data on the impact of COVID-19 infections on endocrine organs are emerging. Previous SARS viral infection outbreaks have revealed a spectrum of endocrinopathies which span from asymptomatic disease to gross hypofunction of endocrine organs (hypothalamus, pituitary, thyroid, adrenals, pancreas and gonads). Considering the similarities of other SARS viruses and SARS-Cov-2 (COVID-19) in structure and pathogenic mechanisms, we can assume that a similar spectrum of diseases can be expected during COVID-19 pandemic.  Table 3 outlines a summary of available data on the impact of COVID-19 infection on endocrine organs.


Table 3. COVID-19 Infection Related Endocrinopathies

Gland

Outcome

Mechanism

Reference

Hypothalamus / Pituitary

Hypopituitarism (Hypocortisolism / Secondary hypothyroidism)

Hypothalamic involvement

(29)*

(181, 182)

Hypophysitis from direct viral infiltration

(29)*, (183)

Molecular mimicry for ACTH inducing antibody production, with subsequent destruction of ACTH

(97)*

Central diabetes insipidus

Hypoxic Encephalopathy following COVID-19 pneumonia

Autoimmune neuroendocrine derangement

(184)

SIADH

Through cytokines

-        Non-osmotic release of ADH

-        Hypoxic pulmonary vasoconstriction pathway inducing ADH release

Intravascular volume depletion inducing non-osmotic baroreceptor activation

Pain inducing ADH release through hypothalamus

(185-187)

Thyroid gland

Primary hypothyroidism

Direct viral invasion

Consequence of subacute thyroiditis

(29)*

(188, 189)

Subacute thyroiditis

Direct viral invasion and inflammation

(188, 189)

Grave’s disease

Virus induced trigger for autoimmunity

(190)

Sick euthyroid syndrome

Cytokine induced dysregulation of deiodinases

(190, 191)

Parathyroid gland

Data limited

Pancreas

Diabetes †

(Type 1 & Type 2)

Inflammation / cytokine activation and resultant insulin resistance ‡

(192)


Viral invasion and destruction of islet cells

Development of autoimmunity against islet cells ‡

(193)

Pancreatitis

(194)

Diabetes ketoacidosis

Worsening of pre-existing diabetes by above ‡ mechanisms

New onset of type 1 diabetes

(195)

Adrenal glands

Primary adrenal insufficiency

Adrenal necrosis and vasculitis from direct cytopathic effect or inflammatory response

(196)

Bilateral adrenal hemorrhage

(197)

Gonads

(Testis)

Epididymo-orchitis

Inflammation / direct viral invasion

(198)

Hypogonadism †


Direct testicular damage by the virus

Indirect inflammatory/immune response in the testicles

(199, 200)

Impairment of sperm quality †

Direct inversion of testes/seminiferous tubules / semen

Elevated immune response in testis

Autoimmune orchitis

(201)

Gonads (Ovary)

Data limited

* Evidence based on SARS-Cov-1/ SARS virus infections

† Need further scientific evidence to establish the effect of infection on endocrine dysfunction


In addition to the COVID-19 virus induced hormonal changes, certain pre-existing endocrinopathies may influence the disease course of COVID-19. Patients with immunocompromise due to active Cushing’s disease or long term poorly controlled diabetes are more prone for severe COVID-19 infections and have an increased morbidity and mortality (174, 202). Therefore, care must be taken to treat these patients to achieve good control of their disease state as well as to recognize the increased severity of COVID-19 infections. Patients with adrenal insufficiency are also considered to have an increased risk of  more severe COVID-19 infections with a higher complication risk, including adrenal crisis and mortality (139, 203). Careful management of glucocorticoid replacement would minimize the risk.


CONCLUSION


Viruses, being one of the common infective agents affecting humans, play an important role related to physiological and pathological changes in the endocrine system. Through different mechanisms; direct and indirect, viruses influence endocrine organs causing hypo- or hyperfunction. Such changes can result in transient or permanent changes in endocrine glands. On the other hand, certain endocrinopathies may affect the course of viral infections, by altering immune mechanisms. Therefore, thorough knowledge of the interaction of viruses with the endocrine system is important and further research is warranted to gain more detailed insights.


REFERENCES


  1. Microbiology by numbers. Nature Reviews Microbiology. 2011;9(9):628-.
  2. Rohwer F, Prangishvili, D. Lindell, D. Roles of viruses in the environment. . Environ Microbiol. 2009;11:2771–4.
  3. D.J. G. Endogenous retroviruses in the human genome sequence. Genome Biology 2001;2:171.
  4. Nexø BA, Villesen P, Nissen KK, Lindegaard HM, Rossing P, Petersen T, et al. Are human endogenous retroviruses triggers of autoimmune diseases? Unveiling associations of three diseases and viral loci. Immunologic research. 2016;64(1):55-63.
  5. Gonzalez-Cao M, Iduma P, Karachaliou N, Santarpia M, Blanco J, Rosell R. Human endogenous retroviruses and cancer. Cancer biology & medicine. 2016;13(4):483-8.
  6. Hannigan GD, Meisel JS, Tyldsley AS, Zheng Q, Hodkinson BP, SanMiguel AJ, et al. The human skin double-stranded DNA virome: topographical and temporal diversity, genetic enrichment, and dynamic associations with the host microbiome. mBio. 2015;6(5):e01578-15.
  7. Abeles SR, Robles-Sikisaka R, Ly M, Lum AG, Salzman J, Boehm TK, et al. Human oral viruses are personal, persistent and gender-consistent. The ISME journal. 2014;8(9):1753-67.
  8. Guerrant RL, Walker DH, Weller PF. Tropical Infectious Diseases: Principles, Pathogens and Practice E-Book: Elsevier Health Sciences; 2011.
  9. N. James MacLachlan EJD. Virus Replication.Fenner's Veterinary Virology. 5th Edition ed: Academic Press; 2017. p. 17-45.
  10. Dimitrov DS. Virus entry: molecular mechanisms and biomedical applications. Nature Reviews Microbiology. 2004;2:109-22.
  11. Kino T, Chrousos GP. Virus-mediated modulation of the host endocrine signaling systems: clinical implications. Trends Endocrinol Metab. 2007;18(4):159-66.
  12. Scott N. Muller BTR. Immune response to viruses. Clinical immunology. 2008:421-31.
  13. Wittek A.E. QGVJ. Immunology of viral infections In: R.B B, editor. Textbook of Human Virology 2nd edn. 2nd edition ed: Mosby-Year Book; 1991. p. 116–55.
  14. Vemuri RS, E.M.; Chieppa, M.; Eri, R.; Kavanagh, K. . Beyond Just Bacteria: Functional Biomes in the Gut Ecosystem Including Virome, Mycobiome, Archaeome and Helminths. Microorganisms 2020;8:483.
  15. M.B. O. Molecular mimicry and immune-mediated diseases. FASEB J. 1998;12:1255–65.
  16. Silverman MN, Pearce BD, Biron CA, Miller AH. Immune modulation of the hypothalamic-pituitary-adrenal (HPA) axis during viral infection. Viral Immunol. 2005;18(1):41-78.
  17. Leung DY, Hamid Q, Vottero A, Szefler SJ, Surs W, Minshall E, et al. Association of glucocorticoid insensitivity with increased expression of glucocorticoid receptor beta. The Journal of experimental medicine. 1997;186(9):1567-74.
  18. Dhabhar FS, McEwen BS. Stress-induced enhancement of antigen-specific cell-mediated immunity. The Journal of Immunology. 1996;156(7):2608-15.
  19. Dhabhar FS, Malarkey WB, Neri E, McEwen BS. Stress-induced redistribution of immune cells—From barracks to boulevards to battlefields: A tale of three hormones–Curt Richter Award Winner. Psychoneuroendocrinology. 2012;37(9):1345-68.
  20. Dhabhar FS, McEwen BS. Acute stress enhances while chronic stress suppresses cell-mediated immunityin vivo: A potential role for leukocyte trafficking. Brain, behavior, and immunity. 1997;11(4):286-306.
  21. Miller AH, Spencer RL, Pearce BD, Pisell TL, Tanapat P, Leung JJ, et al. 1996 Curt P. Richter Award. Effects of viral infection on corticosterone secretion and glucocorticoid receptor binding in immune tissues. Psychoneuroendocrinology. 1997;22(6):455-74.
  22. Ben-Hut T, Conforti N, Itzik A, Weidenfeld J. Effects of HSV-1, a neurotropic virus, on the hypothalamic-pituitary-adrenocortical axis in rats. Brain Research. 1995;702(1):17-22.
  23. Pekic S, Popovic V. DIAGNOSIS OF ENDOCRINE DISEASE: Expanding the cause of hypopituitarism. European journal of endocrinology. 2017;176(6):R269-r82.
  24. Schaefer S, Boegershausen N, Meyer S, Ivan D, Schepelmann K, Kann PH. Hypothalamic-pituitary insufficiency following infectious diseases of the central nervous system. European journal of endocrinology. 2008;158(1):3-9.
  25. Tsiakalos A, Xynos ID, Sipsas NV, Kaltsas G. Pituitary Insufficiency after Infectious Meningitis: A Prospective Study. The Journal of Clinical Endocrinology & Metabolism. 2010;95(7):3277-81.
  26. Dhanwal D, Kumar S, Vyas A, Saxena A. Hypothalamic pituitary dysfunction in acute nonmycobacterial infections of central nervous system. Indian Journal of Endocrinology and Metabolism. 2011;15(7):233-7.
  27. Tanriverdi F, Alp E, Demiraslan H, Dokmetas HS, Unluhizarci K, Doganay M, et al. Investigation of pituitary functions in patients with acute meningitis: a pilot study. Journal of endocrinological investigation. 2008;31(6):489-91.
  28. Partanen T KM, Leisti P, Salmela P, Pääkkö E, Karttunen A, Sintonen H, Risteli L, Hautala N, Vapalahti O, Vaheri A, Kauma H, Hautala T. . Long-term hormonal follow-up after human Puumala hantavirus infection. Clin Endocrinol (Oxf) 2016;84:85-91.
  29. Leow MK KD, Ng AW, Ong KC, Kaw GJ, Lee LS. Hypocortisolism in survivors of severe acute respiratory syndrome (SARS). Clin Endocrinol (Oxf). 2005;63(2):197-202.
  30. Sullivan WM, Kelley GG, O'Connor PG, Dickey PS, Kim JH, Robbins R, et al. Hypopituitarism associated with a hypothalamic CMV infection in a patient with AIDS. The American Journal of Medicine. 1992;92(2):221-3.
  31. Chapter 20 Hypothalamic infections. In: Swaab DF, editor. Handbook of Clinical Neurology. 80: Elsevier; 2004. p. 91-9.
  32. Somasundaram NP, Ranathunga I, Ratnasamy V, Wijewickrama PSA, Dissanayake HA, Yogendranathan N, et al. The Impact of SARS-Cov-2 Virus Infection on the Endocrine System. Journal of the Endocrine Society. 2020;4(8).
  33. Pekic S, Miljic D, Popovic V. Infections of the Hypothalamic-Pituitary Region.Endotext [Internet]: MDText. com, Inc.; 2018.
  34. Aita K, Shiga J. Herpes simplex virus types 1 and 2 infect the mouse pituitary gland and induce apoptotic cell death. Archives of virology. 2004;149(12):2443-51.
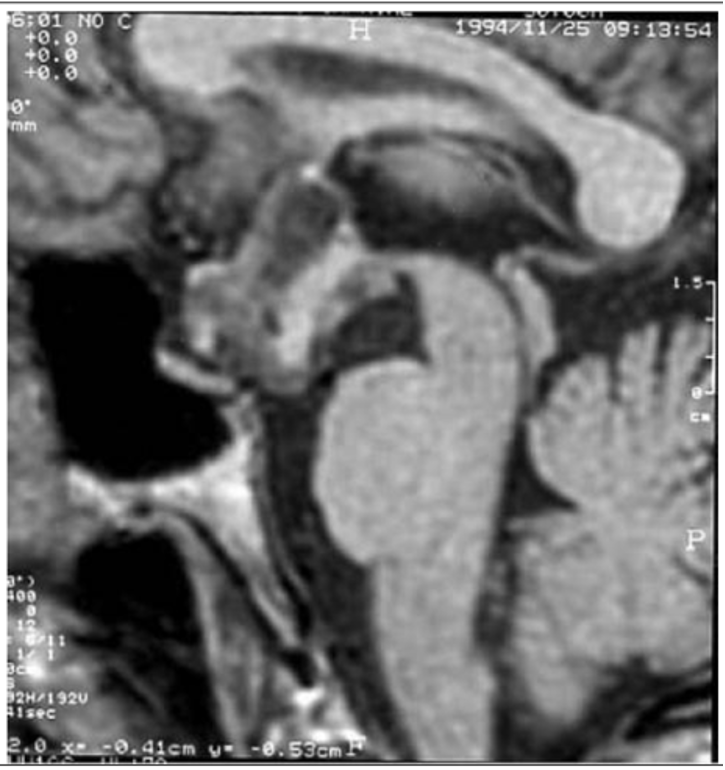
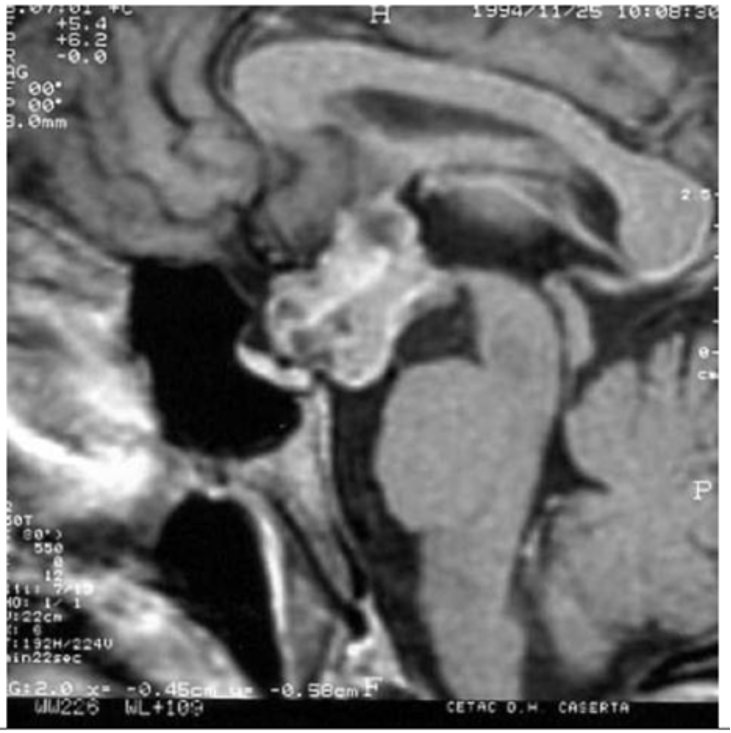
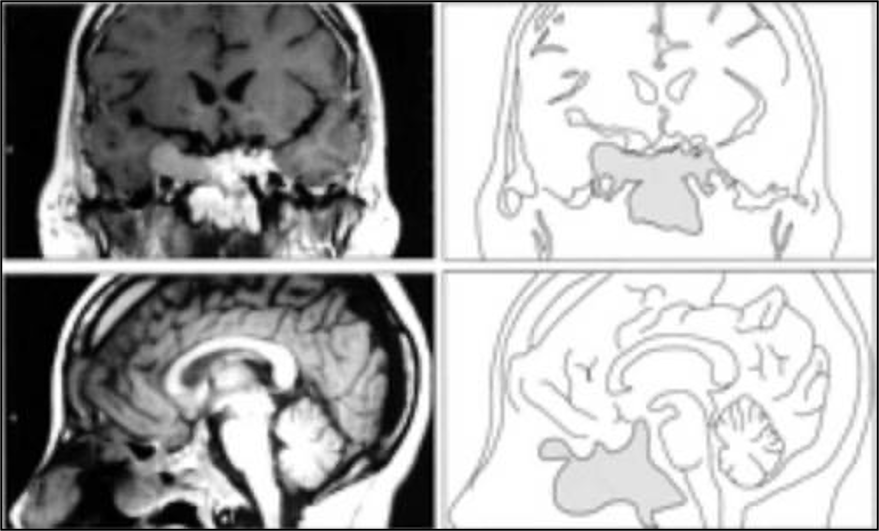
  35. Hautala T, Sironen T, Vapalahti O, Pääkkö E, Särkioja T, Salmela PI, et al. Hypophyseal hemorrhage and panhypopituitarism during Puumala Virus Infection: Magnetic Resonance Imaging and detection of viral antigen in the hypophysis. Clinical infectious diseases : an official publication of the Infectious Diseases Society of America. 2002;35(1):96-101.
  36. Sellmeyer DE, Grunfeld C. Endocrine and metabolic disturbances in human immunodeficiency virus infection and the acquired immune deficiency syndrome. Endocrine reviews. 1996;17(5):518-32.
  37. Yousuf T L, L. Bacal, A. Krikorian, A. A novel association between pituitary tumor apoplexy and influenza A. AACE Clinical Case Rep 2016. 2016;2:e143-e5.
  38. Suh DC, Park JS, Park SK, Lee HK, Chang KH. Pituitary hemorrhage as a complication of hantaviral disease. AJNR American journal of neuroradiology. 1995;16(1):175-8; discussion 9-80.
  39. Figurnov VA, Marunich NA, Gavrilov AV, Figurnova EV. [Late consequences of hemorrhagic fever with renal syndrome in a woman who had it during pregnancy]. Klinicheskaia meditsina. 2007;85(5):71-2.
  40. Raj H, Kamalanathan S, Sahoo JP, Kadhiravan T. Varicella causing remission of Cushing's disease. BMJ case reports. 2018;2018:bcr2018225867.
  41. Pal R. COVID-19, hypothalamo-pituitary-adrenal axis and clinical implications. Endocrine. 2020;68(2):251-2.
  42. Yoon JW, Choi DS, Liang HC, Baek HS, Ko IY, Jun HS, et al. Induction of an organ-specific autoimmune disease, lymphocytic hypophysitis, in hamsters by recombinant rubella virus glycoprotein and prevention of disease by neonatal thymectomy. J Virol. 1992;66(2):1210-4.
  43. Hägg E, Aström L, Steen L. Persistent hypothalamic-pituitary insufficiency following acute meningoencephalitis. A report of two cases. Acta medica Scandinavica. 1978;203(3):231-5.
  44. Kupari M, Pelkonen R, Valtonen V. Post-encephalitic hypothalamic-pituitary insufficiency. Acta endocrinologica. 1980;94(4):433-8.
  45. Lim AKH, Paramaswaran S, Jellie LJ, Junckerstorff RK. A Cross-Sectional Study of Hyponatremia Associated with Acute Central Nervous System Infections. Journal of Clinical Medicine. 2019;8(11):1801.
  46. Grajecki DS, Haas CS, Hubold C, Lehnert H. Sucessfull treatment of EBV-associated SIADH with V2 receptor antagonist. Exp Clin Endocrinol Diabetes. 2013;121(03):P68.
  47. Kuriki A, Ishihara K, Satoh H, Sugie M, Kato H, Kawamura M. [Syndrome of inappropriate secretion of anti-diuretic hormone associated with limbic encephalitis due to herpes simplex virus infection--a case report]. Rinsho shinkeigaku = Clinical neurology. 2008;48(3):184-90.
  48. Ahn HJ, Chung JH, Kim DM, Yoon NR, Kim CM. Hemorrhagic fever with renal syndrome accompanied by panhypopituitarism and central diabetes insipidus: a case report. Journal of neurovirology. 2018;24(3):382-7.
  49. Moses AM, Thomas DG, Canfield MC, Collins GH. Central Diabetes Insipidus due to Cytomegalovirus Infection of the Hypothalamus in a Patient with Acquired Immunodeficiency Syndrome: A Clinical, Pathological, and Immunohistochemical Case Study. The Journal of Clinical Endocrinology & Metabolism. 2003;88(1):51-4.
  50. Lee YJ, Yang D, Shyur SD, Chiu NC. Neurogenic diabetes insipidus in a child with fatal Coxsackie virus B1 encephalitis. Journal of pediatric endocrinology & metabolism : JPEM. 1995;8(4):301-4.
  51. Madhoun ZT, DuBois DB, Rosenthal J, Findlay JC, Aron DC. Central diabetes insipidus: a complication of herpes simplex type 2 encephalitis in a patient with AIDS. Am J Med. 1991;90(5):658-9.
  52. Borba VV, Zandman-Goddard G, Shoenfeld Y. Prolactin and Autoimmunity. Frontiers in Immunology. 2018;9(73).
  53. Parra A, Ramírez-Peredo J, Larrea F, Cabrera V, Coutiño B, Torres I, et al. Decreased dopaminergic tone and increased basal bioactive prolactin in men with human immunodeficiency virus infection. Clin Endocrinol (Oxf). 2001;54(6):731-8.
  54. Ochoa-Amaya JE, Malucelli BE, Cruz-Casallas PE, Nasello AG, Felicio LF, Carvalho-Freitas MI. Acute and chronic stress and the inflammatory response in hyperprolactinemic rats. Neuroimmunomodulation. 2010;17(6):386-95.
  55. McGill F, Griffiths MJ, Bonnett LJ, Geretti AM, Michael BD, Beeching NJ, et al. Incidence, aetiology, and sequelae of viral meningitis in UK adults: a multicentre prospective observational cohort study. The Lancet Infectious Diseases. 2018;18(9):992-1003.
  56. Czupryna P, Moniuszko A, Garkowski A, Pancewicz S, Zajkowska J. Comparison of hyponatremia and SIADH frequency in patients with tick borne encephalitis and meningitis of other origin. Scandinavian Journal of Clinical and Laboratory Investigation. 2016;76(2):159-64.
  57. Swart RM, Hoorn EJ, Betjes MG, Zietse R. Hyponatremia and Inflammation: The Emerging Role of Interleukin-6 in Osmoregulation. Nephron Physiology. 2011;118(2):p45-p51.
  58. Scheinpflug K, Schalk E, Reschke K, Franke A, Mohren M. Diabetes insipidus due to herpes encephalitis in a patient with diffuse large cell lymphoma. A case report. Exp Clin Endocrinol Diabetes. 2006;114(1):31-4.
  59. Torres AM, Kazee AM, Simon H, Knudson PE, Weinstock RS. Central diabetes insipidus due to herpes simplex in a patient immunosuppressed by Cushing's syndrome. Endocrine practice : official journal of the American College of Endocrinology and the American Association of Clinical Endocrinologists. 2000;6(1):26-8.
  60. Zou R, Wu C, Zhang S, Wang G, Zhang Q, Yu B, et al. Euthyroid Sick Syndrome in Patients With COVID-19. Frontiers in Endocrinology. 2020;11(798).
  61. Jonklaas J, Bianco AC, Bauer AJ, Burman KD, Cappola AR, Celi FS, et al. Guidelines for the treatment of hypothyroidism: prepared by the american thyroid association task force on thyroid hormone replacement. Thyroid. 2014;24(12):1670-751.
  62. Kojima M, Nakamura S, Oyama T, Sugihara S, Sakata N, Masawa N. Cellular composition of subacute thyroiditis. an immunohistochemical study of six cases. Pathology, research and practice. 2002;198(12):833-7.
  63. Eylan E, Zmucky R, Sheba C. Mumps virus and subacute thyroiditis; evidence of a causal association. Lancet (London, England). 1957;272(6978):1062-3.
  64. VOLPÉ R, ROW VV, EZRIN C. Circulating Viral and Thyroid Antibodies in Subacute Thyroiditis1. The Journal of Clinical Endocrinology & Metabolism. 1967;27(9):1275-84.
  65. Volpé R. The management of subacute (DeQuervain's) thyroiditis. Thyroid. 1993;3(3):253-5.
  66. Desailloud R, Hober D. Viruses and thyroiditis: an update. Virol J. 2009;6:5-.
  67. Dumoulin F, Liese H. Acute hepatitis E virus infection and autoimmune thyroiditis: yet another trigger? BMJ case reports. 2012;2012.
  68. Mori K, Yoshida K. Viral infection in induction of Hashimoto's thyroiditis: A key player or just a bystander? Current opinion in endocrinology, diabetes, and obesity. 2010;17:418-24.
  69. Davies TF. Infection and Autoimmune Thyroid Disease. The Journal of Clinical Endocrinology & Metabolism. 2008;93(3):674-6.
  70. Takeda K, Kaisho T, Akira S. Toll-like receptors. Annual review of immunology. 2003;21:335-76.
  71. Burch HB, Nagy EV, Lukes YG, Cai WY, Wartofsky L, Burman KD. Nucleotide and amino acid homology between the human thyrotropin receptor and the HIV-1 Nef protein: identification and functional analysis. Biochemical and biophysical research communications. 1991;181(1):498-505.
  72. Akahori H, Takeshita Y, Saito R, Kaneko S, Takamura T. Graves' Disease Associated with Infectious Mononucleosis due to Primary Epstein-Barr Virus Infection: Report of 3 Cases. Internal medicine (Tokyo, Japan). 2010;49:2599-603.
  73. Wang W, Ye Y, Yao H, Sun L, Wang A, Wang Z. Evaluation and observation of serum thyroid hormone and parathyroid hormone in patients with severe acute respiratory syndrome. J Chin Antituberculous Assoc. 2003;25:232-4.
  74. Ciampolillo A, Marini V, Mirakian R, Buscema M, Schulz T, Pujol-Borrell R, et al. Retrovirus-like sequences in Graves' disease: implications for human autoimmunity. Lancet (London, England). 1989;1(8647):1096-100.
  75. Mulcahy HEM, F.E. Freaney, R. Hegarty J.E. Parathyroid crisis and acute viral hepatitis B infection. Postgrad Med J. 1993;69:408-10.
  76. Hellman P, Albert J, Gidlund M, Klareskog L, Rastad J, Akerström G, et al. Impaired parathyroid hormone release in human immunodeficiency virus infection. AIDS research and human retroviruses. 1994;10(4):391-4.
  77. Elkattawy SA, R. Ayad, S. A Novel Case of Hypoparathyroidism Secondary to SARS-CoV-2 Infection. Cureus 2020;12(8):e10097.
  78. Sandhu S, Desai A, Batra M, Girdhar R, Chatterjee K, Kemp EH, et al. Severe Symptomatic Hypocalcemia from HIV Related Hypoparathyroidism. Case Reports in Endocrinology. 2018;2018:8270936.
  79. Singh A, Dnyanesh D. The prevalence of hypocalcemia in children with dengue infection: A 1-year cross-sectional study. Indian Journal of Health Sciences and Biomedical Research. 2019;12:166.
  80. Sobel R, Einhorn S, Maislos M, Shainkin-Kestenbaum R, Shany S, Horowitz J. Transitory Hypocalcemia Complicating Measles. Archives of Internal Medicine. 1985;145(11):2043-4.
  81. Jia-Kui S, Wen-Hao Z, Lei Z, Ying L, Jing-Jing L, Xiao-Hua K, et al. Research Square. 2021.
  82. Liu J, Han P, Wu J, Gong J, Tian D. Prevalence and predictive value of hypocalcemia in severe COVID-19 patients. Journal of Infection and Public Health. 2020;13(9):1224-8.
  83. Antonelli A, Ferrari SM, Di Domenicantonio A, Ferrannini E, Fallahi P. Chapter 53 - Viral Infections and Type 1 Diabetes. In: Shoenfeld Y, Agmon-Levin N, Rose NR, editors. Infection and Autoimmunity (Second Edition). Amsterdam: Academic Press; 2015. p. 877-89.
  84. Masini M, Campani D, Boggi U, Menicagli M, Funel N, Pollera M, et al. Hepatitis C Virus Infection and Human Pancreatic β-Cell Dysfunction. Diabetes Care. 2005;28(4):940-1.
  85. Capua I, Mercalli A, Pizzuto MS, Romero-Tejeda A, Kasloff S, De Battisti C, et al. Influenza A Viruses Grow in Human Pancreatic Cells and Cause Pancreatitis and Diabetes in an Animal Model. Journal of Virology. 2013;87(1):597-610.
  86. Sarmiento L, Frisk G, Anagandula M, Hodik M, Barchetta I, Netanyah E, et al. Echovirus 6 Infects Human Exocrine and Endocrine Pancreatic Cells and Induces Pro-Inflammatory Innate Immune Response. Viruses. 2017;9(2):25.
  87. Ginsberg-Fellner F, Witt ME, Fedun B, Taub F, Dobersen MJ, McEvoy RC, et al. Diabetes mellitus and autoimmunity in patients with the congenital rubella syndrome. Reviews of infectious diseases. 1985;7 Suppl 1:S170-6.
  88. Rawla P, Bandaru SS, Vellipuram AR. Review of Infectious Etiology of Acute Pancreatitis. Gastroenterology Res. 2017;10(3):153-8.
  89. Zhi M, Zhu X, Lugea A, Waldron RT, Pandol SJ, Li L. Incidence of New Onset Diabetes Mellitus Secondary to Acute Pancreatitis: A Systematic Review and Meta-Analysis. Front Physiol. 2019;10:637-.
  90. Boettler T, von Herrath M. Protection against or triggering of Type 1 diabetes? Different roles for viral infections. Expert Rev Clin Immunol. 2011;7(1):45-53.
  91. Christen U, von Herrath MG. Do viral infections protect from or enhance type 1 diabetes and how can we tell the difference? Cellular & Molecular Immunology. 2011;8(3):193-8.
  92. Zhao G, Vatanen T, Droit L, Park A, Kostic AD, Poon TW, et al. Intestinal virome changes precede autoimmunity in type I diabetes-susceptible children. Proceedings of the National Academy of Sciences. 2017;114(30):E6166-E75.
  93. Pusch E, Renz H, Skevaki C. Respiratory virus-induced heterologous immunity. Allergo Journal. 2018;27(3):28-45.
  94. Paolo WF, Nosanchuk JD. Adrenal infections. International Journal of Infectious Diseases. 2006;10(5):343-53.
  95. Potratz D, Brake B, Dienes H, Schulz TF, Hosp M, Dierich M, et al. Herpes simplex virus type 1 and 2 in the adrenal glands: replication and histopathology. Archives of virology. 1986;90(3-4):207-22.
  96. Ding Y, He L, Zhang Q, Huang Z, Che X, Hou J, et al. Organ distribution of severe acute respiratory syndrome (SARS) associated coronavirus (SARS‐CoV) in SARS patients: implications for pathogenesis and virus transmission pathways. The Journal of Pathology: A Journal of the Pathological Society of Great Britain and Ireland. 2004;203(2):622-30.
  97. Wheatland R. Molecular mimicry of ACTH in SARS–implications for corticosteroid treatment and prophylaxis. Medical hypotheses. 2004;63(5):855-62.
  98. Lee C-W, Suarez DL, Tumpey TM, Sung H-W, Kwon Y-K, Lee Y-J, et al. Characterization of highly pathogenic H5N1 avian influenza A viruses isolated from South Korea. Journal of virology. 2005;79(6):3692-702.
  99. Mahanty S, Bray M. Pathogenesis of filoviral haemorrhagic fevers. The Lancet infectious diseases. 2004;4(8):487-98.
  100. Ventura KC, Hawkins H, Smith MB, Walker DH. Fatal neonatal echovirus 6 infection: autopsy case report and review of the literature. Modern Pathology. 2001;14(2):85-90.
  101. Pinching AJ. Cytomegalovirus infection in the acquired immune deficiency syndrome. Journal of Antimicrobial Chemotherapy. 1989;23(suppl_E):31-6.
  102. Glasgow BJ, Steinsapir KD, Anders K, Layfield LJ. Adrenal pathology in the acquired immune deficiency syndrome. American Journal of Clinical Pathology. 1985;84(5):594-7.
  103. Hofbauer LC, Heufelder AE. Endocrine implications of human immunodeficiency virus infection. Medicine. 1996;75(5):262-78.
  104. Welch K, Finkbeiner W, Alpers CE, Blumenfeld W, Davis RL, Smuckler EA, et al. Autopsy findings in the acquired immune deficiency syndrome. Jama. 1984;252(9):1152-9.
  105. Salim YS, Faber V, Wiik A, Andersen PL, HØIer‐Madsen M, Mouritsen S. Anti‐corticosteroid antibodies in AIDS patients. Apmis. 1988;96(7‐12):889-94.
  106. Eledrisi MS, Verghese AC. Adrenal insufficiency in HIV infection: a review and recommendations. The American journal of the medical sciences. 2001;321(2):137-44.
  107. Marik PE, Kiminyo K, Zaloga GP. Adrenal insufficiency in critically ill patients with human immunodeficiency virus. Critical care medicine. 2002;30(6):1267-73.
  108. Rodrigues D, Reis M, Teixeira V, Silva-Vergara M, Correia Filho D, Adad S, et al. Pathologic findings in the adrenal glands of autopsied patients with acquired immunodeficiency syndrome. Pathology-Research and Practice. 2002;198(1):25-30.
  109. Ohsawa M, Tomita Y, Hashimoto M, Yasunaga Y, Kanno H, Aozasa K. Malignant lymphoma of the adrenal gland: its possible correlation with the Epstein-Barr virus. Modern pathology: an official journal of the United States and Canadian Academy of Pathology, Inc. 1996;9(5):534.
  110. Masarani M, Wazait H, Dinneen M. Mumps orchitis. J R Soc Med. 2006;99(11):573-5.
  111. Barták V. Sperm count, morphology and motility after unilateral mumps orchitis. Journal of reproduction and fertility. 1973;32(3):491-4.
  112. Wu H, Shi L, Wang Q, Cheng L, Zhao X, Chen Q, et al. Mumps virus-induced innate immune responses in mouse Sertoli and Leydig cells. Scientific Reports. 2016;6(1):19507.
  113. Casella R, Leibundgut B, Lehmann K, Gasser TC. Mumps orchitis: report of a mini-epidemic. The Journal of urology. 1997;158(6):2158-61.
  114. Adamopoulos DA, Lawrence DM, Vassilopoulos P, Contoyiannis PA, Swyer GI. Pituitary-testicular interrelationships in mumps orchitis and other viral infections. Br Med J. 1978;1(6121):1177-80.
  115. Craighead JE. CHAPTER 1 - Enteroviruses. In: Craighead JE, editor. Pathology and Pathogenesis of Human Viral Disease. San Diego: Academic Press; 2000. p. 1-28.
  116. Matusali G, Houzet L, Satie A-P, Mahé D, Aubry F, Couderc T, et al. Zika virus infects human testicular tissue and germ cells. The Journal of Clinical Investigation. 2018;128(10):4697-710.
  117. Huang JM, Huang TH, Qiu HY, Fang XW, Zhuang TG, Qiu JW. Studies on the integration of hepatitis B virus DNA sequence in human sperm chromosomes. Asian journal of andrology. 2002;4(3):209-12.
  118. Joguet G MJM, Matusali G, Hamdi S, Walschaerts M, Pavili L, Guyomard S, Prisant N, Lamarre P, Dejucq-Rainsford N, Pasquier C, Bujan L. Effect of acute Zika virus infection on sperm and virus clearance in body fluids: a prospective observational study. The Lancet Infectious Diseases. 2017;17 (11):1200-8.
  119. Feldmann H. Virus in Semen and the Risk of Sexual Transmission. New England Journal of Medicine. 2018;378(15):1440-1.
  120. Li D, Jin M, Bao P, Zhao W, Zhang S. Clinical Characteristics and Results of Semen Tests Among Men With Coronavirus Disease 2019. JAMA Network Open. 2020;3(5):e208292-e.
  121. Le Tortorec A, Satie A-P, Denis H, Rioux-Leclercq N, Havard L, Ruffault A, et al. Human prostate supports more efficient replication of HIV-1 R5 than X4 strains ex vivo. Retrovirology. 2008;5(1):119.
  122. Willey S, Roulet V, Reeves JD, Kergadallan M-L, Thomas E, McKnight Á, et al. Human Leydig cells are productively infected by some HIV-2 and SIV strains but not by HIV-1. Aids. 2003;17(2):183-8.
  123. Yuan J. Genitourinary Presentation of Tuberculosis. Reviews in urology. 2015;17(2):102-5.
  124. Garolla A, Vitagliano A, Muscianisi F, Valente U, Ghezzi M, Andrisani A, et al. Role of Viral Infections in Testicular Cancer Etiology: Evidence From a Systematic Review and Meta-Analysis. Frontiers in endocrinology. 2019;10:355-.
  125. Naz RK, Ellaurie M, Phillips TM, Hall J. Antisperm antibodies in human immunodeficiency virus infection: effects on fertilization and embryonic development. Biology of reproduction. 1990;42(5-6):859-68.
  126. Morrison JC, Givens JR, Wiser WL, Fish SA. Mumps oophoritis: a cause of premature menopause. Fertility and sterility. 1975;26(7):655-9.
  127. Morelli F, Souza RP, Cruz TEd, Damke GMZF, Damke E, Suehiro TT, et al. Zika virus infection in the genital tract of non-pregnant females: a systematic review. Revista do Instituto de Medicina Tropical de São Paulo. 2020;62.
  128. Manfredi R, Alampi G, Talò S, Calza L, Tadolini M, Martinelli GN, et al. Silent oophoritis due to cytomegalovirus in a patient with advanced HIV disease. International journal of STD & AIDS. 2000;11(6):410-2.
  129. Ingerslev K, Hogdall E, Schnack TH, Skovrider-Ruminski W, Hogdall C, Blaakaer J. The potential role of infectious agents and pelvic inflammatory disease in ovarian carcinogenesis. Infectious Agents and Cancer. 2017;12(1):25.
  130. Altindis E, Cai W, Sakaguchi M, Zhang F, GuoXiao W, Liu F, et al. Viral insulin-like peptides activate human insulin and IGF-1 receptor signaling: A paradigm shift for host–microbe interactions. Proceedings of the National Academy of Sciences. 2018;115(10):2461-6.
  131. Irwin DM. Viral Insulin/IGF-1–Like Peptides: Novel Regulators of Physiology and Pathophysiology? Endocrinology. 2018;159(11):3659-60.
  132. Huang Q, Kahn CR, Altindis E. Viral Hormones: Expanding Dimensions in Endocrinology. Endocrinology. 2019;160(9):2165-79.
  133. Watanabe T, Yamaguchi K, Takatsuki K, Osame M, Yoshida M. Constitutive expression of parathyroid hormone-related protein gene in human T cell leukemia virus type 1 (HTLV-1) carriers and adult T cell leukemia patients that can be trans-activated by HTLV-1 tax gene. The Journal of experimental medicine. 1990;172(3):759-65.
  134. Kino T, De Martino MU, Charmandari E, Mirani M, Chrousos GP. Tissue glucocorticoid resistance/hypersensitivity syndromes. The Journal of steroid biochemistry and molecular biology. 2003;85(2-5):457-67.
  135. Roodman GD, Windle JJ. Paget disease of bone. The Journal of clinical investigation. 2005;115(2):200-8.
  136. Glantschnig C, Koenen M, Lozano MG, Karbiener M, Cummins C, Blüher M, et al. A miR-29a-driven negative feedback loop regulates the glucocorticoid receptor in health and disease. Diabetologie und Stoffwechsel. 2018;13(03):LB FV 7.
  137. Chen N, Baudino T, MacDonald PN, Green M, Kelley WL, Burnett JW, et al. Selective inhibition of nuclear steroid receptor function by a protein from a human tumorigenic poxvirus. Virology. 2000;274(1):17-25.
  138. Brockmann D, Esche H. The multifunctional role of E1A in the transcriptional regulation of CREB/CBP-dependent target genes. Current topics in microbiology and immunology. 2003;272:97-129.
  139. Puig-Domingo M, Marazuela M, Giustina A. COVID-19 and endocrine diseases. A statement from the European Society of Endocrinology. Endocrine. 2020;68(1):2-5.
  140. Bergthorsdottir R, Leonsson-Zachrisson M, Odén A, Johannsson G. Premature mortality in patients with Addison’s disease: a population-based study. The Journal of Clinical Endocrinology & Metabolism. 2006;91(12):4849-53.
  141. Quinkler M, Ekman B, Zhang P, Isidori AM, Murray RD, Investigators EA. Mortality data from the European Adrenal Insufficiency Registry—Patient characterization and associations. Clinical endocrinology. 2018;89(1):30-5.
  142. Tresoldi AS, Sumilo D, Perrins M, Toulis KA, Prete A, Reddy N, et al. Increased infection risk in Addison’s disease and congenital adrenal hyperplasia: a primary care database cohort study. The Journal of Clinical Endocrinology & Metabolism. 2020;105(2):418-29.
  143. Bancos I, Hazeldine J, Chortis V, Hampson P, Taylor AE, Lord JM, et al. Primary adrenal insufficiency is associated with impaired natural killer cell function: a potential link to increased mortality. European journal of endocrinology. 2017;176(4):471.
  144. Isidori AM, Venneri MA, Graziadio C, Simeoli C, Fiore D, Hasenmajer V, et al. Effect of once-daily, modified-release hydrocortisone versus standard glucocorticoid therapy on metabolism and innate immunity in patients with adrenal insufficiency (DREAM): a single-blind, randomised controlled trial. The lancet Diabetes & endocrinology. 2018;6(3):173-85.
  145. Isidori AM, Arnaldi G, Boscaro M, Falorni A, Giordano C, Giordano R, et al. COVID-19 infection and glucocorticoids: update from the Italian Society of Endocrinology Expert Opinion on steroid replacement in adrenal insufficiency. Journal of endocrinological investigation. 2020;43(8):1141-7.
  146. Ives AM, Bertke AS. Stress Hormones Epinephrine and Corticosterone Selectively Modulate Herpes Simplex Virus 1 (HSV-1) and HSV-2 Productive Infections in Adult Sympathetic, but Not Sensory, Neurons. Journal of Virology. 2017;91(13):e00582-17.
  147. Noisakran S, Halford WP, Veress L, Carr DJJ. Role of the Hypothalamic Pituitary Adrenal Axis and IL-6 in Stress-Induced Reactivation of Latent Herpes Simplex Virus Type 1. The Journal of Immunology. 1998;160(11):5441-7.
  148. Uchakin PN, Parish DC, Dane FC, Uchakina ON, Scheetz AP, Agarwal NK, et al. Fatigue in Medical Residents Leads to Reactivation of Herpes Virus Latency. Interdisciplinary Perspectives on Infectious Diseases. 2011;2011:571340.
  149. Englund J, Feuchtinger T, Ljungman P. Viral infections in immunocompromised patients. Biol Blood Marrow Transplant. 2011;17(1 Suppl):S2-S5.
  150. Pivonello R, Ferrigno R, Isidori AM, Biller BMK, Grossman AB, Colao A. COVID-19 and Cushing's syndrome: recommendations for a special population with endogenous glucocorticoid excess. Lancet Diabetes Endocrinol. 2020;8(8):654-6.
  151. Pivonello R, Isidori AM, De Martino MC, Newell-Price J, Biller BM, Colao A. Complications of Cushing's syndrome: state of the art. The Lancet Diabetes & Endocrinology. 2016;4(7):611-29.
  152. Berczi I. Pituitary hormones and immune function. Acta Paediatrica. 1997;86(S423):70-5.
  153. Postel-Vinay M-C, de Mello Coelho V, Gagnerault M-C, Dardenne M. Growth hormone stimulates the proliferation of activated mouse T lymphocytes. Endocrinology. 1997;138(5):1816-20.
  154. Yu-Lee L-Y. Molecular actions of prolactin in the immune system. Proceedings of the Society for Experimental Biology and Medicine. 1997;215(1):35-52.
  155. Fabris N, Mocchegiani E, Provinciali M. Pituitary-Thyroid Axis and Immune System: A Reciprocal Neuroendocrine-lmmune Interaction. Hormone Research in Paediatrics. 1995;43(1-3):29-38.
  156. Grossman CJ. Interactions between the gonadal steroids and the immune system. Science. 1985;227(4684):257-61.
  157. Sharma MD, Sagar B, Wang S, Clinton White A, Jr., Balasubramanyam A. High Frequency of Serious Infections in Patients with Panhypopituitarism: A Case-Control Study. Clinical Infectious Diseases. 2001;32(1):153-8.
  158. Bialasiewicz AA, Jüppner H, Diehl V, Hesch R-D. Binding of bovine parathyroid hormone to surface receptors of cultured B-lymphocytes. Biochimica et Biophysica Acta (BBA)-General Subjects. 1979;584(3):467-78.
  159. Shurtz-Swirski R, Shkolnik T, Shasha SM. Parathyroid hormone and the cellular immune system. Nephron. 1995;70(1):21-4.
  160. El Kelany MA, Maklad SS, El Fouhil DF, El Etreby EA, Saleh LH, El Sheikh NA. Immunomodulatory effects of secondary hyperparathyroidism on circulating CD4+ and CD8+ T-lymphocytes in chronic renal failure patients. The Egyptian journal of immunology. 2009;16(2):71-82.
  161. Klein SL. Sex influences immune responses to viruses, and efficacy of prophylaxis and treatments for viral diseases. Bioessays. 2012;34(12):1050-9.
  162. Klein SL, Jedlicka A, Pekosz A. The Xs and Y of immune responses to viral vaccines. The Lancet infectious diseases. 2010;10(5):338-49.
  163. Hewagama A, Patel D, Yarlagadda S, Strickland FM, Richardson BC. Stronger inflammatory/cytotoxic T-cell response in women identified by microarray analysis. Genes & Immunity. 2009;10(5):509-16.
  164. Kovats S, Carreras E, Agrawal H, Klein S, Roberts C. Sex hormones and immunity to infection. 2010.
  165. Tuku B, Stanelle-Bertram S, Sellau J, Beck S, Bai T, Kouassi NM, et al. Testosterone Protects Against Severe Influenza by Reducing the Pro-Inflammatory Cytokine Response in the Murine Lung. Frontiers in Immunology. 2020;11(697).
  166. Steeg LGv, Vermillion MS, Hall OJ, Alam O, McFarland R, Chen H, et al. Age and testosterone mediate influenza pathogenesis in male mice. American Journal of Physiology-Lung Cellular and Molecular Physiology. 2016;311(6):L1234-L44.
  167. vom Steeg LG, Dhakal S, Woldetsadik YA, Park H-S, Mulka KR, Reilly EC, et al. Androgen receptor signaling in the lungs mitigates inflammation and improves the outcome of influenza in mice. PLOS Pathogens. 2020;16(7):e1008506.
  168. Robinson DP, Hall OJ, Nilles TL, Bream JH, Klein SL. 17β-estradiol protects females against influenza by recruiting neutrophils and increasing virus-specific CD8 T cell responses in the lungs. Journal of virology. 2014;88(9):4711-20.
  169. Straub RH. The complex role of estrogens in inflammation. Endocrine reviews. 2007;28(5):521-74.
  170. Costeira R, Lee KA, Murray B, Christiansen C, Castillo-Fernandez J, Ni Lochlainn M, et al. Estrogen and COVID-19 symptoms: associations in women from the COVID Symptom Study. medRxiv. 2020:2020.07.30.20164921.
  171. Geerlings SE, Hoepelman AI. Immune dysfunction in patients with diabetes mellitus (DM). FEMS immunology and medical microbiology. 1999;26(3-4):259-65.
  172. Muller LM, Gorter KJ, Hak E, Goudzwaard WL, Schellevis FG, Hoepelman AI, et al. Increased risk of common infections in patients with type 1 and type 2 diabetes mellitus. Clinical infectious diseases : an official publication of the Infectious Diseases Society of America. 2005;41(3):281-8.
  173. Diepersloot R, Bouter KP, Beyer W, Hoekstra J, Masurel N. Humoral immune response and delayed type hypersensitivity to influenza vaccine in patients with diabetes mellitus. Diabetologia. 1987;30(6):397-401.
  174. Singh AK, Gupta R, Ghosh A, Misra A. Diabetes in COVID-19: Prevalence, pathophysiology, prognosis and practical considerations. Diabetes & Metabolic Syndrome: Clinical Research & Reviews. 2020.
  175. Tong Q, Xiang W, Ye H, Zhang H, Chen Y, Chen W, et al. T3 level may be a helpful marker to predict disease prognosis of acute central nervous system viral infections. The International journal of neuroscience. 2019;129(2):139-45.
  176. Constantine G, Rajapakse S, Ranasinghe P, Parththipan B, Wijewickrama A, Jayawardana P. Hypocalcemia is associated with disease severity in patients with dengue. Journal of infection in developing countries. 2014;8:1205-9.
  177. Manjunath VG, Balla S, Kumar J. Serum ionic calcium levels and hypocalcemia in dengue fever in children and its correlation with its severity: case control study. 2019. 2019;6(3):5.
  178. Jin Y, Yang H, Ji W, Wu W, Chen S, Zhang W, et al. Virology, epidemiology, pathogenesis, and control of COVID-19. Viruses. 2020;12(4):372.
  179. Lazartigues E, Qadir MMF, Mauvais-Jarvis F. Endocrine Significance of SARS-CoV-2’s Reliance on ACE2. Endocrinology. 2020;161(9).
  180. Zinserling VA, Semenova NY, Markov AG, Rybalchenko OV, Wang J, Rodionov RN, et al. Inflammatory Cell Infiltration of Adrenals in COVID-19. Horm Metab Res. 2020;52(09):639-41.
  181. Pascual-Goñi E, Fortea J, Martínez-Domeño A, Rabella N, Tecame M, Gómez-Oliva C, et al. COVID-19-associated ophthalmoparesis and hypothalamic involvement. Neurology - Neuroimmunology Neuroinflammation. 2020;7(5):e823.
  182. Nampoothiri S, Sauve F, Ternier G, Fernandois D, Coelho C, Imbernon M, et al. The hypothalamus as a hub for SARS-CoV-2 brain infection and pathogenesis. bioRxiv. 2020:2020.06.08.139329.
  183. Chen M, Zhou W, Xu W. Thyroid function analysis in 50 patients with COVID-19: a retrospective study. Thyroid. 2020.
  184. Rajevac H, Bachan M, Khan Z. DIABETES INSIPIDUS AS A SYMPTOM OF COVID-19 INFECTION: CASE REPORT. Chest. 2020;158(4):A2576-A.
  185. Yousaf Z, Al-Shokri SD, Al-Soub H, Mohamed MFH. COVID-19-associated SIADH: a clue in the times of pandemic! Am J Physiol Endocrinol Metab. 2020;318(6):E882-E5.
  186. Uddin Chowdhury MR, Akter KS, Moula MM, Kabir MA, Bhuiyan SI, Das BC. COVID-19 presented with syndrome of inappropriate ADH secretion(SIADH): A case report from Bangladesh. Respiratory Medicine Case Reports. 2020;31:101290.
  187. Ravioli S, Niebuhr N, Ruchti C, Pluess E, Stoeckli T, Lindner G. The syndrome of inappropriate antidiuresis in COVID-19 pneumonia: report of two cases. Clinical Kidney Journal. 2020.
  188. Brancatella A, Ricci D, Cappellani D, Viola N, Sgrò D, Santini F, et al. Is Subacute Thyroiditis an Underestimated Manifestation of SARS-CoV-2 Infection? Insights From a Case Series. The Journal of Clinical Endocrinology & Metabolism. 2020;105(10):e3742-e6.
  189. Brancatella A, Ricci D, Viola N, Sgrò D, Santini F, Latrofa F. Subacute thyroiditis after SARS-CoV-2 infection. The Journal of Clinical Endocrinology & Metabolism. 2020;105(7):dgaa276.
  190. Mateu-Salat M, Urgell E, Chico A. SARS-COV-2 as a trigger for autoimmune disease: report of two cases of Graves’ disease after COVID-19. Journal of endocrinological investigation. 2020;43(10):1527-8.
  191. Muller I, Cannavaro D, Dazzi D, Covelli D, Mantovani G, Muscatello A, et al. SARS-CoV-2-related atypical thyroiditis. The Lancet Diabetes & Endocrinology. 2020;8(9):739-41.
  192. Ceriello A, De Nigris V, Prattichizzo F. Why is hyperglycaemia worsening COVID‐19 and its prognosis? Diabetes, Obesity and Metabolism. 2020;22(10):1951-2.
  193. Yang J-K, Lin S-S, Ji X-J, Guo L-M. Binding of SARS coronavirus to its receptor damages islets and causes acute diabetes. Acta diabetologica. 2010;47(3):193-9.
  194. Szatmary P, Arora A, Raraty MGT, Dunne DFJ, Baron RD, Halloran CM. Emerging phenotype of severe acute respiratory syndrome-coronavirus 2–associated pancreatitis. Gastroenterology. 2020;159(4):1551-4.
  195. Reddy PK, Kuchay MS, Mehta Y, Mishra SK. Diabetic ketoacidosis precipitated by COVID-19: A report of two cases and review of literature. Diabetes Metab Syndr. 2020;14(5):1459-62.
  196. Iuga AC, Marboe CC, M. Yilmaz M, Lefkowitch JH, Gauran C, Lagana SM. Adrenal Vascular Changes in COVID-19 Autopsies. Archives of Pathology & Laboratory Medicine. 2020;144(10):1159-60.
  197. Frankel M, Feldman I, Levine M, Frank Y, Bogot NR, Benjaminov O, et al. Bilateral Adrenal Hemorrhage in Coronavirus Disease 2019 Patient: A Case Report. The Journal of Clinical Endocrinology & Metabolism. 2020;105(12):3745-9.
  198. Gagliardi L, Bertacca C, Centenari C, Merusi I, Parolo E, Ragazzo V, et al. Orchiepididymitis in a boy with COVID-19. The Pediatric infectious disease journal. 2020;39(8):e200-e2.
  199. Illiano E, Trama F, Costantini E. Could COVID‐19 have an impact on male fertility? Andrologia. 2020:e13654.
  200. Ma L, Xie W, Li D, Shi L, Mao Y, Xiong Y, et al. Effect of SARS-CoV-2 infection upon male gonadal function: A single center-based study. medRxiv. 2020:2020.03.21.20037267.
  201. Li H, Xiao X, Zhang J, Zafar MI, Wu C, Long Y, et al. Impaired spermatogenesis in COVID-19 patients. EClinicalMedicine. 2020;28.
  202. Serban AL, Ferrante E, Carosi G, Indirli R, Arosio M, Mantovani G. COVID-19 in Cushing disease: experience of a single tertiary centre in Lombardy. Journal of endocrinological investigation. 2020.
  203. Arlt W, Baldeweg SE, Pearce SH, Simpson HL. Clinical management guidance during the covid-19 pandemic adrenal insufficiency. European journal of endocrinology. 2020:1-21.


Protozoa and Endocrine Dysfunction

ABSTRACT


Protozoa are parasitic organisms that are among the most important pathogens worldwide. They are classified into four groups and in infected persons, the disease process may be asymptomatic. Of the four groups, Flagellates and Sporozoa are implicated in the causation of endocrine dysfunction and metabolic abnormalities. The disease condition caused by the flagellates include Giardiasis, Leishmaniasis, and Trypanosomiasis and all cause endocrine abnormalities that range from growth retardation, hypogonadism, adrenal insufficiency, thyroid dysfunction which is largely a resultant effect of the sick euthyroid syndrome, and the syndrome of inappropriate ADH secretion. The Sporozoan disease that notably give rise to metabolic abnormalities is malaria especially severe malaria which is commonly caused by P Falciparum infection. Hypoglycemia is one of the defining criteria for severe malaria and in Africa where malaria is endemic the reported prevalence rate of hypoglycemia in children is as high as 60%. Other abnormalities which are infrequently reported requiring treatment albeit temporarily are hyperglycemia, hypocalcemia, and diabetes insipidus. Adrenal insufficiency when is present is a poor prognostic factor in severe malaria. Toxoplasmosis is acquired or vertically transmitted and may present with neuroendocrine manifestations and adrenal insufficiency resulting from infiltration of the affected endocrine organs with the parasites.


PROTOZOA


A parasite is an organism that lives on or in a host organism and gets its food from or at the expense of its host. The three main classes of parasites that can cause disease in humans include helminths, protozoa, and ectoparasites.


Protozoa are microscopic, one-celled organisms that can be free-living or parasitic in nature. Their ability to multiply in humans contributes to their survival and also permits serious infections to develop from just a single organism. Transmission of protozoa that live in a human’s intestine to another human typically occurs through a fecal-oral route and for those that live in the blood or tissue of human’s transmission to other humans is via an arthropod vector (1). Protozoa that are infectious to humans are classified into four groups based on their mode of movement;


Mastigophora – the flagellates, e.g., GiardiaLeishmania, Trypanosoma

Sporozoa – organisms whose adult stage is not motile e.g., PlasmodiumCryptosporidium, Toxoplasma gondii,

Ciliophora – the ciliates, e.g., Balantidium

Sarcodina – the ameba, e.g., Entamoeba


MASTIGOPHORA  


Mastigophora is a phylum of protozoans of the Kingdom Protista, consisting mainly of free-living flagellated unicellular organisms that reproduce by binary fission and whose habitat includes fresh and marine waters. Leishmania and Trypanosoma live in the blood, lymph, and tissue spaces and are typically transmitted from one host to another by blood feeding arthropods.


Giardiasis 


This is a diarrheal illness that is caused by Giardia (also known as Giardia intestinalis, Giardia lamblia, or Giardia duodenalis). It is a microscopic parasite and is the most common cause of protozoa associated diarrhea worldwide. The prevalence rate of Giardiasis is higher in developing countries than in the developed countries of the world with Giardia species being endemic in areas of the world that have poor sanitation and high-risk groups including immunocompromised individuals (2-3).


MODE OF TRANSMISSION


The parasite is found on surfaces or in soil, food, or water that has been contaminated with feces from infected humans or animals. Infection is transmitted commonly through ingestion of infectious G lamblia cysts. In the intestine, excystation occurs and trophozoites are released into the feces. A summary of the transmission of the parasite is shown in Figure 1.

Giardia infrequently is transmitted sexually specifically through oral-anal practices. The incubation period is 3-35 days but 7-10 days on the average.

Figure 1. Life Cycle of Giardia. Source- Centers for Disease Control and Prevention

CLINICAL PRESENTATION


The clinical manifestations include acute or chronic diarrheal disease, but the infection may be asymptomatic even in children. In a Nigeria Study (3) that evaluated stool samples of children aged between 0-5 years, about half-(41%) were positive for G. lamblia. The extraintestinal manifestations of Giardiasis include allergic presentations resulting from immune system activation, and long-term consequences such as ocular pathologies, arthritis, allergies, growth failure, muscular, and metabolic complications (4-5).


ENDOCRINE AND METABOLIC ABNORMALITIES


The complications relating to endocrine and metabolic dysfunction include growth failure and hypothyroidism. The Nigerian Report described above showed a positive association between asymptomatic giardiasis and malnutrition. The relation between Giardiasis and growth failure is explained mainly by malabsorption leading to protein energy malnutrition and micronutrient deficiencies. Other than nutritional status, other contributory factors to growth stunting in children include sanitary and socio-economic conditions, loss of intestinal surface area, and maldigestion (4-5).


Giardia infection has no direct effect or impact on thyroid function but has been reported to indirectly affect thyroid status. Worsening of hypothyroidism related to malabsorption of levothyroxine tablets occasioned by the presence of Giardia infection has been documented in the literature (6-7).


DIAGNOSIS AND MANAGEMENT


The diagnosis is made by demonstration of cysts or trophozoites in stool samples. Other means of diagnosis include small bowel biopsy and stool ELISA. The mainstay of treatment is metronidazole. Patients with stunted growth often experience catch- up growth following treatment of giardiasis.


Leishmaniasis  


Leishmaniasis is a poverty related protozoal disease caused by the Leishmania donovani complex. There are 3 main forms of leishmaniases – visceral (also known as kala-azar, the most serious form of the disease), cutaneous (the most common), and mucocutaneous. The clinical spectrum of leishmaniasis ranges from a self-resolving cutaneous ulcer to a mutilating mucocutaneous disease and even to a lethal systemic illness. In Nigeria cutaneous leishmaniasis is the commonly occurring type and has been noted to occur in Northern Nigeria especially in areas bordering the Niger Republic.


Types of Leishmaniasis


MODE OF TRANSMISSION


Leishmania spp. is a parasite with a dimorphic life cycle that is controlled by the passage from vector to host .All three forms of Leishmaniasis are transmitted by the bite of infected female sand fly. The vector phase of the life cycle begins when the vector ingests blood containing the parasites with the parasites undergoing differentiation and ultimately becoming promastigotes and pass into the proboscis where where they can inoculate the host during feeding of the vector (8). These human and vector stages of Leishmania are shown in Figure 2. Infiltration of the reticuloendothelial system by amastigotes leads to the biochemical and clinical features of the disease.


Vertical transmission of visceral leishmaniasis may occur during pregnancy while cutaneous leishmaniasis may be transmitted through physical contact. Transmission via contaminated needles, blood transfusion, sexual intercourse and vertical transmission are modes of transmission that are documented albeit infrequently (8).

Figure 2. Life cycle of Leishmania. Source -CDC

CLINICAL PRESENTATION


Visceral Leishmaniasis (VL) may present with fever, malnutrition, weight loss , hepatosplenomegaly and death if treatment is delayed or sub-optimal. Cutaneous Leishmaniasis presents with skin ulceration and nodules and the Mucocutaneous form of Leishmaniasis with skin and mucous involvement.


ENDOCRINE AND METABOLIC ABNORMALITIES


Evidence of involvement of several endocrine organs- pituitary, adrenal, thyroid, and sex glands- via histopathologic studies have been documented in VL (9). However abnormal endocrine function tests in some instances without clinical manifestations have been documented.


Reports from Africa and Europe show that thyroid function may be affected in VL but the abnormalities detected are most likely a result of euthyroid sick syndrome (ESS) or non-thyroidal illness (NTI) with no clinical presentation of thyroid disease (10-12). VL has been reported to present with primary adrenal insufficiency in with clinically overt features and in some cases biochemical evidence without clinical features may occur. Primary adrenal insufficiency (AI) was reported in VL in a patient without HIV infection and a patient with concomitant HIV infection and was attributable to parasitic infiltration of the organ (13-14). A Brazilian Series reported a prevalence rate of AI to be about 50% in persons with VL (12). In the Brazilian Report (12) that compared hormonal parameters between persons with chronic leishmaniasis and control subjects, the following were noted in some of the subjects with leishmaniasis; a) features of pituitary dysfunction characterized by low TSH, low T4, and low T3 levels (ESS/NTI), b) elevated ACTH with normal cortisol levels, c) high FSH, LH, and low testosterone levels. Other endocrine abnormalities include low parathyroid hormone (PTH) and decreased total and ionized calcium levels.


An unusual presentation of VL is adrenal cysts which has been reported to come to clinical attention because of the mass effect (15-16). The Syndrome of inappropriate ADH secretion (SIADH) is often reported in VL with hyponatremia documented as a significant contributory factor to mortality of the disease (17). The endocrine and metabolic abnormalities of Leishmaniasis and potential mechanisms underlying their occurrence are shown in Table 1. 


Table 1. Endocrine and Metabolic Dysfunction in Visceral Leishmaniasis

Endocrine Gland

 Hormonal Status

The Level of Abnormality

Underlying Mechanism

Presentations

Thyroid Gland

Low TSH, Low T3, Low T4


High TSH, Low T4, Low T3

Hypothalamic/Pituitary Axis


ESS/NTI

Malnutrition in VL may lead to suppressed TSH and subsequent low TH production.

Parasitism of the pituitary gland.


No clinical features of thyroid disease


Low T4, High TSH

Primary hypothyroidism /Thyroid gland


Primary thyroid insufficiency due to the infiltration of the thyroid gland causing thyroiditis


Adrenal Gland

Low Cortisol, High ACTH

Primary adrenal insufficiency

Parasitic Infiltration of the adrenal cortex

 Mucosal pigmentation, chronic diarrhea, weight loss


High ACTH, Normal Cortisol

Primary adrenal insufficiency

Parasitic Infiltration of the adrenal cortex

These patients have normal cortisol levels but were unable to mount an adequate response to stress


High ACTH, high cortisol

Hypothalamus, Pituitary

Stress Response


Parathyroid gland

Low PTH, Hypocalcemia

Renal (interstitial nephritis) and GIT

Hypomagnesaemia resulting from increased renal loss.

GIT loss from possible malabsorption and frequent diarrhea.


Posterior pituitary gland

Syndrome of inappropriate ADH secretion (SIADH)

Hypothalamo-Pituitary Axis

Volume depletion from vomiting leading to increased serum osmolality and resultant Vasopressin release from the PPG.

Intense inflammatory response from multiple organ involvement leads to activation of HPA axis and Vasopressin release.


Hyponatremia, elevated urinary osmolality and reduced serum osmolality

Gonads

High FSH, High LH and low testosterone

Primary hypogonadism

Parasitism of the testes, reduced testicular size with fewer Sertoli and Leydig cells. Malnutrition may be contributory to the low testosterone level

Delayed Puberty

Erectile dysfunction


DIAGNOSIS AND TREATMENT


A combination of clinical symptoms and laboratory parameters clinches the diagnosis. The laboratory tests involve the detection of the parasites in samples taken from the base of the ulcer and dermal scrapings- Wright ‘s stain detects round or ovoid parasite in the cytoplasm of macrophages.


Polymerase chain reaction for detection of the parasite in peripheral blood and bone marrow samples IS diagnostic. Other tests to support the diagnosis is the Leishman test, which essentially refers to observation of a delayed tuberculin type of reaction following an Intradermal injection of leishmanial antigen.


The mainstay of treatment is the pentavalent antimony compounds. Other pharmacotherapies include amphotericin B, oral miltefosine, pentamidine, and antibiotics. Treatment is individualized, thus persons with associated endocrine/metabolic dysfunction are treated on a case-by-case basis.


Trypanosomiasis  


This is an anthropozoonosis caused by a protozoan hemoflagellate. Trypanosoma cruzi in American trypanosomiasis, also known as Chagas disease, is transmitted to human host by a tick. Human African trypanosomiasis (HAT) also known as sleeping sickness is caused by Trypanosoma brucei gambiense in West and Central Africa andTrypanosoma brucei rhodosiense in East Africa is transmitted to human hosts by bites of infected tsetse flies.

Figure 3. The pathogen in human African trypanosomiasis

MODE OF TRANSMISSION


In HAT the tsesefly (glossina specie) injects metacyclic trypomastogotes into the skin and these pass into the blood stream and are subsequently carried to other parts of the body and body fluids. The tsetsefly becomes infected when it bites an infected person. Trypanosoma brucei gambiense may also be acquired congenitally from an infected mother.


Chagas disease is transmitted by a group of blood-feeding insects known as kissing bugs or triatomid bugs. The pathogen normally circulates between bugs and wild animals in sylvatic habitats; infected bugs in domestic habitats can transmit Chagas to humans and domestic animals (dogs, guinea pigs). Details of the life cycle and transmission of the pathogen is shown in Figure 4.

Figure 4. Transmission of Chagas Disease

CLINICAL PRESENTATION


Trypanosomiasis may cause acute illness but on the other hand the infection may be asymptomatic. Chagas disease (CD) presents in three phases: acute, indeterminate, and chronic. The acute phase occurs immediately following infection and is usually asymptomatic in most people but when symptomatic, presentation is essentially those of malaise and skin lesions. The indeterminate phase is usually asymptomatic but may progress to a chronic phase where organ systems mainly the heart and sometimes the gastrointestinal tract are affected.


HAT is characterized by an early hyper-hemolytic phase in which the trypanosomes are restricted to the blood and the lymphatic system and also characterized by organomegaly and lymphadenopathy. This is followed by a late phase or the meningo-encephalitic stage characterized by neuro-psychiatric and endocrinal disorders.


ENDOCRINE AND METABOLIC ABNORMALITIES   


These occur infrequently and includes systemic neuroendocrine manifestations in the sympathetic and parasympathetic ganglia. In HAT, documented endocrine abnormalities include adrenal insufficiency, hypothyroidism, and hypogonadism in the absence of autoantibodies (18). Some authors have reported thyroid dysfunction specifically hypothyroidism in untreated HAT (19).


Adrenal insufficiency in trypanosomiasis may be primary or secondary and this is seen especially in untreated cases (20). The adrenal may serve as a reservoir for the T. cruzi infection and some investigators have noted a correlation between Chagasic myocarditis and infection within the central vein of the adrenal gland (21).


Secondary hypogonadism in both sexes had also been demonstrated in some reports which clearly showed that in the majority of the cases, the pathology was not at the level of the pituitary gland but rather an extra pituitary origin (22). Clearly, primary hypogonadism was not demonstrated to be a contributory factor to cases of hypogonadism in persons with trypanosomiasis.


Metabolic abnormalities are infrequently reported however a case of spurious hypoglycemia (23) has been documented in which hypoglycemia was attributable to invitro utilization of glucose by the parasite. The metabolic and endocrine abnormalities are shown in Table 2.


Table 2. Endocrine and Metabolic Dysfunction in Trypanosomiasis

Endocrine Gland

 Hormone /Hormonal status

The level of abnormality

Possible reason

Clinical Presentation

Thyroid Gland

Low TSH, Low T3 Low T4


High TSH, Low T4, Low T3

Secondary hypothyroidism


Primary hypothyroidism 

Elevated plasma cytokines related to untreated HAT

Parasitic thyroiditis


HPA Axis

Subnormal Cortisol response to ACTH


Subnormal cortisol response to ACTH


Subnormal ACTH and cortisol response to (CRT) test


Primary Adrenal Insufficiency


Secondary adrenal insufficiency

Parasitic invasion of the adrenal gland.

Iatrogenic: Suramin in doses exceeding the quantity employed in the treatment of trypanosomiasis inhibits adrenocortical hormone synthesis.

Adaptation of the HPA state to the cytokines released due to inflammatory status of the underlying disease


Glucose metabolism

Low glucose levels

Spurious Hypoglycemia


Clinical hypoglycemia

Invitro utilization of glucose by trypanosome


Iatrogenic: Pentamidine


HPG Axis

In Men: Low Testosterone, Low LH and FSH


Positive response of testosterone to GnRH/LHRH stimulation


In women: Low Estradiol, low basal LH and FSH levels and positive response to GnRH/ LHRH

Secondary hypogonadism


Tertiary hypogonadism


Tertiary hypogonadism

Most likely due to inflammatory status of the underlying disease


Mechanism not known but may be due to cytokine release


Mechanism not known but may be due to cytokine release

Loss of libido, Impotence


Impotence


Amenorrhea


DIAGNOSIS  


Diagnosis of HAT involves a three-tiered approach for infections due to T.b. Gambiense and a two-tiered approach for that due to T.b. rhodosiense. The three steps for gambiense HAT include a screening test, diagnostic confirmation, and stage determination while that for rhodesiense HAT are diagnostic confirmation and stage determination. Screening is for gambiense HAT involves serology - CATT (Card Agglutination Test for Trypanosomiasis), which detects the presence of specific antibodies in the patient’s blood or serum. Diagnostic confirmation is done to detect the presence of trypanosomes in lymph node aspirates, chancre smear, or in blood. Stage determination is via the detection of trypanosomes (after centrifugation) and white cell count in the cerebrospinal fluid (lumbar puncture):Hemolymphatic stage is characterized by the absence of trypanosomes AND ≤ 5 white cells/mm3 and the Meningoencephalitic stage is defined by evidence of trypanosomes OR > 5 white cells/mm3.


Diagnosis of Chagas disease is via identification of Trypanosoma cruzi by direct microscopy of fresh blood or blood concentrated by the microhematocrit method. Serological tests for anti-Trypanosoma cruzi antibodies are performed for cases of suspected disease but no definitive diagnosis by microscopy.


PHARMACOTHERAPY FOR TRYPANOSMIASIS


Acute or chronic Chagas disease can be treated with either benznidazole or nifurtimox for those without cardiac or GIT complications. Drugs employed in the management of HAT include Nifurtimox, Eflornithine, Melarsoprol, Pentamidine, and Prednisolone (24).


SPOROZOANS


Sporozoans are a group of non-flagellated, non-ciliated and non-amoeboid protists that are responsible for diseases such as malaria and toxoplasmosis.


Malaria


Malaria is an infection caused by single-celled parasites that enter the blood through the bite of an Anopheles mosquito. These parasites, called plasmodia, belong to at least five species; P falciparum, P vivax, P ovale, P malariae and P knowlesi. Plasmodium parasites spend several parts of their life cycle inside humans and another part inside mosquitoes. During the human part of their life cycle, Plasmodium parasites infect and multiply inside liver cells and red blood cells.


Malaria infection begins when an infected female Anopheles mosquito bites a person, injecting Plasmodium parasites, in the form of sporozoites, into the bloodstream and then to the liver. In the liver, asexual multiplication of the sporozoites take place and these are released from the liver as merozoites which invade the red blood cells and multiply within the red cells until the cells burst and the released merozoites invade more red cells with the cycle repeating itself and causing fever. Some of the merozoites leave the cycle of asexual multiplication and instead of replicating within the cells develop into sexual forms of the parasites known as gametocytes. Following the bite of an infected person, gametocytes are ingested by the mosquito and develop into gametes which ultimately become sporozoites which travel to the mosquito’s salivary glands (25).

CLINICAL PRESENTATION


Uncomplicated malaria presents with fever, headache, and generalized malaise. Severe malaria refers to the demonstration of asexual forms of the malaria parasites (commonly P falciparum) in a patient with a potentially fatal manifestations or complications of malaria. Severe malaria is characterized by altered mentation, severe hemolysis, some metabolic abnormalities, and organ complications.


ENDOCRINE AND METABOLIC ABNORMALITIES


Hypoglycemia is commonly documented in severe malaria and hyperglycemia although infrequently reported is seen in severe malaria as well as uncomplicated malaria. Hypocalcemia is also reported in severe malaria as well as in cases of uncomplicated malaria.


Hypoglycemia may be iatrogenic due to quinine administration or due to increased glucose turnover secondary to increased glucose uptake resulting from anaerobic glycolysis and alterations in glucose production in severe malaria (26). Nigeria Reports have hypoglycemia (blood glucose <2.2mmol/L) documented in 60% of children diagnosed with severe malaria (27). Hyperglycemia on the other hand infrequently occurs in persons with malaria and it may present in uncomplicated malaria or severe malaria due to P falciparum infection. The causes of hyperglycemia sometimes necessitate the temporary use of insulin and is multifactorial. These include release of counter-regulatory hormones in response to the stress of the underlying malaria disease condition and pro inflammatory cytokines which increase blood glucose (28). Other proposed reasons for hyperglycemia are reduced sensitivity to insulin and increased gastric and small intestine permeability for sucrose in malaria patients (29-30).


Hypocalcemia is reported in severe malaria as well as in cases of uncomplicated malaria. It has been shown that there is an inverse relationship between parasite load and calcium levels with calcium levels returning to normal following treatment and parasite clearance (31). Altered magnesium metabolism and disturbed parathyroid gland function have been documented as possible reasons for hypocalcemia in malaria (32).


The pituitary-thyroid axis may be depressed in severe malaria and this is most likely attributable to adaptations of the pituitary-thyroid axis to the underlying illness. A Report has noted suppressed T4 and TSH levels with a poorly responsive pituitary gland to TRH stimulation as evidenced by low TSH levels following stimulation (33-34).  Another possible mechanism underlying the secondary hypothyroidism is parasitic sequestration within the hypothalamo-pituitary portal system (35).


Clinical and biochemical parameters of central diabetes insipidus which in some cases warranted treatment has been reported in severe malaria. The suggested mechanism is obstruction of the neurohypophyseal microvasculature (36-37).


Primary and secondary adrenal insufficiency which may present with subnormal cortisol levels and in some cases overt features of hypocortisolemia may be seen in severe malaria. Primary adrenal insufficiency may be due to necrosis or impaired circulation due to sequestration of parasites. Some reports have results suggestive of cytokines playing a role in modulating the hypothalamic-pituitary-adrenal axis in secondary adrenal insufficiency. Other potential mechanisms for secondary adrenal insufficiency are erythrocyte sequestration within the hypothalamic -pituitary portal system, altered setpoint for cortisol inhibition of ACTH, and production of a peptide like mammalian somatostatin which has been found to inhibit ACTH secretion in vitro (38-39).


DIAGNOSIS AND TREATMENT


Direct microscopy employed on thin and thick blood films enable parasite detection, species identification, quantification, and monitoring of parasitemia. Serology via the rapid diagnostic tests which detects the parasite antigen can be employed.

Figure 5: Giemsa-stained peripheral blood smear. Arrow A showing a classic, ring-shaped trophozoite of Plasmodium falciparum. Arrow B showing a classic, headphone-shaped trophozoite of P. falciparum. Arrow C showing two trophozoites of P. falciparum within the same red blood cell. (Reproduced from BMJ Case Reports (Surce-Parikh et al. Classic image: peripheral blood smear in a case of Plasmodium falciparum cerebral malaria http://dx.doi.org/10.1136/bcr-2014-205820

Severe malaria regardless of the infecting specie is treated with intravenous Artesunate and interim oral treatment, artemether -lumefantrine. Other oral antimalarial drugs are Atovaquone-proguanil, Quinine. and Mefloquine.


Toxoplasmosis


Toxoplasmosis is an infection with Toxoplasma gondii, an obligate intracellular protozoon, which is ingested in the form oocysts in material contaminated by feces from infected cats. Oocysts may also be transported to food by flies and cockroaches.


TRANSMISSION  


It is primarily an intestinal parasite in cats and has a wide host of intermediate hosts including sheep and mice and exists in three forms: oocysts, tachyzoites, and bradyzoites. Oocysts are only produced in the definitive host – the cat. When passed in the feces and then ingested, the oocysts can infect humans and other intermediate hosts where they develop into tachyzoites- rapidly multiplying trophozoite form of T. gondii. They divide rapidly in cells, causing tissue destruction and spreading the infection. The transmission of toxoplasmosis is shown in Figure 5. Tachyzoites in pregnant women are capable of infecting the fetus. Eventually tachyzoites localize to muscle tissues and the CNS where they convert to tissue cysts, or bradyzoites which is the dormant stage. This is thought to be a response to the host immune reaction. Ingestion of cysts in contaminated meat is also a source of

infection, as bradyzoites transform back into tachyzoites upon entering a new host.

Figure 5. Mode of transmission of toxoplasmosis

CLINICAL PRESENTATION


Toxoplasmosis is often asymptomatic or associated with mild self-limiting symptoms except in immunocompromised persons and sometimes in cases that are congenitally transmitted via the transplacental route (congenital toxoplasmosis).


CNS toxoplasmosis is one of the most common and important opportunistic infections in patients who are immunocompromised -the clinical manifestations are often nonspecific, with the most common presenting symptoms being headache, lethargy, fever, and focal neurologic signs. In congenital toxoplasmosis (CT), chorioretinitis is the most common manifestation and may cause seizure, hydrocephalus, and psychomotor delay.


ENDOCRINE AND METABOLIC ABNORMALITIES


Endocrine defects in toxoplasmosis are usually neuroendocrine in nature and may occur in congenital toxoplasmosis as well as acquired toxoplasmosis. Endocrine manifestations of   Toxoplasmosis include hypogonadotropic hypogonadism, precocious puberty, short stature, and diabetes insipidus. Documented hormonal abnormalities in persons with congenital toxoplasmosis result from hypothalamo-pituitary dysfunction and include growth hormone, gonadotropin, and ADH deficiency (40-41) (Figure 6).

Figure 6. Computerized tomography of brain showing dilated ventricles with multiple subependymal and parenchymal calcifications (arrow). (Source: Mohammed S et al; Congenital toxoplasmosis presenting as central diabetes insipidus in an infant: a case report BMC Res Notes. 2014; 7: 184.

Hypogonadotropic hypogonadism may occur transiently as a result of the modulation of the hypothalamus-pituitary axis by cytokines. Trypanosomiasis which is seen as a ring enhancing lesions in the brain during MRI imaging is an organic cause of the neuroendocrine abnormalities noted in some series (42-44).


Toxoplasmosis has been suggested as a possible risk factor for type 2 diabetes mellitus. Some Researchers have suggested that Toxoplasma gondii directly effects pancreatic cells through beta cell destruction (45-46).


DIAGNOSIS AND TREATMENT  


Diagnosis is made via direct detection of the parasites in body fluid and tissue samples.

Serology and molecular techniques are also employed in the diagnosis. Imaging preferable MRI is of use in suspected CNS involvement. Pyrimethamine, Sulfadiazine and Trimethorprin, and sulfamethoxazole are pharmacotherapies for managing toxoplasmosis.


BALANTIDIASIS


Balantidiasis is a disease caused by Balantidium coli, a ciliated protozoan and the only ciliate known to be capable of infecting humans. It is transmitted via contaminated water or food through cysts often associated with swine, the primary reservoir host. Endocrine and metabolic dysfunction or abnormalities are not documented in Balantidiasis.


SARCODINA


Amoebiasis is a diarrhea illness caused by infection with Entamoeba histolytica and is acquired by fecal-oral transmission. In some instances, extraintestinal diseases may occur but endocrine and metabolic dysfunction are not known to occur.


CONCLUSION


Protozoal infections are rare but significant causes of metabolic and endocrine abnormalities. The possibility of protozoal infections as possible causes of these abnormalities should be sought out in regions where these infections are prevalent especially after exclusion of other commonly occurring causes.


REFERENCES


  1. Mousa HA. The Hidden Scene behind the High prevalence of Giardiasis and other infectious diseases in developing countries. J Infect Dis Ther 2014; 2:e106. doi:10.4172/2332-0877.
  2. Werner Espelage , Matthias an der Heiden, Klaus Stark, Katharina Alpers. Characteristics and risk factors for symptomatic Giardia lamblia infections in Germany. BMC Public Health. 2010;10:41. doi: 10.1186/1471-2458-10-41.
  3. Inabo HI, Yau B, Yakubu SE Asymptomatic Giardiasis and Nutritional Status of Children in Two Local Government Areas in Kaduna State, Nigeria. Sierra Leone Journal of Medical Research; 2011;3:157-162.

4       Jeffrey R. Donowitz, Masud Alam, Mamun Kabir, Jennie Z. Ma, Forida Nazib, James A. Platts-Mills, Luther A. Bartelt, Rashidul Haque, William A. Petri, Jr, A Prospective Longitudinal Cohort to Investigate the Effects of Early Life Giardiasis on Growth and All Cause Diarrhea, Clinical Infectious Diseases, 2016;63(6) 792–797.

  1. Simsek Z, Zeyrek FY, Kurcer MA Effect of Giardia infection on growth and psychomotor development of children aged 0-5 years. Journal of Tropical Pediatrics 2004;50(2):90-3.
  2. Radaeli Rde F, Diehl LA. Increased levothyroxine requirement in a woman with previously well-controlled hypothyroidism and intestinal giardiasis. Arq Bras Endocrinol Metabol 2011;55:81-4.
  3. Seppel T, Rose F, Schlaghecke R. Chronic intestinal giardiasis with isolated levothyroxine malabsorption as reason for severe hypothyroidism - implications for localization of thyroid hormone absorption in the gut. Exp Clin Endocrinol Diabetes. 1996;104:180-2.
  4. Miroslava Avila-García, Javier Mancilla, Enrique Segura-Cervantes and Norma Galindo-Sevilla (March 19th 2014). Transmission to Humans, Leishmaniasis - Trends in Epidemiology, Diagnosis and Treatment, David M. Claborn, IntechOpen, DOI: 10.5772/57271.https://www.intechopen.com/books/leishmaniasis-trends-in-epidemiology-diagnosis-and-treatment/transmission-to-humans
  5. Meleney HE. The histopathology of kala-azar in the hamster, monkey and man. Am J Pathol. 1925;1:147–168.
  6. Nahid R. Yousif, Rimaz E. Gurashi, Mohamed A. El Tahir, Safa Wadidi. Abd El Karim A. Abdrabo. Evaluation of Thyroid Function among Visceral Leishmaniasis Sudanese Patients. African Journal of Medical Sciences, 2018; 3 (8) .
  7. Al-Ezzy AI, Abood WN. Correlation of Rk39-Specific Antibodies and Thyroid Function in Patients with Visceral Leishmaniasis. Eurasian J Med. 2016;48(3):181-185.
  8. Frederico Araujo Lima Verde, Francisco Agenor Araujo Lima Verde, Augusto Saboia Neto, Paulo César Almeida, Emir Mendonça Lima Verde. Hormonal Disturbances in Visceral Leishmaniasis (Kala-Azar) Am J Trop Med Hyg. 2011; 84(5): 668–673.
  9. Mondain-Miton V, Toussaint-Gari M, Hofman P, Marty P, Carles M, De Salvador F, et al. Atypical leishmaniasis in a patient infected with human immunodeficiency virus, Clin Infect Dis 1995;21:663-665.
  10. Kaneria MV, Jagtap S, Modi C, Kamath S. Atypical presentation of Visceral Leishmaniasis. JAPI 2005;53
  11. Brandonisio O, Fumarola L, Spinelli R, Gradoni L. Unusual presentation of leishmaniasis as an adrenal cystic mass. Eur J Clin Microbiol Infect Dis. 2002 ;21(9):682-3.
  12. Brenner DS, Jacobs SC, Drachenberg CB, Papadimitriou JC. Isolated visceral leishmaniasis presenting as an adrenal cystic mass. Arch Pathol Lab Med. 2000 ;124(10):1553-6.
  13. Daher EF, Soares DS, Filho SL, et al. Hyponatremia and risk factors for death in human visceral leishmaniasis: new insights from a cross-sectional study in Brazil. BMC Infect Dis. 2017;17(1):168.
  14. Reincke M, Arlt W, Heppner C, Petzke F, Chrousos GP, Allolio B. Neuroendocrine dysfunction in African trypanosomiasis. The role of cytokines. Ann N Y Acad Sci. 1998 ;840:809-21.
  15. Reincke M, Allolio B, Petzke F, Heppner C, Mbulamber D, Vollmer D et al. Thyroid dysfunction in African trypanosomiasis: a possible role for inflammatory cytokines. Clin Endocrinol (Oxf) 1993;39(4): 455-461
  16. Reincke M, Allolio B, Petzke F, Heppner C, Mbulamber D, Vollmer D et al. Impairment of Adrenocortical Function Associated with Increased Plasma Tumor Necrosis Factor-Alpha and Interleukin-6 Concentrations in African Trypanosomiasis. Neuroimmunomodulation 1994;1:14–22.
  17. Paolo WF, Nosanchuk JD. Adrenal Infections International journal of infectious diseases. 2006; 10(5): 343-353)
  18. Boersma A, Noireau F, Hublart M. Gonadotropic axis and Trypanosoma brucei gambiense infection, Annales de la Société belge de médecine tropicale 1989;69(2):127-35.
  19. Nieman, Roger E., et al. “Severe African Trypanosomiasis with Spurious Hypoglycemia.” The Journal of Infectious Diseases, 1989; 159:360-362.
  20. Pan American Health Organization. Guidelines for diagnosis and treatment of Chagas disease. Washington, D.C. 2019.
  21. Baer K, Klotz C, Kappe SH, et al. Release of hepatic Plasmodium yoelii merozoites into the pulmonary microvasculature. PLoS Pathogens. 2007;(11):e171.
  22. Planche T, Dzeing A, Ngou-Milama E, Kombila M, Stacpoole PW. Metabolic complications of malaria. Curr Top Microbiol Immunol 2005;295:105-36.
  23. Osonuga OA, Osonuga Ifabunmi, Derkyi-Kwarteng L. Prevalence of hypoglycemia among severe malaria children in rural Africa population, Asian Pacific Journal of Tropical Disease 2011; 1(3):192–194.
  24. Kiely A, McClenaghan NH, Flatt PR, Newsholme P. Pro-inflammatory cytokines increase glucose, alanine and triacylglycerol utilization but inhibit insulin secretion in a clonal pancreatic beta-cell line. J Endocrinol. 2007 ;195(1):113-23.
  25. Singh Y, Joshi SC, Satyawali V, Gupta A. A case of severe falciparum malaria presenting with hyperglycemia. J Med Trop 2014;16:39-41
  26. Singh Yatendra, Joshi Subhash C., Satyawali Vivekanand, Gupta Abhisek .A case of severe falciparum malaria presenting with hyperglycemia. Journal of Medicine in the Tropics 2014:16:39-41.
  27. Prabha MR, Pereira P, Chowta N, Hegde BM. Clinical implications of hypocalcemia in malaria. Indian J Med Res. 1998;108:62-5..
  28. Singh PS, Singh N. Tetany with Plasmodium falciparum infection. J Assoc Physicians India. 2012;60:57-8. .
  29. Feinsod FM, Heinrich G Malaria infection presenting with symptoms of thyroid insufficiency and amenorrhoea. Trans R Soc Trop Med Hyg 1981;75(1):117-8.
  30. Davis,TM, Supanaranond W, Pukrittayakamee S,Krishna S,  Hart GR,  Burrin JR, et al. The pituitary-thyroid axis in severe falciparum malaria: evidence for depressed thyrotroph and thyroid gland function.  Trans R Soc Trop Med Hyg 1990;84(3):330-5.
  31. Selvaraj V. Hypopituitarism: A rare sequel of cerebral malaria – Presenting as delayed awakening from general anesthesia. Anesth Essays Res. 2015; 9(2): 287–289.
  32. Premji R, Roopnarinesingh N, Cohen J, Sen S. Cerebral Malaria: An Unusual Cause of Central Diabetes Insipidus 2016 |Article ID 2047410 | https://doi.org/10.1155/2016/2047410.
  33. Grimwade K, French N, Mthembu D, Gilks C. Polyuria in association with Plasmodium falciparum malaria in a region of unstable transmission. Trans R Soc Trop Med Hyg. 2004 ;98(4):255-60.
  34. Timothy M. E. Davis, Li Thi Anh Thu, Tran Quang Binh, Ken Robertson, John R. Dyer, Phan Thi Danh, Desiree Meyer, Miles H. Beaman, Trinh Kim Anh. The hypothalamic-pituitary-adrenocortical Axis in Severe Falciparum Malaria: Effects of Cytokines, The Journal of Clinical Endocrinology & Metabolism, 1997; 82, (9):3029–3033.
  35. Mohapatra MK, Barihar PK, Mohapatra A.Adrenal insufficiency in severe falciparum malaria: its outcome and prediction by discriminant score. IJCMR 2019;6(9):148-155.
  36. Mohamed, S., Osman, A., Al Jurayyan, N.A. et al. Congenital toxoplasmosis presenting as central diabetes insipidus in an infant: a case report. BMC Res Notes 2014;( 7): 184 https://doi.org/10.1186/1756-0500-7-184
  37. Suresh Babu, P.S., Nagendra, K., Sarfaraz Navaz, R. et al. Congenital toxoplasmosis presenting as hypogonadotropic hypogonadism. Indian J Pediatr 2007; 74: 577–579.
  38. Massa G, Vanderschueren-Lodeweyckx M, Van Vliet G, Craen M, de Zegher F, Eggermont E. Hypothalamo-pituitary dysfunction in congenital toxoplasmosis. Eur J Pediatr. 1989 ;148(8):742-4.
  39. Oktenli C, Doganci L, Ozgurtas T, Araz RE, Tanyuksel M, Musabak U. Transient hypogonadotrophic hypogonadism in males with acute toxoplasmosis: suppressive effect of interleukin-1b on the secretion of GnRH.Human Reproduction 2004;19(4):859-866
  40. Setian N, Andrade RSF, Kuperman H, Della Manna T, Dichtchekenian V, and Damiani D. Precocious Puberty: An Endocrine Manifestation in Congenital Toxoplasmosis. Journal of Pediatric Endocrinology and Metabolism. 2002;15:9, https://doi.org/10.1515/JPEM.2002.15.9.1487
  41. Hamidreza Majidiani, Sahar Dalvand, Ahmad Daryani, Ma de la Luz Galvan-Ramirez, Masoud Foroutan-Rad. Is chronic toxoplasmosis a risk factor for diabetes mellitus? A systematic review and meta-analysis of case–control studies. The Brazilian Journal of Infectious Diseases, 2016;20(6):605-609.
  42. Shahnaz Shirbazou, Ali Delpisheh, Rahim Mokhetari, and Ghafor Tavakoli. Serologic Detection of Anti Toxoplasma gondii Infection in Diabetic Patients. Iran Red Crescent Med J. 2013 15(8): 701–703.

Infections in Endocrinology: Tuberculosis

ABSTRACT


Mycobacterium tuberculosis, the etiological agent of tuberculosis (TB), is responsible for the largest number of deaths worldwide caused by a single organism. Over 25% of the world population is infected with M. tuberculosis, though active infections account only for a small percentage. Though some degree of endocrine dysfunction is invariable in all patients with TB, clinically significant endocrinopathy other than glucose intolerance is rare. This chapter reviews endocrine dysfunction and endocrinopathies associated with TB infection related to the adrenal, thyroid and pituitary glands. Additionally, functional derangement of sodium and calcium homeostasis is also covered. Adrenal involvement can be found in up to 6% of patients with active TB, however isolated adrenal involvement is seen only in a fourth of these. The most common clinical manifestation is Addison’s disease (AD). Clinical manifestations of AD appear only after 90% of the adrenal cortices have been compromised. Thyroid tuberculosis (TTB) is very rare, even in countries with a high prevalence of TB. TB has been seen to involve the thyroid in 0.1 to 1% of patients. Primary pituitary TB (in the absence of systemic involvement and/or constitutional symptoms) is extremely rare, and secondary pituitary TB is more commonly encountered in clinical practice. Pituitary TB should be considered in the differential of a suprasellar mass especially in developing countries, as the condition is potentially curable with treatment. Hyponatremia has been commonly seen in patients admitted to the hospital with TB. The commonest cause of hyponatremia is the syndrome of inappropriate antidiuresis (SIAD). Other causes include untreated primary or secondary adrenal insufficiency, volume depletion, hyponatremia associated with volume excess and hypoalbuminemia and rare cases of cerebral salt wasting seen with tuberculous meningitis. The prevalence of hypercalcemia in patients with TB has ranged from 2-51% in various studies. The primary determinant in the development of hypercalcemia among patients with TB appears to be their Vitamin D status and nutritional calcium intake.


INTRODUCTION


Mycobacterium tuberculosis the etiological agent of tuberculosis (TB) was directly responsible for 1.3 million deaths in 2019. A majority of these deaths happen in patients without human immunodeficiency virus (HIV) co-infection making M. tuberculosis the pathogen responsible for the largest number of deaths in the world by a single organism. Additionally, TB is among the top ten causes of death worldwide (1).


Most cases of primary TB infections are clinically, bacteriologically, and radiologically inapparent. This primary infection in 5-10% patients leads to active disease after a period of latency within 2 years of contracting the infection. In another 5% the disease becomes active much later in life after a decline in general immunity. It is thought that over 25% of the world’s current population is infected with M. tuberculosis though active infections account only for a small percentage. In the year 2019 over 10 million patients were newly diagnosed with clinical TB. South East Asia accounted for over 44% of these along with Africa (25%), Western Pacific (18%), Eastern Mediterranean (8.2%), Americas (2.9%) and Europe (2.5%). The eight countries of India (26%), Indonesia (8.5%), China (8.4%), Philippines (6.0%), Pakistan (5.7%), Nigeria (4.4%), Bangladesh (3.6%) and South Africa (3.6%) account for two thirds of the world’s newly diagnosed cases last year (1).


As previously noted most active TB infections are reactivation of latent primary TB though a small but significant percentage of patients have active TB related to new exogenous re-infection. The most common primary site of adult active TB are the highly aerated upper lobes of the lungs. The defining pathology includes the presence of granulomas containing epithelioid cells, Langhan’s giant cells surrounded by lymphocytes with a center of caseous necrosis and varying degrees of fibrosis. This chapter focuses on the endocrinology of tuberculous infection (2, 3).


ALTERED IMMUNE-NEUROENDOCRINE COMMUNICATION IN TUBERCULOSIS        


The two-way communication between the immune system and the neuroendocrine system is well known and documented. An activated immune cascade can affect all the endocrine systems of the body. Adrenal steroids are the primary hormones that modify immune responses. The up-regulation of the hypothalamic-pituitary adrenal (HPA) axis by inflammation related to infections is primarily mediated by the action of inflammatory cytokines on the hypothalamic releasing factors. Cytokines like Interleukin-6 (IL-6), Interleukin-1β (IL-1β) and tumor necrosis factor-α (TNF-α) stimulate the secretion of corticotrophin releasing hormone (CRH) from the hypothalamus leading to corticotrophin (ACTH) secretion from the pituitary. The action of ACTH on the adrenal cortex leads to secretion of both cortisol and dehydroepiandrosterone (DHEA). Cortisol inhibits the T- lymphocyte mediated Th1 response while DHEA antagonizes the cortisol action on Th1 response. This intense immune-endocrine response to acute infection leads to early mobilization of the immune cells and a robust immune response by the host against the offending pathogen (4, 5).


However, in TB the chronic persistent activation of the immune-endocrine axis leads to misuse of the immune-endocrine axis and can exacerbate damage to the host. Primarily the prolonged activation of the HPA and resultant increase in glucocorticoid (GC) secretion leads to a change in the T-lymphocyte response from Th1 to Th2 response (6). Beyond this GCs can interfere with gene expression of certain transcription factors like nuclear factor kappa-β(NF-κβ) (7), inhibit the proliferation of effector T cells and cause an increased rate of apoptosis of the regulatory T cells (8). Clinical studies in patients with TB have shown increased circulating levels of cytokines like IL-6, IL-10, interferon-α (IFN-α) and cortisol. However, DHEA levels have been consistently shown to be well below normal levels. In summary, GCs appear to have an adverse effect on the anti-TB immune response while DHEA appears to have a favorable effect. This balance is adversely impacted with the chronic inflammation seen in TB.


Some of these changes in immune-endocrinology have also been implicated in the morbidity associated with TB. In vitro studies suggest that negative immune response to mycobacterial antigens was associated with increased IL-6 production which in turn was associated with lower body weights among patients with TB. Higher circulating IL-6 was also associated with loss of appetite (9). The increased circulating GCs additionally mobilize peripheral lipid stores and inhibit protein synthesis and favor loss of lean body mass. Hypothalamic CRH secretion also appear to have direct catabolic effects on the body other than its effect mediated through increased GC secretion (10). Among the adipocyte hormones there is a decrease in leptin and increased secretion of adipocytokines in TB. In an acute infection the above adaptive response appears to be useful by directing limited energy stores to the immune response away from the body’s physiological needs. However, in chronic infections like TB these changes lead to a chronic metabolic deficit leading to cachexia which in turn then affects the further ongoing immune response and disease outcome (11, 12).  


Some of these alterations in the immune-endocrine axis in M. tuberculosis infection are summarized in Figure 1.

Figure 1. Immune-Endocrine changes in male patients with tuberculosis (TB). Cytokine release by the T Lymphocytes stimulate the production of releasing factors (RFs) particularly Corticotrophin releasing factor (CRF) by the hypothalamus. Increased corticotrophin release from the pituitary is followed by the increased production of cortisol and dehydroepiandrosterone (DHEA). Transforming growth factor beta (TGF-β) which is increased in TB, in turn, inhibits DHEA production by adrenal cells despite corticotrophin related stimulation to produce increased DHEA. Overall, in patients with TB there is a decrease in the adrenal DHEA production in contrast to patients with acute infections. This unbalanced cortisol/DHEA production ratios from the adrenal cortex along with a reduction in testosterone from the testes favor a Th1→Th2 T Lymphocyte immune shift. The action of cytokines and cortisol on the adipose tissue leads to reduced amounts of leptin production. Leptin is also an immune-stimulant. TB patients also display an increased production of growth hormone (GH) and prolactin probably related to the protracted inflammation, in addition to augmented levels of thyroid hormones via an increase in the pituitary production of thyroid stimulating hormone (TSH). However, despite an increase in TSH there is no change in Free T4 and a decline in Free T3 hormones because of the inhibitory effect of TGF- β This overall pattern is responsible for anorexia, low food intake, lipid mobilization, decrease in protein synthesis which all contribute to the state of cachexia seen in patients with advanced TB (adapted from D’Atillio et al) (12).

ENDOCRINOPATHIES IN PATIENTS WITH TUBERCULOSIS        


Though some degree of endocrine dysfunction is invariable in all patients with TB, clinically significant endocrinopathies other than glucose intolerance is rare. In a small study of 50 patients hospitalized with sputum-positive pulmonary TB in South Africa the commonest endocrine dysfunction noted was a low free T3 state as part of sick euthyroid syndrome in over 90% of patients. The other common endocrine dysfunction noted in the study was a 72% prevalence of hypogonadotropic hypogonadism among male patients and a 64% prevalence of hyponatremia of whom almost half of them (17/50) had documented syndrome of inappropriate diuresis (SIAD). No patients in this study had clinically significant adrenal insufficiency and one patient had hypercalcemia (13).


In disseminated TB, seeding of the various endocrine glands with mycobacteria and formation of tubercules is common. In an autopsy study performed in over 100 patients who succumbed to disseminated TB done in the eighties, 53% had involvement of the adrenals, 14% had seeding into the thyroid gland, 5% had direct involvement of the testes, and 4% had seeding into the pituitary gland. Among these 100 patients only one had antemortem clinical adrenal insufficiency (14).


The full spectrum of possible endocrine abnormalities seen with tuberculosis is summarized in Table 1.


Table 1. Endocrine Abnormalities Seen with Mycobacterium Tuberculosis Infection and with Anti-Tubercular Therapy

Hypothalamus

Diabetes Insipidus

Pituitary

1.     Sellar mass lesion

2.     Tuberculous abscess

3.     Sellar Tuberculoma

4.     Thickened stalk with pituitary interruption syndrome

5.     Isolated hyperprolactinemia

6.     Incidental partial or complete hypopituitarism 

7.     Isolated hypogonadotropic hypogonadism

8.     Pituitary dysfunction seen with Tuberculous meningitis

Thyroid

1.     Tubercular thyroiditis

2.     Cold abscess of the thyroid

3.     Chronic fibrosing thyroiditis

4.     Sick euthyroid syndrome

5.     Para-amino-salicylic acid (PAS) related goiter

6.     Ethionamide and rifampicin related thyroid dysfunction

Parathyroid

Inflammation

Pancreas

1.     Stress hyperglycemia

2.     Frank diabetes

3.     Pancreatic abscess 

Testes

1.     Isolated TB orchitis

2.     TB epididymitis

3.     Epididymo-orchitis 

4.     Primary gonadal failure

Ovaries

1.     Tubo-ovarian abscess

2.     Tubal blockage

3.     Unexplained infertility

Water Metabolism

1.     Hyponatremia

2.     Syndrome of inappropriate anti-diuresis (SIAD)

3.     Cerebral salt wasting (CSW)

Vitamin D-Calcium Metabolism

1.     Parathyroid hormone independent hypercalcemia

2.     Vitamin D deficiency/hypocalcemia related to isoniazid and rifampicin

Adrenals

1.     Tubercular adrenalitis

2.     Addison’s disease

3.     Reversible adrenal insufficiency

4.     Isolated DHEA deficiency 


In this chapter we will review endocrine dysfunction and endocrinopathies associated with TB infection related to the adrenal, thyroid and pituitary glands. Additionally, functional derangement of sodium, and calcium homeostasis will be covered. Glucose intolerance, diabetes and tuberculosis is a large area of public health and will not covered in this chapter.


ADRENALS AND TUBERCULOSIS


TB can involve both adrenal glands primarily or the involvement may be part of disseminated TB. Both conditions may present with primary adrenal insufficiency (Addison’s Disease). Anti-tuberculous therapy (ATT)-related enzyme induction abnormalities can also lead to adrenal dysfunction and in some cases unmask subclinical adrenal insufficiency. Chronic steroid therapy used in the treatment of some types of tuberculous infection can lead to suppression of HPA axis and secondary adrenal insufficiency. Finally, it is important to remember that pituitary involvement in central nervous system (CNS) TB can sometimes lead to isolated corticotropin deficiency with adrenal insufficiency or it can be part of generalized hypopituitarism 


Tuberculosis and Addison’s Disease


Thomas Addison in 1855 first described chronic adrenal failure, or Addison’s disease (AD), due to Mycobacterium tuberculosis infection involving both the adrenal glands. In his paper describing AD, 6/11 patients had tuberculous involvement of the adrenal glands. In 1930, Guttman reported a large series of 566 cases with AD, of which 70% was due to tuberculous adrenalitis (15). In 1956 only 25% of AD was related to TB infection (16). The decreasing incidence of tubercular adrenal failure in Western literature was highlighted in a recent large study of 615 cases of AD from Italy in 2011; in this series only 9% of cases were due to TB (17).


This decline in the number of patients with AD related to TB has not been seen in countries endemic for TB like India and South Africa. In India, tuberculous etiology was found in 47% of patients with AD, and of them 85% had enlargement of one or both adrenal glands on imaging (18). The differences between AD due to TB and those with idiopathic AD is summarized in Table 2. In South Africa, 32% of patients with AD had tubercular etiology (19). The most common cause of AD worldwide, however, is autoimmune adrenalitis.


Table 2. Differences in Clinical Presentation of Tubercular Addison’s Disease (AD) versus Idiopathic AD (18)

Clinical Features

Tubercular

Idiopathic

p-value

Mean age (in years)

42

35

NS

Durations of symptoms before diagnosis (in months)

14

21

NS

Sex Ratio (M: F)

10:1

14:8

< 0.05

Presentation as crisis (%)

40%

23%

NS

Evidence of other autoimmune disease (%)

10%

27%

< 0.05

Evidence of extra-adrenal TB (%)

55%

9%

< 0.05

Adrenal Cytoplasmic Antibodies (%)

17%

50%

< 0.05


PATHOPHYSIOLOGY OF TUBERCULAR ADRENALITIS            


Adrenal TB develops from hematogenous or lymphatic spread, hence is often associated with extra-adrenal infection. The rich vascularity of the adrenal gland and high levels of local corticosteroids that suppress cell mediated immunity create an ideal microenvironment for the growth of Mycobacterium tuberculosis (20). Adrenal involvement can be found in up to 6% of patients with active TB, however isolated adrenal involvement is seen only in a fourth of these (1.5-3% of cases with tubercular infection) (21, 22). Clinical manifestations of AD appear only after 90% of the adrenal cortices have been compromised (23).


The patterns of adrenal gland involvement in TB are summarized below and in Figure 2 (24):

  1. Chronic infection of the adrenal gland, with clinical manifestations of primary adrenal insufficiency appearing years after initial infection. Pathologically these patients have small atrophic fibrous glands with or without calcification.
  2. Isolated adrenal gland involvement early in the course of disease usually within 2 years of the primary infection. Pathologically these patients most commonly present with bilateral adrenal enlargement because of mass lesions secondary to production of cold abscesses within the adrenal glands. Milder enlargement can be seen in patients with extensive granulomas within the adrenal gland. Lastly, patients with isolated adrenal tuberculosis may also present with normal sized glands with granulomatous inflammation seen microscopically. Calcifications maybe seen in these cases as well.
  3. Secondary adrenal insufficiency due to prolonged steroid therapy in disseminated TB or tubercular involvement of the pituitary or hypothalamus.
  4. Subclinical steroid deficiency unmasked by ATT-related enzyme induction.

Figure 2. Mechanisms of adrenal insufficiency with tuberculosis. Both primary adrenal failure and secondary adrenal insufficiency are possible. The presentation of primary adrenal failure can be both acute and chronic. In patients with acute presentation usually within 2 years of tuberculous infection, the pathological presentations could be one of the three noted. Chronic primary adrenal failure is pathologically defined by atrophic and fibrosed glands. [ATT-Anti-tuberculous therapy

CLINICAL FEATURES


Adrenal TB can be found in any age, however is more commonly seen in adults. Rare cases have also been described in the pediatric age group (25, 26). Thomas Addison’s first description of AD showed a constellation of symptoms like “general languor and debility, remarkable feebleness of heart’s action, and a peculiar change in the color of the skin.” Classic manifestations of AD in the form of malaise or fatigue, anorexia, weight loss, nausea, vomiting, muscle and joint pain, orthostatic hypotension, skin hyperpigmentation and salt craving are often present. Mineralocorticoid deficiency leads to postural hypotension, while hyperpigmentation occurs due to activation of the melanocortin 1 receptors (MC1R) in turn because of high ACTH levels (27). In some patients, however, hyperpigmentation can be absent due to reduced stimulation of MC1R from adrenocorticotropin hormone (ACTH), resulting in an alabaster-like appearance (27). A prior history of TB may also be provided in some patients.


RADIOLOGIC FINDINGS


Computed tomography (CT), magnetic resonance imaging (MRI) and positron emission tomography (PET) are useful non-invasive tools in the diagnosis of adrenal TB. CT has been regarded as the modality of choice for diagnosing adrenal TB, and should include both non-contrast and contrast-enhanced techniques. Adrenal involvement is usually bilateral (28), and findings vary according to course of disease.


  • Early stage: In the first two years, CT shows noncalcified enlarged adrenals with areas of lucency reflecting caseous necrosis, and a peripheral rim of contrast-enhanced parenchyma. Contours of the adrenal glands are generally preserved.
  • Late stage: As disease progresses, the adrenals normalize in size, then shrink, and have calcific foci with irregular margins. Calcifications are best visualized on non-contrast CT scans. These may be either diffuse, focal or punctate in nature (22). These findings correlate with long-standing fibrosis and dystrophic calcification seen with tuberculous granulomas.


LABORATORY FINDINGS


Common findings in patients with adrenal TB include hyponatremia, hyperkalemia and normochromic anemia (27). Hyponatremia can occur due to decreased inhibitory control of vasopressin secretion, resulting in mild SIAD (29). The Mantoux (tuberculin) test usually is strongly positive and erythrocyte sedimentation rate (ESR) is elevated.


  • In primary AD, baseline serum ACTH levels are higher than 100 pg/ml, plasma renin levels are elevated and serum aldosterone levels are low. In secondary AD, ACTH levels will be low or inappropriately normal, while mineralocorticoid secretion will be normal (27).
  • Serum DHEAS will also be low in patients with both primary and secondary AD (27).
  • Adrenal insufficiency can be demonstrated by low morning plasma cortisol with a reduced response to synthetic ACTH (27). Impaired ACTH-stimulated cortisol responses have also been observed with lower baseline cortisol levels, and both higher and lower cortisol responses to ACTH stimulation in patients with isolated pulmonary TB without adrenal involvement (24). Injectable tetracosactide hexa-acetate, ACTH 1-24 (Synacthen®) (SST), is not marketed or easily available in many developing countries in the world including India. An alternative ACTH which is injectable long-acting porcine sequence, ACTH 1-39 (Acton Prolongatum®) (APST), is easily available and much cheaper. In a study done recently in India by Nair et al in 20 patients with established adrenal insufficiency and 27 controls, the area under the curve of APST (at 120 min) was 0.986 when compared to the standard SST, thus proving its high accuracy. A serum cortisol cut off value of 19.5 µg/dL at 120-min following APST showed a sensitivity of 100% and specificity of 88% (30).


PATHOLOGY OF ADRENAL TUBERCULOSIS


Macroscopic involvement of the adrenal gland can be seen in up to 46% of patients with adrenal TB. Bilateral involvement is seen in nearly 70% of patients, however they may not be equally affected. Mean combined weight of adrenal gland ranges from 10-37 gm (mean 17 gm) (31). Caseous necrosis can be seen grossly within a large cavity or within multiple scattered tubercles.


Histopathologically, destruction of both the cortex and the medulla is seen with the following patterns of adrenal gland involvement (24):

  1. Presence of granulomas, with or without necrosis. The granulomas show epithelioid cell collections with typical Langhan’s giant cells and an admixture of lymphocytes and plasma cells. Ziehl-Neelsen stain is very useful for detecting acid fast bacilli (AFB) within the necrotic areas, as well as within the granulomas.
  2. Glandular enlargement with destruction of parenchyma by necrotizing granulomas.
  3. Mass lesion secondary to formation of cold abscesses. In these cases, CT-guided fine needle aspiration cytology (FNAC) is helpful for demonstration of AFB, polymerase chain reaction (PCR), and culture for Mycobacterium tuberculosis In most cases, a combination of histopathology, PCR and culture may be required to confirm the diagnosis.
  4. Adrenal atrophy secondary to fibrosis resulting from long-standing tuberculous infection (32).


DIFFERENTIAL DIAGNOSIS


The differential diagnosis for adrenal enlargement includes primary or metastatic tumors, lymphomas, fungal infections like cryptococcus and histoplasma, amyloidosis, sarcoidosis, hemangiomas and adrenal cortical hyperplasia (24, 28). Tissue sampling for microbiological (PCR and culture) and pathological analysis should adequately distinguish between them.


TREATMENT


Treatment for active adrenal TB is similar to the regimen followed for extrapulmonary TB with use of multidrug ATT. Rifampicin induces hepatic enzymes that increase the metabolism of glucocorticoids; hence higher doses of replacement glucocorticoids may be required. Rarely, Rifampicin may trigger an adrenal crisis.


In cases of chronic disease, adrenal gland function is unlikely to recover due to massive destruction of the gland (20, 28). However, a few authors report improvement in adrenal function when patients are given ATT early in the course of disease (33-35). This may be in part due to the remarkable regenerative capacity of the adrenal cortex to undergo hyperplasia and hypertrophy during active infection (20).


Hormone replacement for primary and secondary adrenal insufficiency related to TB follow the same principles as autoimmune or idiopathic primary AD or secondary adrenal insufficiency. In addition to appropriate glucocorticoid replacement mineralocorticoid replacement may be required. Care must be taken to educate patients about stress dosing and the need for parenteral steroids when the patient may not be able to take or absorb oral glucocorticoids. 


THYROID AND TUBERCULOSIS


The thyroid gland is an uncommon site for infection by M. tuberculosis. Thyroid TB (TTB) is therefore very rare, even in places with a high prevalence of TB. The primary presentation of TTB is as a mass or a goiter. Overt hormonal dysfunction is very uncommon in TTB. However, in patients with tuberculosis affecting any organ clinically insignificant abnormalities in thyroid function tests are very common. ATT also causes both structural and functional thyroid dysfunction. Pre-operative diagnosis of TTB can be made only with a high index of suspicion while evaluating thyroid nodules especially in communities with a high prevalence of TB (36).


Epidemiology


  1. tuberculosis has been documented to be involved in the thyroid gland of 0.1 to 1% of patients who underwent thyroid tissue sampling for any indication (37-39). In an autopsy series of patients with advanced disseminated TB occurring in the pre- and post-antibiotic era, 14% had evidence of thyroid gland involvement (14). In a large cohort of 2,426 patients from Morocco, only eight had evidence of TB (0.32%). These were in the form of goiter or as a solitary thyroid nodule. In a study from India, thyroid involvement has been seen in 0.43% of specimens obtained from FNAC (40), while among Turkish patients undergoing thyroidectomy, 0.25 - 0.6% showed thyroid involvement by M. tuberculosis (41, 42).


Pathogenesis


Thyroid involvement in TB is very uncommon. A few postulated intrinsic properties of the thyroid which are proposed not to allow Mycobacterium tuberculosis bacilli to survive include (24, 36):

  • Presence of iodine-containing colloid possessing bacteriostatic activity.
  • High blood flow within the thyroid gland with the presence of intracellular iodine.
  • Increased phagocytosis within the gland, seen in hyperthyroidism.
  • Rich lymphatic supply to the thyroid.
  • Thyroid hormones themselves exercise anti-TB roles.


TTB can be primary or secondary

  1. Primary TTB is involvement of the thyroid gland alone, with no evidence of TB elsewhere in the body.
  2. Secondary TTB is usually the result of hematogenous, lymphatic and/or direct spread from an active tubercular focus involving the cervical lymph nodes or larynx. Secondary TTB is much more commonly encountered than primary TTB, and TTB may go undiagnosed in many cases especially where clinical signs are non-specific (24).


Clinical Features


TTB occurs slightly more commonly in women as compared to men (M: F = 1:1.4) and occurs over a wide age range of 14 to 83 years, median age of 40 ± 16 years for men and 43 ± 17 years for women (36).


TTB can manifest as a localized swelling with cold abscess mimicking carcinoma, as multinodular goiter, as a solitary thyroid nodule without cystic component, or very rarely as an acute abscess. The various presentations are summarized in Figure 3. Rarely TTB may present as a goiter or a chronic fibrosing thyroiditis. Presence of cervical lymphadenopathy may raise suspicion of malignancy (36). Clinical presentation is often subacute, but may be acute in cases of abscess (43). Pain associated with swelling, thyroid tenderness, fever and localized extra-thyroidal findings such as dysphagia, dysphonia or recurrent laryngeal nerve palsy are less common in TTB as compared to patients with acute bacterial thyroiditis (24). However, some patients with TTB may present with pyrexia of unknown origin. Table 3 documents with differences in clinical presentation between TTB and bacterial thyroiditis.

Figure 3. Presentations of thyroid tuberculosis (TTB). Relatively common presentations in green and rarer ones in yellow and orange colors.


Table 3. Clinical Features that Help Differentiate Between Tuberculous Thyroiditis and Bacterial Thyroiditis

Clinical Features

Tuberculous Thyroiditis

Bacterial Thyroiditis

Pain

-

+++

Pyrexia

+1

+++

Duration of illness (mean duration) (Ref;24)

105 days

18 days

Dysphagia

++

+++

Dysphonia

++

+++

Recurrent Laryngeal Nerve Palsy (Hoarseness)

++

+++

History of previous thyroid illness

-

+

Tenderness over the gland

-

+++

Leukocytosis

-

++

Elevated Erythrocyte Sedimentation Rate (ESR)

+++

+

1Rare reports of presentation as pyrexia of unknown origin


Most patients with TTB are euthyroid and do not have pre-existing thyroid disease. Very rarely TTB can be associated with hypothyroidism, with a period of subclinical hyperthyroidism preceding the hypothyroidism (44). Myxedema can occur in cases with extensive destruction of the thyroid gland by disseminated TB, which can also be fatal (45). Past history of TB may be elicited in some cases, and patients may have history of cervical lymphadenopathy (43).


Radiological and Laboratory Findings


Chest X-ray, ESR, and tuberculin skin test should be performed in all cases of suspected TTB. The diagnosis is made only after FNAC or histopathological examination of the surgical specimen when FNAC is negative (43). Sputum AFB may rarely assist in diagnosis in cases with associated pulmonary TB.


Ultrasonography usually shows a heterogenous, hypoechoic mass similar to a neoplastic nodule. Anechoic areas with internal echoes may be seen in abscesses. Contrast-enhanced CT scan can determine the location of the necrotic lesions (46).


On MRI the normal thyroid is homogenously hyperintense relative to the neck muscles on both T1 and T2-weighted images. TTB may show intermediate signal intensity due to granulomatous inflammation, however, this appearance is also seen in thyroid carcinoma. Abscesses appear hypointense on T1 and hyperintense on T2-weighted images, and may show peripheral rim of contrast enhancement (47).


Thyroid function tests (TFT) are usually normal in patients with TTB. Thyrotoxicosis in the initial stage of rapid release of thyroid hormone, and myxedema in the later stage of thyroid gland destruction have also been noted, and patients may have abnormal TFT accordingly (24). Only 5.2% of patients with TTB have abnormal TFT (36).


Pathology of Thyroid TB


In most cases, TTB can be diagnosed on FNAC which typically shows epithelioid cell granulomas with Langhan’s giant cells, peripheral lymphocytic infiltration and purulent caseous necrosis. The yield of AFB by the Zeihl Neelsen stain is more with FNAC samples than in biopsies. The aspirates can be sent for TB culture or PCR. TB-PCR is much more sensitive in detecting M. tuberculosis deoxyribonucleic acid (DNA) from FNA samples, and is an alternative to rapid diagnosis of TB in AFB-negative cases (40). The diagnosis is substantiated by histopathology which typically shows granulomas, Langhan’s giant cells and necrosis (Figure 4). Few cases show dense lymphocytic infiltrate with prominent germinal centers, resembling lymphocytic or Hashimoto thyroiditis (Figure 5).

Five pathological varieties of TTB have been described (36):

  1. Multiple miliary lesions throughout the thyroid gland
  2. Goiter with caseation necrosis
  3. Cold abscess
  4. Chronic fibrosing tuberculosis
  5. Acute abscess

Fig 4. Case of TTB showing granulomas within the thyroid parenchyma comprised of epithelioid cells with Langhan’s giant cells (yellow arrows) and foci of necrosis (black arrows). Hematoxylin and eosin, 100x.

Figure 5. Case of TTB showing dense lymphocytic infiltrate with prominent germinal centers in the thyroid parenchyma (arrow). Hematoxylin and eosin, 100x.


Differential Diagnosis


TTB, although rare, should be considered in the list of differentials for solitary or multinodular thyroid nodules, and abscesses (36). Reidel’s thyroiditis may mimic chronic fibrosing tuberculosis clinically, however histopathology clinches the diagnosis (42).


Treatment


ATT remains the cornerstone of treatment. Surgery has a limited role with drainage of abscess, avoiding total destruction of gland and subsequent hypothyroidism. However inadvertent total thyroidectomies are performed as the pre-operative diagnosis is commonly a malignancy. In cases were TB was diagnosed prior to surgery, ATT is well tolerated with resolution of symptoms, reduction in thyroid mass symptoms, and with favorable reversal of thyroid hormonal dysfunction. Standard ATT schedules are followed. Thyroid hormone levels should be monitored before, during, and after treatment. Despite strict ATT, recurrence and failure rate is 1% due to resistance to ATT drugs (48).


Functional and Structural Alterations of Thyroid Functions with Active Tuberculosis and with Anti-tubercular Therapy


Among hospitalized patients with TB without any evidence of involvement of the thyroid gland sick euthyroid syndrome with low free T3 is common. The estimates vary between 63-92% and probably is the commonest endocrinopathy seen in patients with TB (13,49). As with other unwell patients the degree of reduction in Free T3 serves both as a marker for severity of the disease and mortality. In the study by Chow et al, all patients who survived the hospitalization had normal TFT within one month of initiation of ATT. In community dwelling patients with TB, the prevalence of thyroid dysfunction is unclear.


Thyroid hormones are metabolized in the liver and the kidneys. In the liver, the enzyme CYP3A4 belonging to the hepatic cytochrome P450 family is responsible for the metabolism. Rifampicin is a potent activator of the P450 system and this leads to an increase in T4 turnover. In most adults with normal a hypothalmo-pituitary-thyroid axis this increase in turnover is compensated by an increase in the production of thyroid hormones and a slight increase in thyroid volume. This may be noted biochemically as a slight increase in free T3 and total T3 levels after rifampicin administration. There are no changes in free T4 and TSH concentrations (50). Among patients with pre-existing thyroid disease with a limited capacity to increase production of thyroid hormones, the rifampicin-mediated increase in free T4 turnover might lead to the need for an increase in thyroid hormone replacement therapy. In a retrospective cohort of patients on levothyroxine replacement therapy, the addition of rifampicin as part of ATT led to a need for a 26% increase in dose in patients on thyroid hormone replacement therapy and a 50% increase in patients on suppressive therapy post thyroidectomy for differentiated thyroid cancer (51).


Older anti-tubercular agents have more profound effects on thyroid physiology. Studies by Munkner et al demonstrated an association between the use of p-amino salicylic acid (PAS) and the development of goiter (52). PAS and ethionamide were also associated with significant risk of developing hypothyroidism (53, 54). However, these agents are currently not used as first line agents. It is prudent to monitor TFTs 6-8 weeks after initiation of any of these three agents in patients who have pre-existing thyroid dysfunction.


PITUITARY AND TUBERCULOSIS


Direct involvement of the pituitary gland by Mycobacterium Tuberculosis is very rare. Some of the earliest published reports of pituitary TB include von Rokitansky who noted tubercles in the hypophysis as early as 1844, Letchworth in 1924 who reported a case of primary pituitary tuberculoma on autopsy examination, and Coleman and Meredith documented a case of pituitary TB in 1940 (55, 56).


The spectrum of involvement (Figure 6) of the pituitary gland with TB includes sellar, parasellar, and stalk tuberculomas and sellar tubercular abscesses. Patients with tuberculous meningitis exhibit a range of functional pituitary dysfunction even in the absence of any evidence of direct invasion/extension of the disease into the sella. Among survivors of tubercular meningitis hypopituitarism was noted 10 years after the primary disease. Hypothalamic pituitary dysfunction such as isolated hypogonadotropic hypogonadism may accompany cachexia and weight loss that can complicate more extensive disease. Infiltrative tubercular disease of the stalk can produce pituitary interruption syndrome including isolated diabetes insipidus and hyperprolactinemia.


In most cases the diagnosis of tuberculosis of the pituitary is established on histopathology, often in the absence of confirmatory culture studies or positive acid-fast stains (57). Although the diagnosis is difficult on clinical and radiological examination, pituitary TB should be considered in the differential of a suprasellar mass especially in developing countries, as the condition is potentially curable with ATT (58, 59).


Figure 6. Spectrum of structural and functional disease of the pituitary seen with tuberculosis

Sellar Tuberculoma/Abscess


EPIDEMIOLOGY  


The incidence of pituitary TB is very low. In an autopsy series of 3,533 cases, only 2 of 89 intracranial tuberculomas involved the sella turcica, while in another autopsy series of 14,160 cases, only 2 cases of TB were encountered involving the anterior pituitary lobe (50).  In patients with late generalized TB, the incidence of pituitary involvement is 4% (14). Nearly 70% of pituitary TB reported worldwide has been reported from the Indian subcontinent, probably attributable to the higher prevalence of TB in this location (60). In the largest series from India, 18 cases of sellar TB were diagnosed based on histopathology from 1148 pituitary surgeries (60).


PATHOGENESIS


Pituitary TB can arise either from hematogenous seeding, in the presence or absence of miliary disease, or from direct extension from the brain, meninges or sinuses. TB can either involve the pituitary gland alone, or involve the adjacent and/or distant organs as well (60). Both the adenohypophysis and neurohypophysis may be involved by TB. Supra-sellar extension is common in pituitary TB with only rare cases confined to the sella (57). 


CLINICAL FEATURES


Pituitary TB occurs at a mean age of 34.1 ± 13.6 years (age range 6 to 68 years), and is more common in women (F:M = 2.7:1). Young children are at high risk of progression of TB including CNS disease. Clinical presentation is often indolent. Duration of symptoms average 4 months (60, 61).


Pituitary involvement, either as a sellar abscess or tuberculoma presents primarily with symptoms of a sellar mass. The common presentations clinically are gradual onset of headache (85.2%), visual loss (48.1%) (Figure 7), seizures and cranial nerve palsies. Patients with infiltration of the stalk by tuberculomas may present with central diabetes insipidus with polyuria (8.6%) or menstrual abnormalities related to hyperprolactinemia like amenorrhea in women (37.3%) and galactorrhea (23.7%) (60, 61). Growth retardation and hypogonadism are rare findings in children with pituitary TB (61). Hyperphagia resulting in obesity or weight gain has also rarely been documented which may occur due to the loss of sensitivity of the appetite-regulating network in the hypothalamus to afferent peripheral humoral signals (62). Apoplexy, characterized by acute infarction and/or hemorrhage in the pituitary gland, is an uncommon presentation of pituitary TB (63). Systemic and constitutional symptoms may or may not be present; low grade fever may be seen in 14.8% of patients. Other organs may show evidence of TB in 26.9% (60, 64). Tuberculous meningitis may be associated in a few cases.

Figure 7. Bitemporal hemianopsia demonstrated on perimetry.

RADIOLOGICAL FINDINGS


The diagnosis of primary pituitary TB is challenging and often difficult. Radiologically pituitary TB can mimic pituitary adenoma, arachnoid cyst, pyogenic abscess, metastasis, or craniopharyngioma. MRI typically shows a sellar mass which may extend into the suprasellar region, involving the optic nerves and inter-carotid space (Figure 8). T1-weighted MR images appear isointense. T2-weighted images show central hyperintensity corresponding to caseous necrosis, and gadolinium contrast imaging may show thick ring enhancement in the periphery with central hypointense areas. Meningeal enhancement with enhancement of the thickened pituitary stalk may favor non-adenoma etiology. Additional findings like sellar/suprasellar calcification and sellar floor erosion have also been described (57, 63-65).

Figure 8. Magnetic resonance imaging of a patient with pituitary tuberculosis shows a sellar mass lesion measuring 2.1 cm x 1.9 cm x 1.4 cm with suprasellar extension A) heterogenous predominantly increased signal intensity on T2 weighted imaging and B) hypointense on T1 weighted imaging. C and D) Significant homogenous post contrast enhancement of the mass lesion on axial (C) and sagittal (D) views, respectively. Involvement of the pituitary stalk and superior displacement of the optic chiasma is also seen. Bright signal of posterior pituitary is maintained.

MR spectroscopy can detect elevated lipid peaks in a tuberculoma at 0.9, 1.3, 2.0 and 2.8 ppm, and a phosphoserine peak at 3.7 ppm. Lipid resonance at 0.9 and 1.3 ppm occur due to methylene and terminal methyl groups on fatty acids found in caseous necrosis (66)


LABORATORY FINDINGS


Panhypopituitarism may be encountered on evaluation of anterior pituitary hormones like thyroid stimulating hormone (TSH), early morning cortisol, growth hormone, prolactin, luteinizing hormone (LH) and follicle-stimulating hormone (FSH).


Testing for HIV and immunocompromised states should be considered in the appropriate clinical setting. Positive tuberculin test and elevated ESR may be seen in patients with systemic involvement.


PATHOLOGY OF PITUITARY TUBERCULOSIS


The most common pattern of tuberculous involvement of the pituitary on histopathological examination is granulomas without caseation necrosis (59.6%) as show in Figure 9A. Granulomas may be miliary or may coalesce together to form a conglomerate mass. Reticulin stain helps demonstrate loss of normal reticulin pattern of the pituitary (Figure 9B). The granulomas are composed of epithelioid cells, Langhan’s giant cells, and lymphocytes (Figure 9C-D). Immunohistochemistry (IHC) with CD68 can help confirm the presence of epithelioid histiocytes in cases of unequivocal morphology, while CD3, CD20 and CD138 can highlight a mixture of T-lymphocytes, B-lymphocytes and plasma cells, respectively (Figure 10A-D). Pus and caseation necrosis are seen less commonly, and in these cases the yield of AFB is greater than with cases without necrosis. As with other sites, demonstration of AFB on biopsy material is very low. In such cases growth of M. Tuberculosis organisms on culture and TB PCR aid in diagnosis.

Figure 9. Pituitary tuberculosis. Biopsy of the pituitary showing nests of pituicytes (black arrows) destroyed and separated by confluent granulomas (red arrow). A) low power view, Hematoxylin and Eosin (H&E), 100x; B) corresponding area showing reticulin-free zones (asterisks) occupied by granulomas, Gordon and Sweet’s silver reticulin stain, 100x; C & D) higher power views showing non-caseating granulomas comprised of epithelioid cells with occasional Langhan’s giant cells (top left) and lymphocytes, H&E, 400x.

Figure 10. Immunohistochemistry in pituitary tuberculous granulomas shows mixed inflammatory infiltrate made up of epithelioid histiocytes (CD68), T-lymphocytes (CD3), B-lymphocytes (CD20) and occasional plasma cells (CD138) (A-D, respectively). Diamino benzidine chromogen, 100x.

DIFFERENTIAL DIAGNOSIS


Sarcoidosis must be considered in the differential of non-caseating granulomatous hypophysitis, and shows naked granulomas without infiltrating lymphocytes. IgG4-related disease typically shows increase in plasma cells of the IgG4 subtype with storiform fibrosis. Histiocytic lesions like Langerhans cell histiocytosis (LCH) usually involve the infundibulum and typically show presence of Langerhans’s histiocytes with eosinophils. LCH is more common in children and young adults. Other inflammatory lesions involving the pituitary stalk are lymphocytic infundibuloneurohypophysitis (LINH), Wegener’s granulomatosis, and pituitary stalk parasitosis (67). Fungal granulomas involving the hypophyseal region can be ruled out by performing fungal stains on tissue sections (60).


TREATMENT


Transsphenoidal approach is preferred for surgery and is used for diagnosis and decompression of adjacent structures. Typical intra-operative findings are firm to hard, non-suckable greyish tissue with thickening of the dura. Pituitary TB can be managed conservatively if the diagnosis is confirmed with cerebrospinal fluid TB PCR and other tests.

ATT may be given for up to 18 months and patients should be on periodic follow up with assessment of hormonal profile. Lifelong replacement of hormones may be required in some patients (68). Recurrence of TB in lymph nodes despite completion of 18 months of ATT has been reported to occur due to resistance of M.tuberculosis bacilli to Rifampicin (69).


Pituitary Dysfunction in Patients with Tuberculous Meningitis (TBM)


In an Indian study of 75 patients with tuberculous meningitis, common pituitary functional abnormalities included hyperprolactinemia (49%), cortisol insufficiency (43%), central hypothyroidism (31%) and multiple hormone deficiencies (29%) (70). Prevalence of functional pituitary abnormalities seen in TBM in multiple studies from India is summarized in Table 4 (71, 72).  In addition, there may be hyponatremia.


Table 4. Pituitary Involvement in Patients with Tuberculous Meningitis


Delhi (70)

Chandigarh (71)

Lucknow (72)

Number of patients

75

63

115

Any Involvement of Pituitary


84.2%

53.9%

Single Axis Involvement


39.8%

30.4%

More than one axis (Panhypopituitarism)

29.3%

44.4%

23.5%

Hypogonadotropic Hypogonadism

NR

38.1%

33.9%

Hyperprolactinemia

49.3%

49.2%

22.6%

Secondary Adrenal insufficiency

42.7%

42.9%

13%

Central hypothyroidism

30.7%

9.5%

17.4%

Isolated Growth hormone deficiency

NR

NR

7.8%

Syndrome of Inappropriate anti-diuresis 

NR

NR

9.%

Diabetes Insipidus

Nil

Nil

Nil

NR- Not reported


Even among patients who survive tuberculous meningitis, pituitary dysfunction may persist. A study done by Lam in Hong Kong showed growth hormone deficiency to be the most common finding in patients younger than 21 years of age with tuberculous meningitis after 10 years of surviving tuberculous meningitis (73). 


WATER IMBALANCE AND TUBERCULOSIS


Hyponatremia has been commonly seen in patients admitted to the hospital with TB. Though data about the prevalence of hyponatremia among community treated patients with uncomplicated pulmonary TB is sparse, among inpatients admitted with TB, hyponatremia has been seen in 10-76% of patients (74-78). The commonest cause of hyponatremia is the SIAD. Other causes include untreated primary or secondary adrenal insufficiency, volume depletion, hyponatremia associated with volume excess, and hypoalbuminemia and rare cases of cerebral salt wasting seen with tuberculous meningitis (79) (Figure 11). Hypernatremia is rarely encountered and usually signifies involvement of the hypothalamus or the pituitary stalk leading to diabetes insipidus.

Figure 11. Causes of hyponatremia in patients with Tuberculosis. [SIAD-Syndrome of inappropriate anti-diuresis]. Green boxes are common causes, yellow is less common and the red boxes are rare.

Syndrome of Inappropriate Antidiuresis (SIAD)


In the absence of adrenal deficiency, patients with non-CNS TB who are adequately hydrated (euvolemic) the hyponatremia is almost always a consequence of retention of free water despite low serum osmolality (inappropriate antidiuresis). Wiess and Katz first noted the association between active untreated TB and syndrome of inappropriate antidiuresis (SAID). In four patients with active TB and hyponatremia they noted excessive urinary sodium excretion. When these four patients were put on fluid restriction there was an improvement in the serum sodium levels. All patients who survived also had gradual normalization of serum sodium levels and SAID with treatment of TB (80).


Three different mechanisms have been proposed for the development of SIAD in patients with tuberculosis without evidence of adrenal involvement.

  1. The first proposed mechanism in common with other pulmonary diseases is the stimulation of baroreceptors by chronic hypoxemia that can accompany extensive pulmonary TB. There is release of anti-diuretic hormone (ADH) in response to baroreceptor stimulation which leads on to SIAD (81).
  2. The second possible mechanism proposed is a shift of the “osmostat” towards the left as seen in patients with decreased effective circulating volume leading to ADH release at lower serum osmolality. Investigators have noted higher circulating ADH levels in the serum despite hyponatremia which subsequently declined when free water was administered. The intact response to hypoosmolality suggested that the osmoregulation set up in the hypothalamus was functioning normally but at a lower osmolar threshold for ADH release (82).
  3. The third mechanism proposed is the ectopic secretion of ADH by the tubercular granuloma. This mechanism was proposed by the authors of a case where a patient with well-established diabetes insipidus developed SIAD and hyponatremia after contracting pulmonary tuberculosis (83).


Patients with CNS TB have a higher prevalence of hyponatremia compared to those with pulmonary infections. In adult patients with TBM the prevalence of a low sodium state has varied from 45-65% in different studies (84-86). In children with TBM the prevalence varied from 38-71% in different studies (87-89). In children with TBM and hyponatremia there appears to be an association with mortality and increased intracranial pressures (87, 90). A recent review from India compiled data from over 11 studies comprising a total of 642 patients with TBM and found the prevalence of hyponatremia to be 44%. Unlike non-CNS TB the commonest etiology of hyponatremia among patients with CNS TB is cerebral salt wasting (CSW) rather than SIAD (36% vs 26%) (86). The other less common causes of hyponatremia encountered in TBM include the following

  1. Dehydration and hypovolemic hyponatremia due to anorexia, vomiting, nausea and diarrhea
  2. Drug induced including use of diuretics, osmotic agents like mannitol and anti-seizure medications like carbamazepine and phenytoin.
  3. Secondary adrenal insufficiency and rarely primary adrenal insufficiency


CLINICAL PRESENTATION AND TREATMENT OF SIAD ASSOCIATED WITH TUBERCULOSIS        


Most patients with SIAD and TB are asymptomatic and do not require any treatment. The hyponatremia accompanying SIAD self corrects itself when ATT is started (82). Fluid restriction is only required in symptomatic patients or in patients with severe hyponatremia. Prior to restricting fluids in patients with non-CNS TB it is important to rule out dehydration either by assessing volume status clinically, assessing volume status with urine spot sodium levels, or measuring central venous pressures in unwell patients. In patients with CNS TB, it is important to rule out CSW prior to initiating fluid restriction. Hypertonic saline infusions are limited to patients with life threatening symptoms like seizures and deep coma attributable to hyponatremia (86). Care should be taken to correct hyponatremia at a rate not faster than 8-10 mEq/L in 24 hours to avoid central pontine myelinolysis.  


Cerebral Salt Wasting (CSW)


CSW refers to changes in renal salt handling that accompanies CNS disorders which leads to natriuresis and hypovolemia. The accompanying dehydration and decrease in effective circulating volume triggers ADH release via baroreceptors. The action of ADH on collecting tubules then leads to selective water resorption and relative water excess and hyponatremia despite overall hypovolemia. The putative renal natriuretic triggers include atrial natriuretic peptide (ANP), brain natriuretic peptide (BNP), and c-type natriuretic peptide. In TBM the most likely natriuretic trigger is BNP (91). What induces BNP release in patients with TBM is less well characterized. The putative mechanisms that trigger BNP release include sympathoadrenal activation, increase in intracranial pressure, and vasospasm in cerebral arteries (92). In patients with CNS TB statistically CSW is more likely to be the cause of hyponatremia and should always be ruled out prior to labelling them as SIAD and starting fluid restriction. A simple diagnostic criterion proposed by Kalita et al (86) includes meeting all the 3 essential criteria and meeting at least 3 out of 5 additional supportive criteria to label the patient has having CSW. Table 5 lists the clinical and biochemical differences between SIAD and CSW.


Essential Criteria (meets all three)

  1. Polyuria (>3 liters of urine in 24 hours over 2 days)
  2. Documented hyponatremia
  3. Exclusion of other cause of natriuresis like adrenal insufficiency, salt losing nephropathies, use of diuretics, hepatic and cardiac failure.


Additional criteria (meet 3 out of 5)

  1. Clinical evidence of hypovolemia and dehydration
  2. Documented negative fluid balance either by careful weight monitoring or by strict intake and output records
  3. Urine spot Sodium > 40 mEq/L
  4. Central Venous Pressure (CVP) < 6 cm of water
  5. Laboratory evidence of dehydration including an increase in hemoglobin and hematocrit, increase in blood urea nitrogen and increase in albumin than previously.


Table 5. Differentiation Between Syndrome of Inappropriate Anti-Diuresis (SIAD) and Cerebral Salt Wasting (CSW)

Parameter

SIAD

CSW

Extracellular Volume

Increased

Decreased

Body Weight

Increased

Decreased

Fluid Balance

Positive

Negative

Tachycardia

-

+

Hypotension

-

+

Hematocrit/Albumin/Blood Urea Nitrogen

Normal

Increased

Central Venous Pressure

Normal or slightly high

Decreased


TREATMENT OF CSW ASSOCIATED WITH TBM


The primary treatment for CSW is fluid replacement with or without oral salt loading for as long as polyuria continues. Isotonic fluids are preferred for replacement. If the patient has a central venous line then the central venous pressure (CVP) measurements would guide the fluid replacements. In the absence of a CVP line fluid balance is needed by either meticulous intake and output charting or use of daily weight measurements.


In patient’s refractory to fluid replacement and oral salt loading, oral fludrocortisone (OFC) has been tried as there is an inhibition of the renin-angiotensin-aldosterone system (RAAS) system in CSW. A recent randomized control trial was conducted in 36 patients with CSW associated with TBM. Half of them received OFC (0.4-1mg/day) plus fluid and oral salt and the other half received only fluids and oral salt. The patients who received OFC in addition had quicker normalization of serum sodium levels (4 days vs 15 days; p 0.04) and lesser cerebral infarctions related to vasospasm (6% vs 33%; p 0.04). However, OFC use was associated with severe hypokalemia and significant hypertension in 2 patients each and in one patient there was an episode of pulmonary edema. OFC had to be withdrawn in 2/18 patients because of these serious adverse events. There was no difference in mortality or disability at 3 and 6 months among patients who received OFC vs the patients who did not (93).


CALCIUM ABNORMALITIES IN TUBERCULOSIS


Hypercalcemia in Patients with Tuberculosis


Hypercalcemia has been known to be associated with a number of granulomatous diseases. The three commonest granulomatous diseases causing hypercalcemia include sarcoidosis, TB, and fungal infection (94). The prevalence of hypercalcemia in patients with TB has ranged from 2-51% in studies done from South Africa (2%), Hong Kong (6%), India (10.6%), Sweden (25%), Malaysia (27.5%), Greece (25% & 48%) and Australia (51%) (13, 95-101). In contrast, prospective studies from the United Kingdom, Belgium, and Turkey did not show any hypercalcemia among patients with newly diagnosed tuberculosis (102-104). The primary determinant in the development of hypercalcemia among patients with TB appears to be their Vitamin D status and nutritional calcium intake. In populations with high nutritional calcium intake and adequate sunlight exposure like in Greece and Australia the prevalence of hypercalcemia is highest. Among countries with good sunlight exposure but poor nutritional calcium intake like most Asian countries there is a more modest prevalence of hypercalcemia. The countries with good nutritional calcium intake but poor sunlight exposure and low Vitamin D levels appear to have the lowest prevalence of hypercalcemia. This has been elegantly explained by Chan et al (105). However, some outliers like the higher prevalence in Sweden and moderate prevalence in India are not completely explained by this hypothesis alone.


In a recent paper looking at retrospective records of patients admitted with TB at a tertiary care hospital in Vellore almost 20% of patients were found to have albumin-adjusted hypercalcemia. The authors looked at the risk factors for hypercalcemia by comparing them with the patients without hypercalcemia assuming that background nutritional calcium intake and Vitamin D levels were similar. The primary risk factors for the development of hypercalcemia within this group was presence of renal dysfunction or frank renal failure, use of diuretics, disseminated tuberculosis, and presence of co-morbidities like diabetes and hypertension (106).


MECHANISM OF HYPERCALCEMIA WITH TUBERCULOSIS


The definitive mechanism that causes hypercalcemia among patients with TB is still unclear. Alternative etiologies for hypercalcemia including adrenal insufficiency, primary hyperparathyroidism, primary hyperthyroidism, milk alkali syndrome have been ruled out in many of the case series. Biochemically several investigators have shown an increase in the levels of 1,25-dihydroxy vitamin D along with low or normal levels of 25-hydroxy vitamin D levels. This suggests an increase in the conversion of 25-hydroxy vitamin D to 1,25-dihydroxy vitamin D (107). This conversion is mediated by the enzyme 1-α-hydroxylase found in the kidney. However, hypercalcemia is even reported in patients with chronic renal failure and among those with absent kidneys (108, 109). This suggests a non-renal site of enzymatic activity. 


The tubercular granuloma is suggested as the site for the extra renal 1-α-hydroxylase activity (110). Activated macrophages can express 1-α-hydroxylase activity and in patients with active TB activated macrophages retrieved by broncho-alveolar lavage were able to synthesize 1,25 dihydroxy vitamin D in vitro studies (111). The macrophage production of 1-α-hydroxylase is probably important for the immune response to tuberculous infection. The binding of active Vitamin D (1,25-dihydroxy vitamin D) to Vitamin D receptors within the immune cells stimulates autophagy and production of cytokines that contribute to the clearance of the mycobacterium from the body (112, 113). In addition, active Vitamin D contributes to the downregulation of the inflammatory response of the body to reduce damage to bystander host tissues (114). The increased intestinal absorption of calcium and observed hypercalcemia may be an unintended consequence of this immune-protective phenomenon.


This also explains why patients with low levels of substrate (25-hydroxy vitamin D) for the enzyme or among those with poor calcium intake there is less likelihood of the development of hypercalcemia.


CLINICAL PRESENTATION


Most patients with hypercalcemia related to TB infection are asymptomatic. Rarely patients develop symptoms related to hypercalcemia including polyuria, anorexia, nausea, weakness and lethargy, more serious CNS symptoms like delirium.


Patients may develop hypercalcemia later in the course of TB after commencement of therapy with improvements in nutritional and albumin status and improvement in nutritional calcium intake. 


TREATMENT


A Cochrane review of Vitamin D supplementation in patients with TB did not show any benefits in terms of improved outcomes but there was also no increased risk of developing hypercalcemia (115). Most patients have gradual resolution of hypercalcemia on ATT over 1 to 7 months (96).


Hypocalcemia in Patients Treated with Rifampicin and Isoniazid


Hypocalcemia was noted for the first time in United Kingdom during a randomized control trial of anti-tubercular chemotherapy after several months of therapy. Fourteen out of the 325 patients on the trial developed hypocalcemia. In this trial none of the 325 patients was noted to have hypercalcemia. On the whole as a group the mean calcium levels dropped significantly during the course of the treatment trial. The mechanism is proposed to be the action of both Rifampicin and Isoniazid on vitamin D metabolism (102).


When isoniazid is given to normal subjects there is a brisk decline in the levels of active Vitamin D (1,25 dihydroxy vitamin D). There is slower decline in the levels of 25-hydroxy vitamin D accompanied by a compensatory increase in the levels of parathyroid hormones. In the same study isoniazid was shown to inhibit cytochrome p450 related hepatic mixed function oxidase and it is assumed that since the renal 1-α Hydroxylase is also related to cytochrome P450 system there would be decreased conversion of 25-hydroxy vitamin D to 1,25 dihydroxy vitamin D (116).


On the other hand, rifampicin is an inducer of hepatic hydroxylase which should in theory lead to an increase in active Vitamin D levels. However, when rifampicin was given to normal volunteers there was a fall in 25-hydroxy vitamin D levels with no changes to the levels of 1,25-dihydroxy vitamin D. The possible explanation for this decline is likely to be that the higher metabolic turnover of active Vitamin D induced by rifampicin is not compensated by an increase in dermal production or increased nutritional provision of vitamin D (117). Regardless, in treatment regimens that include both rifampicin and isoniazid there is a very real possibility of the development of not just hypocalcemia but unmasking of rickets and osteomalacia especially when the patient is poorly nourished.


CONCLUSIONS


TB can involve almost all endocrine glands as a primary disease-causing destruction and loss of function. In enclosed spaces like the pituitary fossa and neck the granuloma/tuberculoma/cold abscess can replace vital structures and cause symptoms related to a mass. This chapter did not cover direct tubercular involvement of the ovaries, testes, and the pancreas.


Additionally, a whole range of functional hormone abnormalities can accompany the effect on chronic inflammation on the immune-endocrine pathways. Metabolic derangement in calcium and water metabolism are covered in detail. Abnormalities in glucose metabolism are not covered because of the vast amount of information now available on the public health aspects of TB and diabetes mellitus.


Fortunately, most abnormalities are self-limited and resolve with successful ATT. However, one needs to consider the rare possibility of a hormonal emergency like an adrenal crisis, hypercalcemic emergency, or pituitary apoplexy in the context of TB.


REFERENCES


  1. World Health Organization. Global Tuberculosis Report 2020. https://apps.who.int/iris/bitstream/handle/10665/336069/9789240013131-eng.pdf (Accessed 28 Nov 2020)
  2. Lyon SM, Rossman MD. Pulmonary tuberculosis. Microbiol Spectr (2017) 5:TNMI7–0032. doi: 10.1128/microbiolspec.TNMI7-0032-2016
  3. Ndlovu H, Marakalala MJ. Granulomas and inflammation: host-directed therapies for tuberculosis. Front Immunol (2016) 7:434.
  4. Besedovsky H, del Rey A. Immune-neuro-endocrine interactions: facts and hypothesis. Endocr Rev (1996) 17:64–95. doi:10.1210/edrv-17-1-64
  5. Turnbull AV, Rivier CL. Regulation of the hypothalamic-pituitary-adrenal axis by cytokines: actions and mechanisms of action. Physiol Rev (1999) 79:1–71
  6. Straub RH, Schuld A, Mullington J, Haack M, Schölmerich J, Pollmächer T. The endotoxin-induced increase of cytokines is followed by an increase of cortisol relative to dehydroepiandrosterone (DHEA) in healthy male subjects. J Endocrinol (2002) 175:467–74.
  7. Auphan N, DiDonato JA, Rosette C, Helmberg A, Karin M. Immunosuppression by glucocorticoids: inhibition of NFκB activity through induction of IκB synthesis. Science (1995) 270:286–90.
  8. Pandolfi J, Baz P, Fernández P, Discianni Lupi A, Payaslián F, Billordo LA, et al. Regulatory and effector T-cells are differentially modulated by dexamethasone. Clin Immunol (2013) 149:400–10.
  9. van Lettow M, van der Meer JWM, West CE, van Crevel R, Semba RD. Interleukin-6 and human immunodeficiency virus load, nut not plasma leptin concentration, predict anorexia and wasting in adults with pulmonary tuberculosis in Malawi. J Clin Endocrinol Metab (2005) 90:4771–6.
  10. Kellendonk C, Eiden S, Kretz O, Schütz G, Schmidt I, Tronche F, et al. Inactivation of the GR in the nervous system affects energy accumulation. Endocrinology (2002) 143:2333–40.
  11. Plata-Salaman CR. Central nervous system mechanisms contributing to the cachexia-anorexia syndrome. Nutrition (2000) 16:1009–12.
  12. D’Attilio L, Santucci N, Bongiovanni B, Bay ML and Bottasso O (2018) Tuberculosis, the Disrupted Immune-Endocrine Response and the Potential Thymic Repercussion as a Contributing Factor to Disease Physiopathology. Front. Endocrinol. 9:214.
  13. Post FA, Soule SG, Willcox PA, Levitt NS. The spectrum of endocrine dysfunction in active pulmonary tuberculosis. Clin Endocrinol (Oxf). 1994 Mar;40(3):367-71.
  14. Slavin RE, Walsh TJ, Pollack AD. Late generalized tuberculosis: a clinical pathologic analysis and comparison of 100 cases in the preantibiotic and antibiotic eras. Medicine (Baltimore). 1980 Sep;59(5):352-66.
  15. Guttman P. Addison’s disease: A statistical analysis of 566 cases and a study of pathology. Arch Pathol 1930; 10:742-5.
  16. Sanford JP, Favour CB. The interrelationships between Addison's disease and active tuberculosis: a review of 125 cases of Addison's disease. Ann Intern Med. 1956 Jul;45(1):56-72.
  17. Betterle C, Morlin L. Autoimmune Addison’s Disease. Endocr Dev 2011; 20:171-72.
  18. Agarwal G, Bhatia E, Pandey R, Jain SK. Clinical profile and prognosis of Addison's disease in India. Natl Med J India. 2001 Jan-Feb;14(1):23-5.
  19. Soule S. Addison's disease in Africa--a teaching hospital experience. Clin Endocrinol (Oxf). 1999 Jan;50(1):115-20.
  20. Roy A, Bhattacharjee R, Goswami S, Thukral A, Chitra S, Chakraborty PP, et al. Evolving adrenal insufficiency. Indian J Endocr Metab 2012;16:S367-70.
  21. Alvarez S, McCabe WR. Extrapulmonary tuberculosis revisited: a review of experience at Boston City and other hospitals. Med 1984;63:25-55.
  22. Huang YC, Tang YL, Zhang XM, Zeng NL, Li R, Chen TW. Evaluation of primary adrenal insufficiency secondary to tuberculous adrenalitis with computed tomography and magnetic resonance imaging: Current status. World J Radiol 2015;28:336-42.
  23. Maitra A. The endocrine system. In: Kumar V, Abbas AK, Aster AC, editors. Robbins and Cotran Pathologic Basis of Disease. Philadelphia; Elsevier. 9th edition. 2015. P. 1073-139.
  24. Vinnard C, Blumberg EA. Endocrine and metabolic aspects of tuberculosis. Microbiol Spectr 2017;5:1-19.
  25. Chhangani NP, Sharma P. Addison’s disease. Indian Ped 2003; 40:904-5.
  26. Sharma S, Joshi R, Kalelkar R, Agrawal P. Tuberculous adrenal abscess presenting as adrenal insufficiency in a 4-year-old boy. J Tropical Ped 2018;0:1-4.
  27. Bancos I, Hahner S, Tomlinson J, Arlt W. Diagnosis and management of adrenal insufficiency. Lancet Diabetes Endocrinol 2015:3;216-26.
  28. Herndon J, Nadeau AM, Davidge-Pitts CJ, Young WF, Bancos I. Primary adrenal insufficiency due to bilateral infiltrative disease. Endocrine 2018;62:721-8.
  29. Erichsen MM, Lovas K, Skinningsrud B, Wolff AB, Undlien DE, Svatberg J, et al. Clinical, immunological, and genetic features of autoimmune primary adrenal insufficiency: observations from a Norwegian registry. J Clin Endocrinol Metab 2009;94:4882-4890.
  30. Nair A, Jayakumari C, George GS, Jabbar PK, Das DV, Jessy SJ, Aneesh TS. Long acting porcine sequence ACTH in the diagnosis of adrenal insufficiency. Eur J Endocrinol. 2019 Dec;181(6):639-645.
  31. Lam KY, Lo CY. A critical examination of adrenal tuberculosis and a 28-year autopsy experience of active tuberculosis. Clin Endocrinol 2001;54:633-9.
  32. Friedman F. The pathology of the adrenal gland in Addison’s disease with special reference to adrenocortical contraction. J name to be found 1948;42:181-200.
  33. Annear TD, Baker GP. Tuberculous Addison’s disease. A case apparently cured by chemotherapy. Lancet 1961;2:577-8.
  34. Penrice J, Nussey SS. Recovery of adrenocortical function following treatment of tuberculous Addison’s disease. Postgrad Med J 1992;68:204-5.
  35. Kelestimur F. Recovery of adrenocortical function following treatment of tuberculous Addison’s disease. Postgrad Med J 1993;69:832-4.
  36. Bulbuloglu E, Ciralik H, Okur E, Ozdemir G, Ezberci F, Cetinkaya A. Tuberculosis of the thyroid gland: review of the literature. World J Surg 2006;30:149-55.
  37. Rankin FW, Graham AS. Tuberculosis of the thyroid gland. Ann Surg 1932;94:625-48.
  38. Das DK, Pant CS, Chachra KL, Gupta AK. Fine needle aspiration cytology diagnosis of tuberculous thyroiditis. A report of eight cases. Acta Cytol 1992;36:517-22.
  39. Mondal A, Patra DK. Efficacy of fine needle aspiration cytology in the diagnosis of tuberculosis of the thyroid gland: a study of 18 cases. J Laryngol Otol 1995;109:36-8.
  40. Gupta N, Sharma K, Barwad A, Sharma M, Rajwanshi A, Dutta P, et al. Thyroid tuberculosis – role of PCR in diagnosis of a rare entity. Cytopathol 2011;22:392-6.
  41. Ozekinci S, Mizrak B, Saruhan G, Senturk S. Histopathologic diagnosis of thyroid tuberculosis. Thyroid 2009;19:983-6.
  42. Akbulut S, Sogutcu N, Arikanoglu Z, Bakir S, Ulku A, Yagmur Y. Thyroid tuberculosis in Southeastern Turkey: is this the resurgence of a stubborn disease? World J Surg 2011;35:1847-52.
  43. Majid U, Islam N. Thyroid tuberculosis: a case series and a review of the literature. J Thyroid Res 2011;vol?:1-4. doi:10.4061/2011/359864
  44. Luiz HV, Pereira BD, Silva TN, Veloza A, Matos A, Matos C, et al. Thyroid tuberculosis with abnormal thyroid function – case report and review of the literature. Endocr Pract 2013;19:e44-e49.
  45. Barnes P, Weatherstone R. Tuberculosis of the thyroid: two case reports. Br J Dis Chest 1979;73:187-91.
  46. Kang BC, Lee SW, Shim SS, Choi HY, Baek SY, Cheon YJ. US and CT findings of tuberculosis of the thyroid: three case reports. Clin Imaging 2000;24:283-6.
  47. Madhusudhan KS, Seith A, Khadgawat R, Das P, Mathur S. Tuberculosis of the thyroid gland: magnetic resonance imaging appearances. Singapore Med J 2009;50:e235-e238.
  48. El Malki HO, El Absi M, Mohsine R…. Tuberculosis of the thyroid. Diagnosis and treatment. Ann Chir 2002;127:385-7.
  49. Chow CC, Mak TW, Chan CH, Cockram CS. 1995. Euthyroid sick syndrome in pulmonary tuberculosis before and after treatment. Ann Clin Biochem 32:385–391.
  50. Christensen HR, Simonsen K, Hegedus L, Hansen BM, Dossing M, Kampmamn JP, et al. Influence of rifampicin on thyroid gland volume, thyroid hormones, and antipyrine metabolism. Acta Endocrinol (Copenh). 1989; 121: 406–410.
  51. Kim HI, Kim TH, Kim H, Kim YN, Jang HW, Chung JH, et al. (2017) Effect of Rifampin on Thyroid Function Test in Patients on Levothyroxine Medication. PLoS ONE 12(1): e0169775
  52. Munkner T. Studies on goiter due to para-aminosalicylic acid. Scand J Respir Dis. 1969;50(3):212-26.
  53. Chhabra N, Gupta N, Aseri M L, Mathur SK, Dixit R. Analysis of thyroid function tests in patients of multidrug resistance tuberculosis undergoing treatment. J Pharmacol Pharmacother 2011;2:282-5
  54. Munivenkatappa S, Anil S, Naik B, et al. Drug-Induced Hypothyroidism during Anti-Tuberculosis Treatment of Multidrug-Resistant Tuberculosis: Notes from the Field. Journal of Tuberculosis Research. 2016 Sep;4(3):105-110.
  55. Letchworth TW. Tuberculoma of the pituitary body. Br Med J 1924;1127.
  56. Kirshbaum JD, Levy HA. Tuberculoma of hypophysis with insufficiency of anterior lobe: a clinical and pathological study of two cases. Arch Intern Med 1941;68:1095-104.
  57. Ben Abid F, Abukhattab M, Karim H, Agab M, Al-Bozom I, Ibrahim WH. Primary pituitary tuberculosis revisited. Am J Case Rep 2017;18:391-4.
  58. Sunil K, Menon R, Goel N, Sanghvi D, Bandgar T, Joshi SR, et al. Pituitary tuberculosis. J Assoc Physicians India 2007;55:453-6.
  59. Dutta P, Bhansali A, Singh P, Bhat MH. Suprasellar tubercular abscess presenting as panhypopituitarism: a common lesion in an uncommon site with a brief review of literature. Pituitary 2006;6:73-7.
  60. Sharma MC, Arora R, Mahapatra AK, Sarat-Chandra P, Gaikwad SB, Sarkar C. Intrasellar tuberculoma – an enigmatic pituitary infection: a series of 18 cases. Clin Neurol Neurosurg 2000;102:72-7.
  61. Cellen S, Whittaker E, Eisenhut M, Grandjean L. Cerebral tuberculomas in a 6-year-old girl causing central diabetes insipidus. BMJ Case Rep 2018. DOI: 10.1136/bcr-2018-226590.
  62. Dayal D, Muthuvel B, Sodhi KS. Obesity as the presenting feature of sellar-suprasellar tuberculoma. Indian J Endocr Metab 2018;22:176-7.
  63. Srisukh S, Tanpaibule T, Kiertiburanakul S, Boongird A, Wattanatranon D, Panyaping T, et al. Pituitary tuberculoma: a consideration in the differential diagnosis in a patient manifesting with pituitary apoplexy-like syndrome. ID Cases 2016;5:63-6.
  64. Roka YB, Roka N, Pandey SR. Primary pituitary tubercular abscess: a case report. J Nepal Med Assoc 2019;57:206-8.
  65. Mittal P, Dua S, Saggar K, Gupta K. Magnetic resonance findings in sellar and suprasellar tuberculoma with hemorrhage. Surg Neurol Int 2010;1:73.
  66. Saini KS, Patel AL, Shaikh WA, Magar LN, Pungaonkar SA. Magnetic resonance spectroscopy in pituitary tuberculoma. Singap Med J 2007;48:783-6.
  67. Doknic M, Miljic D, Pekic S, Stojanovic M, Savic D, Manojlovic-Gacic E, et al. Single center study of 53 consecutive patients with pituitary stalk lesions. Pituitary 2018. DOI: 10.1007/s11102-018-0914-2.
  68. Agrawal VM, Giri PJ. Tuberculosis: a common infection with rare presentation, isolated sellar tuberculoma with panhypopituitarism. J Neurosci Rural Pract 2019;10:327-30.
  69. Antony G, Dasgupta R, Chacko G, Thomas N. Pituitary tuberculoma with subsequent drug-resistant tuberculous lymphadenopathy: an uncommon presentation of a common disease. BMJ Case Rep 2017.
  70. Dhanwal DK, Vyas A, Sharma A, Saxena A. Hypothalamic pituitary abnormalities in tubercular meningitis at the time of diagnosis. Pituitary 2010;13:304-10.
  71. Mohammed H, Goyal MK, Dutta P, Sharma K, Modi M, et al. Hypothalamic and pituitary dysfunction is common in tubercular meningitis: A prospective study from a tertiary care center in Northern India. J Neurol Sci. 2018 Dec 15;395:153-158.
  72. More A, Verma R, Garg RK et al. A study of neuroendocrine dysfunction in patients of tuberculous meningitis. J Neurol Sci. 2017 Aug 15;379:198-206.
  73. Lam KS, Shamm MM, Tam SC, Ng MM, Ma HT. Hypopituitarism after tuberculous meningitis in childhood. Ann Intern Med1993; 118:701-6.
  74. Chung DK, Hubbard WW. 1969. Hyponatremia in untreated active pulmonary tuberculosis. Am Rev Respir Dis 99:595–597.
  75. Morris CD, Bird AR, Nell H. 1989. The haematological and biochemical changes in severe pulmonary tuberculosis. Q J Med 73:1151–1159
  76. Jonaidi Jafari N, Izadi M, Sarrafzadeh F, Heidari A, Ranjbar R, Saburi A. 2013. Hyponatremia due to pulmonary tuberculosis: review of 200 cases. Nephrourol Mon 5:687–691
  77. Dash M, Sen RK, Behera BP, Sahu SS. Prevalence of hyponatremia in pulmonary tuberculosis. Int J Adv Med 2020;7:63-6.
  78. Khan K, Rasool N, Mustafa F, Tariq R. Hyponatremia Due to Pulmonary Tuberculosis in Indian Population. Int J Sci Stud 2017;5(5):98-101.
  79. Chaya BE, Rajesh KN, Mohan K, Mahesh DM. Hyponatremia in tuberculosis: Focus on brain instead of adrenals. Neurol India 2018;66:1515-6.
  80. Weiss H, Katz S. Hyponatremia resulting from apparently inappropriate secretion of antidiuretic hormone in patients with pulmonary tuberculosis. Am Rev Respir Dis. 1965 Oct;92(4):609-16.
  81. Anderson RJ, Pluss RG, Berns AS, Jackson JT, Arnold PE, Schrier RW, McDonald KE. 1978. Mechanism of effect of hypoxia on renal water excretion. J Clin Invest 62:769–777.
  82. Hill AR, Uribarri J, Mann J, Berl T. 1990. Altered water metabolism in tuberculosis: role of vasopressin. Am J Med 88:357–364.
  83. Lee P, Ho KK. 2010. Hyponatremia in pulmonary TB: evidence of ectopic antidiuretic hormone production. Chest 137:207–208.
  84. Roca B, Tornador N, Tornador E. 2008. Presentation and outcome of tuberculous meningitis in adults in the province of Castellon, Spain: a retrospective study. Epidemiol Infect 136:1455–1462.
  85. Misra UK, Kalita J, Bhoi SK, Singh RK. A study of hyponatremia in tuberculous meningitis. J Neurol Sci. 2016 Aug 15; 367:152-7.
  86. Misra UK, Kalita J and Tuberculous Meningitis International Research Consortium. Mechanism, spectrum, consequences and management of hyponatremia in tuberculous meningitis [version 1; peer review: 2 approved] Wellcome Open Research 2019, 4:189 https://doi.org/10.12688/wellcomeopenres.15502.1 (accessed November 2020)
  87. Cotton MF, Donald PR, Schoeman JF, Aalbers C, Van Zyl LE, Lombard C. 1991. Plasma arginine vasopressin and the syndrome of inappropriate antidiuretic hormone secretion in tuberculous meningitis. Pediatr Infect Dis J 10:837–842.
  88. Inamdar P, Masavkar S, Shanbag P. Hyponatremia in children with tuberculous meningitis: A hospital-based cohort study. J Pediatr Neurosci. 2016;11(3):182-187.
  89. Singh BS, Patwari AK, Deb M: Serum sodium and osmolal changes in tuberculous meningitis. Indian Pediatr. 1994; 31(11): 1345–50.
  90. Cotton MF, Donald PR, Schoeman JF, Van Zyl LE, Aalbers C, Lombard CJ. 1993. Raised intracranial pressure, the syndrome of inappropriate antidiuretic hormone secretion, and arginine vasopressin in tuberculous meningitis. Childs Nerv Syst 9:10–15.
  91. Berendes E, Walter M, Cullen P, et al.: Secretion of brain natriuretic peptide in patients with aneurysmal subarachnoid haemorrhage. Lancet. 1997; 349(9047): 245–59.
  92. Lenhard T, Külkens S, Schwab S: Cerebral salt-wasting syndrome in a patient with neuroleptic malignant syndrome. Arch Neurol. 2007; 64(1): 122–25
  93. Misra UK, Kalita J, Kumar M: Safety and Efficacy of Fludrocortisone in theTreatment of Cerebral Salt Wasting in Patients with Tuberculous Meningitis: A Randomized Clinical Trial. JAMA Neurol. 2018; 75(11): 1383–91.
  94. Jacobs TP, Bilezikian JP. Clinical review: Rare causes of hypercalcemia. J Clin Endocrinol Metab. 2005 Nov;90(11):6316-22.
  95. Shek CC, Natkunam A, Tsang V, Cockram CS, Swaminathan R. Incidence, causes and mechanism of hypercalcaemia in a hospital population in Hong Kong. Q J Med. 1990 Dec;77(284):1277-85.
  96. Sharma SC. Serum calcium in pulmonary tuberculosis. Postgrad Med J. 1981 Nov;57(673):694-6.
  97. Lind L, Ljunghall S. Hypercalcemia in pulmonary tuberculosis. Ups J Med Sci. 1990;95(2):157-60
  98. Liam CK, Lim KH, Srinivas P, Poi PJ. Hypercalcaemia in patients with newly diagnosed tuberculosis in Malaysia. Int J Tuberc Lung Dis. 1998 Oct;2(10):818-23.
  99. Kitrou MP, Phytou-Pallikari A, Tzannes SE, Virvidakis K, Mountokalakis TD. Hypercalcemia in active pulmonary tuberculosis. Ann Intern Med. 1982 Feb;96(2):255.
  100. Roussos A, Lagogianni I, Gonis A, Ilias I, Kazi D, Patsopoulos D, Philippou N. Hypercalcaemia in Greek patients with tuberculosis before the initiation of anti-tuberculosis treatment. Respir Med. 2001 Mar;95(3):187-90.
  101. Need AG, Phillips PJ, Chiu F, Prisk H. Hypercalcaemia associated with tuberculosis. Br Med J. 1980 Mar 22;280(6217):831.
  102. A controlled trial of six months chemotherapy in pulmonary tuberculosis. First Report: results during chemotherapy. British Thoracic Association. Br J Dis Chest. 1981 Apr;75(2):141-53.
  103. Keleştimur F, Güven M, Ozesmi M, Paşaoğlu H. Does tuberculosis really cause hypercalcemia? J Endocrinol Invest. 1996 Nov;19(10):678-81.
  104. Fuss M, Karmali R, Pepersack T, Bergans A, Dierckx P, Prigogine T, Bergmann P, Corvilain J. Are tuberculous patients at a great risk from hypercalcemia? Q J Med. 1988 Nov;69(259):869-78.
  105. Chan TY. Differences in vitamin D status and calcium intake: possible explanations for the regional variations in the prevalence of hypercalcemia in tuberculosis. Calcif Tissue Int. 1997 Jan;60(1):91-3.
  106. John SM, Sagar S, Aparna JK, Joy S, Mishra AK. Risk factors for hypercalcemia in patients with tuberculosis. Int J Mycobacteriol 2020;9:7-11
  107. Abbasi AA, Chemplavil JK, Farah S, Muller BF, Arnstein AR. Hypercalcemia in active pulmonary tuberculosis. Ann Intern Med. 1979 Mar;90(3):324-8.
  108. Felsenfeld AJ, Drezner MK, Llach F. Hypercalcemia and elevated calcitriol in a maintenance dialysis patient with tuberculosis. Arch Intern Med. 1986 Oct;146(10):1941-5.
  109. Gkonos PJ, London R, Hendler ED. Hypercalcemia and elevated 1,25-dihydroxyvitamin D levels in a patient with end-stage renal disease and active tuberculosis. N Engl J Med. 1984 Dec 27;311(26):1683-5.
  110. Isaacs RD, Nicholson GI, Holdaway IM. Miliary tuberculosis with hypercalcaemia and raised vitamin D concentrations. Thorax. 1987 Jul;42(7):555-6.
  111. Cadranel J, Garabedian M, Milleron B, Guillozo H, Akoun G, Hance AJ. 1,25(OH)2D2 production by T lymphocytes and alveolar macrophages recovered by lavage from normocalcemic patients with tuberculosis. J Clin Invest. 1990 May;85(5):1588-93.
  112. Facchini L, Venturini E, Galli L, de Martino M, Chiappini E. 2015. Vitamin D and tuberculosis: a review on a hot topic. J Chemother 27:128–138.
  113. Rockett KA, Brookes R, Udalova I, Vidal V, Hill AV,Kwiatkowski D. 1998. 1,25-Dihydroxyvitamin D3 induces nitric oxide synthase and suppresses growth of Mycobacterium tuberculosis in a human macrophage like cell line. Infect Immun 66:5314–5321.
  114. Coussens AK, Wilkinson RJ, Hanifa Y, et al. 2012. Vitamin D accelerates resolution of inflammatory responses during tuberculosis treatment. Proc Natl Acad Sci U S A 109: 15449–15454.
  115. Sinclair D, Abba K, Grobler L, Sudarsanam TD. Nutritional supplements for people being treated for active tuberculosis. Cochrane Database Syst Rev. 2011 Nov 9;(11):CD006086.
  116. Brodie MJ, Boobis AR, Hillyard CJ, et al: Effect of Isoniazid on vitamin D metabolism and hepatic monooxygenase activity. Clin Pharmacol Ther 1981; 30:363-370.

Brodie MJ, Boobis AR, Dollery CT, et al: Rifampicin and vitamin D metabolism. Clin Pharmacol Ther 1980; 27:810-814.

Pituitary Diseases in the Tropics

ABSTRACT


The pituitary gland is the master controller of the hormonal axes in the body and modulates its hormonal output based on the information received from the hypothalamus and the peripheral target organs. The traditional feedback hormonal loop involving the central and peripheral organs is termed the hypothalamo-pituitary-target organ axis. Pituitary disorders may present either due to the structural or hormonal manifestations. Pituitary disorders often have a long gestation period before their clinical identification. The commonest pituitary disorders include functional and non-functional adenomas and hypopituitarism. In this chapter, we shall discuss the pituitary disorders encountered in the tropical countries along with their unique features and management.


INTRODUCTION


The pituitary gland is the fulcrum of the entire hormonal axes in the human body and is located in the sella turcica of the temporal bone. The pituitary gland is divided into anterior and posterior portions connected by an intermediary lobe. The anterior pituitary secretes growth hormone (GH), thyroid stimulating hormone (TSH), adrenocorticotrophic hormone (ACTH), luteinizing hormone (LH), follicle stimulating hormone (FSH), and prolactin. Vasopressin and oxytocin are the two hormones released from the posterior pituitary. The common pituitary disorders in endocrine practice include prolactinoma, acromegaly, Cushing’s disease, non-functional pituitary adenoma (NFPA), and hypopituitarism. Hypopituitarism denotes either complete or partial deficiency of pituitary hormones. The etiologies that lead to hypopituitarism are classified as congenital, neoplastic, and inflammatory diseases (1). Pituitary dysfunction in tropical countries is observed due to specific etiologies as shown in table 1. In the subsequent sections, we shall discuss the individual disorders.


Table 1. Pituitary Diseases of the Tropics

Gynecological- Sheehan’s syndrome, Pseudocyesis

Environmental- Snake envenomation, Heat stroke, Traumatic brain injury

Infections- Tuberculosis, Toxoplasmosis, Pneumocystis, Cytomegalovirus, Aspergillosis, Candida

Miscellaneous- Hemochromatosis, Steroid abuse


SHEEHAN’S SYNDROME


Harold Sheehan described this syndrome in 1937 as post-partum pituitary necrosis (2). It is a common cause of pituitary insufficiency in tropical countries where obstetric care is not well advanced. In a study from India, the prevalence of Sheehan’s syndrome (SS) is reported to be 3% in women above 20 years of age and according to this study two third of SS patients had undergone home delivery (3).  This might be a tip of the iceberg as the majority of cases go unrecognized because of the long lag period between the primary insult and clinical presentation and the significant number of unreported home deliveries (4). Post-partum hemorrhage (PPH) is the initiating event which triggers the cascade of pituitary necrosis as shown in the figure 1.

Figure 1. Etiopathogenesis of Sheehan’s Syndrome

Pathogenesis


The pituitary is a highly vascularized organ and is very vulnerable to ischemic insults secondary to a fall in mean arterial pressure. PPH is the primary insult which leads to hypotension and compromised blood flow to pituitary, leading to irreversible necrosis and deficiencies of various pituitary hormones. The pituitary gland increases in size during pregnancy and its location inside the sellar compartment makes it susceptible to ischemic insults. Other factors which aid in the progression of SS are disseminated intravascular coagulation, mutation in various coagulant factors like factor II and V, vasospasm, multiparity, advanced maternal age, and autoimmunity. Lactotrophs and somatotrophs are located laterally and are commonly affected in comparison to medially located corticotrophs and thyrotrophs (4). Anti-pituitary (APA) and anti-hypothalamus antibodies (AHA) are seen in patients with SS even many years after the primary insult. It is postulated that necrosed pituitary cells exposes various antigens to which these antibodies develop and subsequently leads to autoimmune damage (5). The various risk factors for the development of SS are summarized in the table 2.


Table 2. Predisposing Factors for Sheehan’s Syndrome

Anatomical

Physiological

Obstetrical

Miscellaneous

Small sella turcica

Pituitary enlargement

Coagulation disorders

Prothrombotic states

Vasospasm

Postpartum bleed

Home deliveries

Advanced age

Multiparity

Autoimmunity


Clinical Presentation


Patients with SS can have an acute, subacute, or chronic presentation and symptoms in SS are related to the underlying pituitary hormone deficiencies. Usually a lag period between the primary insult to first presentation is in the range of 7-19 years. However, SS may present as an acute catastrophic event immediately after delivery which can be associated with a high mortality. Acute SS may present as emergency in the form of myxedema coma, severe hyponatremia, adrenal crisis, and hypoglycemia coma. Failure of lactation, inability to resume menstrual cycles, and loss of secondary sexual characteristics in the background of PPH should raise suspicion of SS.  Figure 2 summarizes various clinical features of SS. It is also important to understand that about 10% of patients with SS may remain asymptomatic and about 50% of patients may have nonspecific signs and symptoms eluding clinical diagnosis. Diabetes Insipidus is a rare phenomenon in SS. In chronic SS, clinical examination reveals the loss of axillary and pubic hair, breast atrophy, wrinkling around the eyes and mouth, and features of hypothyroidism (4).


Figure 2. Clinical Features of Sheehan’s Syndrome (SS)

In appropriate clinical settings, SS syndrome is diagnosed by detecting variable degrees of pituitary hormone deficiencies. Dynamic stimulation testing might be required for diagnosing SS. Hyponatremia is commonly seen in SS and its occurrence is explained by multiple factors like hypothyroidism, hypocortisolemia, and increased anti-diuretic hormone secretion as a result of decreased mean arterial pressure. On sellar imaging an empty sella is a hallmark finding in SS. Complete and partial empty sellars is seen in about 70-75% and 20 – 25% of patients with SS respectively. In acute SS, pituitary might be enlarged with features suggestive of necrosis on neuroimaging. Rarely, patients with SS can have a normal pituitary on imaging (6). Lymphocytic hypophysitis may present similarly and the differentiating features between the two conditions are summarized in table 3.


Table 3. Differences Between Sheehan’s Syndrome and Lymphocytic Hypophysitis

Sheehan’s syndrome

Lymphocytic hypophysitis

Women in postpartum period affected

Women, men, & children can be affected

Post-partum hemorrhage common hence seen in developing countries

Common in affluent nations

Lactation failure present

No lactation failure

Other autoimmune disorders not common

Can be associated with other autoimmune disorders

    PRL, TSH, GH

 ACTH, FSH, LH are affected late

  ACTH, TSH,    PRL

Normal GH, FSH, LH

DI rare

DI common

Empty sella on imaging

Enhancing pituitary mass may progress to empty sella, thick stalk

PRL, prolactin; TSH, thyroid stimulating hormone; GH, growth hormone; ACTH, adrenocorticotrophic hormone; FSH, follicular stimulating hormone; LH, luteinizing hormone; DI, diabetes insipidus


Management


In acute SS syndrome, intravenous glucocorticoids, thyroid hormone replacement, and fluid resuscitation constitutes the main treatment. It is important to keep in mind that thyroid hormone replacement should not be done without testing for the adequacy of the pituitary adrenal axis. Long term management is guided by diagnosing the specific endocrine deficits and replacement for these abnormalities. Besides glucocorticoid and thyroxine, the patient may require sex steroids, growth hormone, and desmopressin therapy. At appropriate intervals, patients should be screened for malignancies and bone health (7).


SNAKE ENVENOMATION AND PITUITARY DYSFUNCTION


The World Health Organization (WHO) has included snake bite in the priority list of neglected tropical diseases. About 85,000–138,000 deaths occur per year all over the world as a result of snake envenomation and more than 75 percent of these deaths happen in tropical countries. About 10 percent of people who survive snake envenomation develop pituitary dysfunction. Pituitary dysfunction is more common with vasculotoxic snakes like Russel’s viper (8). The exact prevalence of hypopituitarism following snake bite is not known because the majority of these bites occur in countries where the reporting system of snake bite is not robust. Somatotrophs and corticotrophs are frequently affected and patients may present in an acute or chronic stage with various signs and symptoms of hypopituitarism. Kidney injury and disseminated intravascular coagulation (DIC) are postulated to be predictors of hypopituitarism following snake bite. Pituitary imaging may show a spectrum of findings ranging between a completely normal pituitary to an empty sella (9).


Figure 3 illustrates the pathophysiology of hypopituitarism in snake bites. Vasculotoxic snake bites lead to a capillary leak syndrome which causes pituitary swelling and initiation of DIC. Increased capillary permeability also exposes various pituitary antigens and leads to the development of various antibodies which further damages pituitary cells. Vasculotoxic snake venom also has a direct stimulatory effect on pituitary cells and can result in damage. Circulatory collapse further leads to pituitary ischemia and finally hypopituitarism (10).

Figure 3. Pathogenesis of Hypopituitarism in Snake Bites

Hypopituitarism following snake bites can present as early as 24 hrs to as late as 24 years. Patients may present acutely with adrenal crisis or chronically with non-specific signs and symptoms. Deficiency of growth hormone and cortisol are common and central diabetes insipidus is rare after snake bite induced hypopituitarism (11). Appropriate hormonal replacement remains the mainstay of treatment.


POST TRAUMATIC PITUTARY DYSFUNCTION


In India it is reported that about 405 deaths and 1290 injuries happen as a result of road traffic accidents every day. Out of these accidents, two thirds occur in individuals between 15-44 years of age and a significant number of these patients are left with various disabilities (12). Post traumatic hypopituitarism is described after various injuries ranging from mild to severe or even with repeated injuries. Post traumatic hypopituitarism is believed to be responsible for about 7.2% of all causes of hypopituitarism and can develop after road traffic accidents, sports injuries, blast injuries, and other trauma. In the acute phase of post traumatic brain injury, pituitary dysfunction is seen in as high as two thirds of patients (13).


Events and pathogenesis of post traumatic hypopituitarism is described in figure 4.  As described in the pathogenesis of SS, pituitary vasculature has a unique propensity for ischemic insult. Autoimmunity is also postulated to play a part in the pathogenesis of post traumatic hypopituitarism. It is believed that as a result of trauma there is disruptions of the blood brain barrier and there is exposure to various hypothalamic and pituitary antigens. Anti-pituitary antibodies and anti-hypothalamic antibodies have been demonstrated by various authors many years after the primary injury. It has also been reported that patients who does not have anti-pituitary antibodies have a higher chance of recovery of pituitary functions within 5 years (14). The role of varied expression of miRNA and the protective role of apolipoprotein E3 have also been described.  Somatotrophs and gonadotrophs are first affected by ischemic damage and centrally located corticotrophs and thyrotropes are preserved (13).

Figure 4. Pathogenesis of Post Traumatic Hypopituitarism

The diagnosis of post traumatic hypopituitarism can be difficult because of the non-specific signs and symptoms, impaired cognition, and difficulty to carry out dynamic tests. Patients may have varied presentations like neuropsychiatric manifestations, dementia, altered body fat distribution, and altered metabolic profile. Neuroimaging may show brain contusions, skull fractures, diffuse axonal injuries, diffuse brain swelling, decreased pituitary volume, and even empty sella. Various authors have reported that diffuse brain swelling, skull fractures, axonal injury are predictors of post traumatic hypopituitarism (13). Appropriate hormonal replacement is the mainstay of treatment and pituitary functions revert back to normal within 5 years in a significant number of patients (15).


PITUITARY INFECTIONS


Pituitary infections are considered to be a rare in usual practice. However, in tropical countries it can pose a great challenge especially when there is no clinical suspicion. Of all the infections, mycobacterium tuberculosis is a frontrunner in causing pituitary dysfunction. Pituitary insufficiency is reported in children with tubercular meningitis and hyperprolactinemia and adrenal insufficiency was common abnormalities (16). There are a large number of people living with human immunodeficiency virus (HIV) and pituitary infections with cytomegalovirus and toxoplasma gondii can be seen in some of these patients. Immunocompromised patients can also develop pituitary abscesses and the posterior pituitary is commonly affected as it receives its blood supply directly from the systemic circulation. Aspergillus, candida albicans, and pneumocystis jiroveci are common organisms incriminated in pituitary abscesses. The endocrine abnormalities seen most often are DI, hyperprolactinemia, and hypogonadism. On neuroimaging a pituitary abscess may present as parasellar mass (17). Tertiary syphilis can rarely infect the pituitary. The infected pituitary can develop pituitary dysfunction as result of chronic ischemia which leads to necrosis (1).


MISCELLANEOUS CONDITIONS


Pseudocyesis describes a clinical condition in which a woman who is not pregnant, presents with a strong conviction of being pregnant along with the associated signs and symptoms mimicking a true pregnancy state. Though pseudocyesis has been recognized since antiquity, the hormonal changes have been studied in the recent decades. The disease is rarely reported in developed countries but is fairly common in tropical countries, especially Africa, where childbearing is considered as essential for women to live with respect. A notable example of this condition was Mary Tudor, the first queen of England, who believed that God did not bless her with a child because of the harsh punishments given by her to the protestants. In this disorder women of child bearing age develops raised prolactin and LH levels (16). Quack therapies are commonly practiced in tropical countries and steroids are the main constituents of such forms of therapies which leads to suppression of the hypothalamic pituitary axis (18). Heat injuries are common in tropical countries and pituitary dysfunction has been reported in heat related injuries. Heat stress is considered to damage somatotrophs and corticotrophs (19). Hemochromatosis is a condition with excess deposition of iron in tissues leading to functional consequences. Hypopituitarism has been reported frequently in patients with hemochromatosis and this is often exaggerated in tropical countries due to poor chelation therapy (20).


CONCLUSION


Pituitary disorders in the tropics have certain unique etiologies that include Sheehan’s syndrome, snake-bite, and certain infectious disorders. A high index of clinical suspicion is required to identify the underlying condition in the absence of typical clinical features. The evaluation and management of the hypopituitarism is akin to other etiologies. Improved obstetric care has resulted in a reduced prevalence of Sheehan’s syndrome. Close monitoring and lifelong hormone replacement therapy as deemed necessary are the cornerstones of the therapy to reduce the associated morbidity and mortality. 


REFERENCES


  1. Hypopituitarism - Endotext [Internet]. [cited 2021 Feb 12]. Available from: https://www.endotext.org/chapter/hypopituitarism-2/
  2. Sheehan HL. Post-partum necrosis of the anterior pituitary. J Pathol Bacteriol. 1937 Jul 1;45(1):189–214.
  3. Zargar AH, Singh B, Laway BA, Masoodi SR, Wani AI, Bashir MI. Epidemiologic aspects of postpartum pituitary hypofunction (Sheehan’s syndrome). Fertil Steril. 2005 Aug;84(2):523–8.
  4. Karaca Z, Laway BA, Dokmetas HS, Atmaca H, Kelestimur F. Sheehan syndrome. Nat Rev Dis Prim. 2016 Dec 22;2(1):1–15.
  5. De Bellis A, Kelestimur F, Sinisi AA, Ruocco G, Tirelli G, Battaglia M, et al. Anti-hypothalamus and anti-pituitary antibodies may contribute to perpetuate the hypopituitarism in patients with Sheehan’s syndrome. Eur J Endocrinol. 2008 Feb 1;158(2):147–52.
  6. Diri H, Tanriverdi F, Karaca Z, Senol S, Unluhizarci K, Durak AC, et al. Extensive investigation of 114 patients with Sheehan’s syndrome: A continuing disorder. Eur J Endocrinol. 2014 Sep 1;171(3):311–8.
  7. Diri H, Karaca Z, Tanriverdi F, Unluhizarci K, Kelestimur F. Sheehan’s syndrome: new insights into an old disease. Vol. 51, Endocrine. Humana Press Inc.; 2016. p. 22–31.
  8. Suraweera W, Warrell D, Whitaker R, Menon G, Rodrigues R, Fu SH, et al. Trends in snakebite deaths in India from 2000 to 2019 in a nationally representative mortality study. Elife. 2020 Jul 1;9:1–37.
  9. Naik Bn, Bhalla A, Sharma N, Mokta J, Singh S, Gupta P, et al. Pituitary dysfunction in survivors of Russell’s viper snake bite envenomation: A prospective study. Neurol India. 2018 Sep 1;66(5):1351.
  10. Bhattacharya S, Krishnamurthy A, Gopalakrishnan M, Kalra S, Kantroo V, Aggarwal S, et al. Review article endocrine and metabolic manifestations of snakebite envenoming. Vol. 103, American Journal of Tropical Medicine and Hygiene. American Society of Tropical Medicine and Hygiene; 2020. p. 1388–96.
  11. Golay V, Roychowdhary A, Dasgupta S, Pandey R. Hypopituitarism in patients with vasculotoxic snake bite envenomation related acute kidney injury: A prospective study on the prevalence and outcomes of this complication. Pituitary. 2014 Apr 1;17(2):125–31.
  12. Pal R, Ghosh A, Kumar R, Galwankar S, Paul S, Pal S, et al. Public health crisis of road traffic accidents in India: Risk factor assessment and recommendations on prevention on the behalf of the Academy of Family Physicians of India. J Fam Med Prim Care. 2019;8(3):775.
  13. Hari Kumar KV, Swamy MN, Khan MA. Prevalence of hypothalamo pituitary dysfunction in patients of traumatic brain injury. Indian J Endocrinol Metab. 2016 Nov-Dec;20(6):772-778.
  14. Gilis-Januszewska A, Kluczyński Ł, Hubalewska-Dydejczyk A. Traumatic brain injuries induced pituitary dysfunction: a call for algorithms. Endocr Connect. 2020 May;9(5):R112–23.
  15. Tanriverdi F, De Bellis A, Ulutabanca H, Bizzarro A, Sinisi AA, Bellastella G, et al. A five year prospective investigation of anterior pituitary function after traumatic brain injury: Is hypopituitarism long-term after head trauma associated with autoimmunity? J Neurotrauma. 2013 Aug 15;30(16):1426–33.
  16. Dhanwal DK, Vyas A, Sharma A, Saxena A. Hypothalamic pituitary abnormalities in tubercular meningitis at the time of diagnosis. Pituitary. 2010 Dec;13(4):304–10.
  17. Yen SS, Rebar RW, Quesenberry W. Pituitary function in pseudocyesis. J Clin Endocrinol Metab. 1976 Jul;43(1):132-6.
  18. Kalra S, Khadilkar V, Dhanwal D. Hypopituitarism in the tropics. Indian J Endocrinol Metab. 2011;15(7):151.
  19. Mete F, Kilic E, Somay A, Yilmaz B. Effects of heat stress on endocrine functions & behaviour in the pre-pubertal rat. Indian J Med Res. 2012 Feb;135(2):233–9.

20.       Marx JJ. Pathophysiology and treatment of iron overload in thalassemia patients in tropical countries. Adv Exp Med Biol. 2

Environmental Endocrinology: An Expanding Horizon

ABSTRACT

Environment is an important determinant of endocrine health and certain endocrine disorders could also have a significant impact on the surroundings. Environmental endocrinology is an emerging field of medicine which encompasses the bidirectional impact of endocrine disorders and the physical, chemical, biological, and social environment of an individual. As we aim to improve endocrine health, it is also important to address the external environmental factors that may affect a given endocrine condition. As more data is emerging on this subject, it will help to formulate clinical practice guidelines and policies to optimize endocrine disorders in light of a given external environment.


INTRODUCTION

Environment with respect to health refers to all the physical, chemical and biological factors extrinsic to a person, even encompassing the related behavioral responses. The given surroundings can have a significant impact on an individual’s health and even health conditions can influence the environment over a period of time (1). Environmental health is an upcoming field and is referred to as the science and practice of preventing human illness while promoting wellbeing, by identifying and evaluating environmental changes. It further helps to identify and limit exposure to hazardous physical, chemical, and biological agents and thereby limiting their exposure to prevent adverse effects on human health (2). Multiple disciplines of medicine are involved in studying this field and research dealing with environmental health often has a direct impact on policy and practice. Amongst various organ systems that are impacted with environmental health, the endocrine system is maximally affected and very relevant in tropical countries (3, 4). This has been shown across different species and in humans across their life span (5-7). The environmental changes can even result in epigenetic alterations that may then transcend across generations (3, 8). In this chapter, we explore the bidirectional relationship of environment and the endocrine system and suggest a future road map for addressing the research gaps identified in this field (Figure 1).

Figure 1. Relationship of the environment and endocrine system

IMPACT OF ENVIRONMENT ON ENDOCRINOLOGY

The Influence of the Physical Environment on the Endocrine System

In the last century several nuclear disasters have happened from time to time. The impact of these on the endocrine system has widely been reported and is a classic example as to how the physical environment can affect the endocrine system (9-11). The unfortunate incidents in Fukushima and Chernobyl have led to a large amount of exposure of radioactive substances that have been released into the environment. In addition to their adverse effects on reproductive health and carcinogenesis, a considerable impact has been noted on many endocrine glands including the pituitary, thyroid and gonads (12).


Following the Chernobyl accident in 1986, it was noted that individuals living in the surrounding areas had a 50% lower sympathetic activity and a 36% lower adrenal cortical activity including a significantly lower blood cortisol level. They also were noticed to have increased hypophyseal-thyroid system dysfunction, higher incidence of goiter, and autoimmune thyroiditis (13). An increased level of thyroxine-binding globulin, lower concentrations of free T3, and an increased risk of non-toxic single nodular and multinodular goiters have been reported (14). On the other extreme, an increased secretion of gonadotropic hormones and accelerated sexual development in women was documented. Higher rates of juvenile diabetes were also noticed in those exposed to the radioactive substances. Higher levels of prolactin and renin, with lower progesterone levels have been documented (14).


A similar incidence was repeated in Fukushima in 2011, following a tsunami which caused extensive damage to the nuclear reactor situated there. Though the radiation amount released into the environment was relatively less, the exposure was to a significantly larger population (12). Multiple endocrine effects have also been described secondary to the radiation exposure followed by non-accidental deliberate nuclear weapon testing (15). These effects need to be proactively followed and documented as they have strong policy implications. 


Another important environmental health domain which has been of concern in recent times, is the health effects of forest fires. Apart from the multitude of environment related effects of vast forest fires, they also are known to affect the endocrine system (16). Polycyclic aromatic compounds (PACs), released during such forest fires are known endocrine disruptors with steroid like actions and their chronic exposure could affect the hypothalmo-pituitary-adrenal axis (17).


In addition to these the impact of built environment, limited areas for safe physical activity, and an increased number of fast-food outlets are responsible for an increasing prevalence of obesity in some developing countries (18).


Apart from these examples at the macro-environment level, the micro-environment could also have an impact on the endocrine system. A classic example to support this is hypogonadism in men caused by excessive use of sauna, hot tubs, Jacuzzis, heated car seats, and laptop use. The increased testicular temperature caused by excessive exposure to these activities can impair spermatogenesis (19, 20). Apart from direct effect of heat, excessive use of laptops and mobile phones also exposes the body to higher amount of radio frequency electromagnetic radiation, leading to multiple systemic effects including reduced spermatogenesis and increased blood pressure (21).


The Effect of Changes in the Chemical Environment on Endocrinology


Globally, the endocrine disruptor chemicals (EDCs) are the best-known examples of how the chemical environment can influence the endocrine system. EDCs are defined as exogenous chemicals that may alter any part of the endocrine system which may include interference in hormone synthesis, secretion, circulation, metabolism, receptor interaction, or elimination (22). Based on the site of their origin - EDC’s have been classified as industrial, residential, or agricultural. The common EDC’s used in industries include polychlorinated biphenyls (PCBs) and alkylphenols. Several pesticides, insecticide, herbicides, phytoestrogens, and fungicides that are used in farming are classified as agricultural and those used in household products like phthalates, polybrominated biphenyls, and bisphenol A are considered as residential (23). EDCs have gathered much interest in recent years and are known to affect several endocrine systems especially the gonadal axis (24). A brief summary has been provided in the table below.


Table 1. Endocrine disruptors affecting different endocrine organs

Endocrine system

Endocrine disruptor chemical

Impact

Pituitary

Phytoestrogens (i.e., isoflavonoids, cumestans, lignans, stilbens); pesticides (i.e., organophosphates, carbamates, organochlorines, synthetic pyrethroids); Polyvinyl chloride (PVC); phenols, dioxins, heavy metals, perfluorooctanoic acid.

Precocious puberty, delayed puberty, disruption of the circadian rhythm

Adrenal

Xenoestrogens, Hexachlorobenzene

Adrenal biosynthetic defects

Thyroid

Perchlorate, thiocyanates, nitrates

Hypothyroidism

Gonads

Phthalates, vinclozolin, acetaminophen, and polybrominated diphenyl ethers (PBDE)

Phthalates, diethylstilbestrol, bisphenol A (BPA)

PCB, phtalates, atrazine, genistein, BPA, parabens, triclosan, dichlorodiphenyltrichloroethane (DDT), and metoxychloride (MXC)

Phthalates, bisphenol A, biphenyls, and vinclozolin,

Testicular dysgenesis syndrome


Endometriosis


Female infertility


Male infertility

Endocrine gland cancer

PDBE, organochlorides, PCB, DDT, dichlorodiphenyldichloroethylene (DDE), arsenic, and cadmium

Triclocarban, PCB

PCB, dioxins, cadmium, phytoestrogens, DES, furans, ethylene oxide

Testicular Cancer


Thyroid Cancer

 Breast Cancer


In addition to EDC’s several other occupational exposures can also cause endocrine disorders. Exposure to cadmium in silversmiths, without proper personal protective equipment could lead to renal tubular acidosis and subsequent hypophosphatemic osteomalacia (25). Chronic exposure to fluoride through drinking water is known to produce a sclerotic bone disease associated with osteomalacia (26). Exposure to other heavy metals like copper has also been associated with different endocrine disorders as seen in Wilson’s disease (27, 28). Altered exposure to certain food items, may also lead to endocrine disorders. While exposure to cow milk and cassava has been associated with development of diabetes, deficiency of iodine containing sea foods in non-coastal areas is associated with the goiter (29, 30).


The Impact of Biological Changes in the Environment on the Endocrine Milieu


The most recent and a very lucid example of how the biological environment can affect the endocrine system, is that of COVID -19. It has been shown that COVID-19 can have a myriad of effects on different endocrine systems. However, the most pertinent of all has been its association with diabetes (31-33). Interestingly not only COVID-19 can affect diabetes control but presence of diabetes can also have a direct impact on the outcome of COVID-19 (Figure 2).

Figure 2. The bidirectional relationship between COVID-19 and Diabetes

Similar to COVID-19, there have been reports of other communicable diseases intersecting with non-communicable endocrine disorders. A few common examples that are cited in literature include presence of NAFLD (Nonalcoholic fatty liver disease) in individuals with HIV infection, the association of osteoporosis with Hepatitis B infection, cytomegalovirus associated with Paget’s disease of the bone etc. (34, 35).


Certain infections may also be responsible for hormonal deficiencies. An example is histoplasmosis that is predominantly spread by bat droppings can result in adrenal insufficiency. This along with adrenal tuberculosis is still the most common cause of primary Addison’s disease in tropical countries unlike the West where autoimmune adrenalitis is the foremost cause. Similar infective etiologies have also been described to cause hypophysitis and resulting hypopituitarism.


The after effects of a of vasculo-toxic snake bite on pituitary and other endocrine organs also comes under the domain of biological environment impacting the endocrine system.


The Aftermath of Changing Social Environment on the Endocrine System


The social environment can influence the endocrine system in several ways. One such impact that has been increasing in recent years, is an increase in road traffic accidents on highways with higher speed limits, leading to traumatic brain injury. This has been associated with both acute and chronic hypopituitarism. Though first described in 1918, it was initially thought to be a rare phenomenon, but over the years has been recognized with increasing frequency (36). It is currently reported in about one third of patients with a traumatic brain injury (37). However, in autopsy studies up to 86% have demonstrated pituitary injury following traumatic brain injury (38).


Social norms and religious customs may further have an impact on the endocrine system. From the impact of prolonged periods of fasting on glycemic control to being customarily clad in veils leading to vitamin D deficiency, several such examples have been cited in literature.


IMPACT OF ENDOCRINE DISORDERS ON ENVIROMENT


The Influence of Endocrine Disorders on the Physical Environment


Globally, a rapid increase in the prevalence of obesity has brought about changes in the physical environment ranging from furniture sizes in clinics to more weight friendly gymnasiums. Additionally, operation tables have now become more accommodative of higher weights (39).


Another endocrine disorder that has brought about significant changes in the physical environment is osteoporosis. With an increasing life expectancy and consequent increase in the aged population, there has been a remarkable increase in the prevalence and awareness of osteoporosis. Subsequent fall protective arrangements are in place in several public places and transport facilities (40). Separate priority lines have been made available in different areas where prolonged waiting may be required (41). Moreover, battery operated cars are provided for them in airports and railway stations.


The changes in the chemical environment secondary to endocrine disorders are predominantly due to deficiency of chemical substances leading to hormone deficiencies. Nutritional vitamin D deficiency and iodine deficiency thyroid disorders have led to a massive fortification campaign in several countries. The impact of both these supplementations have seen phenomenal success across different countries especially in the tropical region (42, 43).


In a recently published study from Ireland, it was found that almost two-thirds of the mean daily vitamin D intake of adults came from fortified foods like milk and bread. Though individually milk and bread only helped to meet about 30 and 50% of recommended daily allowance, fortifying both simultaneously could help in meeting 70% of the RDA. This shows the impact of how widespread vitamin D deficiency could be managed by altering the chemical environment of commonly available foods (42).


Along similar lines a high prevalence of iodine deficiency disorders a few decades ago, has driven the salt iodination movement in several countries. This is another example of how an endocrine disorder can lead to changes in the surrounding chemical environment. This has definitely resulted in a reduction in the prevalence of goiter in many countries (44, 45).


The Effect of Endocrine Disorders on the Biological Environment


The classic example of how endocrine disorders could change the biological environment of an individual is how presence of diabetes and obesity could alter the clinical course of COVID 19. It is now clear that the presence of these comorbidities could increase the severity, prolong hospitalization and even increase the mortality of COVID-19 infected individuals (31-33, 46).


Other biological disorders that could depend on the endocrine milieu of a person include hormone dependent cancers. Elevations of specific hormones that can increase the risk of certain cancers provide a good opportunity to provide novel therapeutic options that may help in the management the hormone sensitive tumors (47). The commonly cited examples of these hormone dependent tumors where the alteration in the hormone levels could affect the biological activity of these disorders include breast, ovarian, and prostate malignancies.


The Footprint of Endocrine Diseases on the Social Environment


The rapid increase in the prevalence of diabetes and obesity have changed the availability of different foods and beverages available in social gatherings and supermarkets. Now sugar free foods and drinks are available in every gathering, which was not commonly present a few decades ago. Moreover, fat free snacks, low calorie deserts, and high fiber food options have become the new norm in the current day society (48).


SUMMARY


Even though several examples of the bidirectional impact of environment and endocrine disorders are cited in this chapter, data on this subject are still emerging and more evidence is needed to precisely quantify its impact. This will enable future practice guidelines and polices to improve the quality of life of people affected with endocrine disorders by modifying their environment and also help in positively changing the physical, chemical, biological, and social environment with respect to a given endocrine disorder.


REFERENCES


  1. Kalra S 2020. Environmental endocrinology: Expanding spectrum, evolving science. JPMA. The Journal of the Pakistan Medical Association 70:2302-2303
  2. Meltzer GY, Watkins BX 2020 A Systematic Review of Environmental Health Outcomes in Selected American Indian and Alaska Native Populations.7:698-739
  3. Levitsky LL 2014 Endocrinology, epigenetics, and environment. Current opinion in endocrinology, diabetes, and obesity 21:28-29
  4. Wingfield JC 2008 Comparative endocrinology, environment and global change. General and comparative endocrinology 157:207-216
  5. 1989 Development of preimplantation embryos and their environment. Proceedings of a satellite symposium of the 8th International Congress of Endocrinology. Kyoto, Japan, July 14-16, 1988. Progress in clinical and biological research 294:1-474
  6. Choi JH, Yoo HW 2013 Control of puberty: genetics, endocrinology, and environment. Current opinion in endocrinology, diabetes, and obesity 20:62-68
  7. Wilson AE, Fair PA, Carlson RI, Houde M, Cattet M, Bossart GD, Houser DS, Janz DM 2019 Environment, endocrinology, and biochemistry influence expression of stress proteins in bottlenose dolphins. Comparative biochemistry and physiology. Part D, Genomics & proteomics 32:100613
  8. Kenny NJ, Quah S, Holland PW, Tobe SS, Hui JH 2013 How are comparative genomics and the study of microRNAs changing our views on arthropod endocrinology and adaptations to the environment? General and comparative endocrinology 188:16-22
  9. Goncharov NP, Katsiya GV, Kolesnikova GS, Dobracheva GA, Todua TN, Vax VV, Giwercman A, Waites GM 1998 Endocrine and reproductive health status of men who had experienced short-term radiation exposure at Chernobyl. International journal of andrology 21:271-276
  10. Foley TP, Límanová Z, Potluková E 2015 Medical Consequences of Chernobyl with Focus on the Endocrine System - Part 2. Casopis lekaru ceskych 154:287-291
  11. Foley TP, Jr., Límanová Z, Potluková E 2015 Medical consequences of Chernobyl with focus on the endocrine system: Part 1. Casopis lekaru ceskych 154:227-231
  12. Niazi AK, Niazi SK 2011 Endocrine effects of Fukushima: Radiation-induced endocrinopathy. Indian J Endocrinol Metab 15:91-95
  13. Vermiglio F, Castagna MG, Volnova E, Lo Presti VP, Moleti M, Violi MA, Artemisia A, Trimarchi F 1999 Post-Chernobyl increased prevalence of humoral thyroid autoimmunity in children and adolescents from a moderately iodine-deficient area in Russia. Thyroid : official journal of the American Thyroid Association 9:781-786
  14. 2009 Chernobyl: Consequences of the Catastrophe for People and the Environment. Annals of the New York Academy of Sciences 1181:vii-xiii, 1-327
  15. Simon SL, Bouville A 2015 Health effects of nuclear weapons testing. Lancet (London, England) 386:407-409
  16. Wallace SJ, de Solla SR, Head JA, Hodson PV, Parrott JL, Thomas PJ, Berthiaume A, Langlois VS 2020 Polycyclic aromatic compounds (PACs) in the Canadian environment: Exposure and effects on wildlife. Environmental pollution (Barking, Essex : 1987) 265:114863
  17. Wu WZ, Wang JX, Zhao GF, You L 2002 The emission soot of biomass fuels combustion as a source of endocrine disrupters. Journal of environmental science and health. Part A, Toxic/hazardous substances & environmental engineering 37:579-600
  18. Dixon BN, Ugwoaba UA 2020 Associations between the built environment and dietary intake, physical activity, and obesity: A scoping review of reviews.
  19. Sheynkin Y, Jung M, Yoo P, Schulsinger D, Komaroff E 2005 Increase in scrotal temperature in laptop computer users. Human reproduction (Oxford, England) 20:452-455
  20. Shefi S, Tarapore PE, Walsh TJ, Croughan M, Turek PJ 2007 Wet heat exposure: a potentially reversible cause of low semen quality in infertile men. International braz j urol : official journal of the Brazilian Society of Urology 33:50-56; discussion 56-57
  21. Adams JA, Galloway TS, Mondal D, Esteves SC, Mathews F 2014 Effect of mobile telephones on sperm quality: a systematic review and meta-analysis. Environment international 70:106-112
  22. Kabir ER, Rahman MS, Rahman I 2015 A review on endocrine disruptors and their possible impacts on human health. Environmental toxicology and pharmacology 40:241-258
  23. Monneret C 2017 What is an endocrine disruptor? Comptes rendus biologies 340:403-405
  24. Giwercman A, Giwercman YL 2000 Epidemiology of male reproductive disorders. In: Feingold KR, Anawalt B, Boyce A, Chrousos G, de Herder WW, Dungan K, Grossman A, Hershman JM, Hofland HJ, Kaltsas G, Koch C, Kopp P, Korbonits M, McLachlan R, Morley JE, New M, Purnell J, Singer F, Stratakis CA, Trence DL, Wilson DP eds. Endotext. South Dartmouth (MA): MDText.com, Inc. Copyright © 2000-2020, MDText.com, Inc.
  25. Paul J, Cherian KE, Thomas N, Paul TV 2020 Hypophosphataemic osteomalacia due to cadmium exposure in the silver industry. Occupational medicine (Oxford, England) 70:207-210
  26. Shetty S, Nayak R, Kapoor N, Paul TV 2015 An uncommon cause for compressive myelopathy. BMJ case reports 2015
  27. Kapoor N, Cherian KE, Sajith KG, Thomas M, Eapen CE, Thomas N, Paul TV 2019 Renal Tubular Function, Bone Health and Body Composition in Wilson's Disease: A Cross-Sectional Study from India.105:459-465
  28. Kapoor N, Shetty S, Thomas N, Paul TV 2014 Wilson's disease: An endocrine revelation. Indian J Endocrinol Metab 18:855-857
  29. Gottlieb S Early exposure to cows' milk raises risk of diabetes in high risk children: BMJ. 2000 Oct 28;321(7268):1040.
  30. Navarro S 2018 Chronic pancreatitis. Some important historical aspects. Gastroenterologia y hepatologia 41:474.e471-474.e478
  31. Sathish T, Kapoor N 2020 Proportion of newly diagnosed diabetes in COVID-19 patients: a systematic review and meta-analysis.
  32. Sathish T, Cao Y, Kapoor N 2020 Preexisting prediabetes and the severity of COVID-19. Primary care diabetes
  33. Sathish T, Cao Y, Kapoor N 2020 Newly diagnosed diabetes in COVID-19 patients. Primary care diabetes
  34. Kapoor N, Audsley J, Rupali P, Sasadeusz J, Paul TV, Thomas N, Lewin SR 2019 A gathering storm: HIV infection and nonalcoholic fatty liver disease in low and middle-income countries. Aids 33:1105-1115
  35. Sajith KG, Kapoor N, Shetty S, Goel A, Zachariah U, Eapen CE, Paul TV 2018 Bone Health and Impact of Tenofovir Treatment in Men with Hepatitis-B Related Chronic Liver Disease. Journal of clinical and experimental hepatology 8:23-27
  36. Cyran E 1918 Hypophysenschädigung durch schädelbasisfraktur. Dtsch Med Wochenschr 44:1261
  37. Lieberman SA, Oberoi AL, Gilkison CR, Masel BE, Urban RJ 2001 Prevalence of neuroendocrine dysfunction in patients recovering from traumatic brain injury. The Journal of clinical endocrinology and metabolism 86:2752-2756
  38. Richmond E, Rogol AD 2014 Traumatic brain injury: endocrine consequences in children and adults. Endocrine 45:3-8
  39. DeMaria EJ, Carmody BJ 2005 Perioperative management of special populations: obesity. The Surgical clinics of North America 85:1283-1289, xii
  40. Stevens JA, Olson S 2000 Reducing falls and resulting hip fractures among older women. MMWR. Recommendations and reports : Morbidity and mortality weekly report. Recommendations and reports 49:3-12
  41. Tannenbaum C, Mayo N, Ducharme F 2005 Older women's health priorities and perceptions of care delivery: results of the WOW health survey. CMAJ : Canadian Medical Association journal = journal de l'Association medicale canadienne 173:153-159
  42. McCourt A, McNulty BA, Walton J, O'Sullivan A 2020 Efficacy and safety of food fortification to improve vitamin D intakes of older adults. Nutrition (Burbank, Los Angeles County, Calif.) 75-76:110767
  43. Wang Z, Zang J, Shi Z, Zhu Z, Song J, Zou S, Jin W, Jia X, Guo C, Liu S 2019 Iodine status of 8 to 10 years old children within 20 years following compulsory salt iodization policy in Shanghai, China. Nutrition journal 18:63
  44. Gupta P, Raizada N, Giri S, Sharma AK, Goyal S, Jain N, Madhu SV 2020 Goiter Prevalence and Thyroid Autoimmunity in School Children of Delhi. Indian J Endocrinol Metab 24:202-205
  45. Isiklar Ozberk D, Kutlu R, Kilinc I, Kilicaslan AO 2019 Effects of mandatory salt iodization on breast milk, urinary iodine concentrations, and thyroid hormones: is iodine deficiency still a continuing problem? Journal of endocrinological investigation 42:411-418
  46. Sathish T, Kapoor N 2020 Normal weight obesity and COVID-19 severity: A poorly recognized link. Diabetes research and clinical practice:108521
  47. Ulm M, Ramesh AV, McNamara KM, Ponnusamy S, Sasano H, Narayanan R 2019 Therapeutic advances in hormone-dependent cancers: focus on prostate, breast and ovarian cancers. Endocrine connections 8:R10-r26
  48. de Oliveira Otto MC, Anderson CAM, Dearborn JL, Ferranti EP, Mozaffarian D, Rao G, Wylie-Rosett J, Lichtenstein AH 2018 Dietary Diversity: Implications for Obesity Prevention in Adult Populations: A Science Advisory From the American Heart Association. Circulation 138:e160-e168

Pancreatic Islet Function Tests

ABSTRACT


Objective: To describe testing indications and protocols for the evaluation of pancreatic islet function. Methods: A review of the literature and consensus guidelines concerning testing of pancreatic islet function was performed. Results: Indications for screening for diabetes mellitus are reviewed. Diagnostic criteria for diagnosis are fasting plasma glucose ≥ 126 mg/dl (7.0 mmol/l) or random glucose ≥200 mg/dl (11.1 mmol/l) with hyperglycemic symptoms, hemoglobin A1c (HbA1c) ≥6.5%, and oral glucose tolerance testing (OGTT) 2-h glucose ≥200 mg/dl (11.1 mmol/l) after 75 g of glucose. One-step and two-step strategies for diagnosing gestational diabetes using pregnancy-specific criteria as well as use of the 2-h 75-g OGTT for the postpartum testing of women with gestational diabetes (4-12 weeks after delivery) are described. Testing for other forms of diabetes with unique features are reviewed, including the recommendation to use the 2-h 75 g OGTT to screen for cystic fibrosis-related diabetes and post-transplantation diabetes, fasting glucose test for HIV positive individuals, and genetic testing for monogenic diabetes syndromes including neonatal diabetes and maturity-onset diabetes of the young (MODY). Elevated measurements of pancreatic islet autoantibodies (e.g., to the 65-KDa isoform of glutamic acid decarboxylase (GAD65), tyrosine phosphatase related islet antigen 2 (IA-2), insulin (IAA), and zinc transporter (ZnT8)) suggest autoimmune type 1 diabetes (vs type 2 diabetes). IAA is primarily measured in youth. The use of autoantibody testing in diabetes screening programs are recommended only in first degree relatives of an individual with type 1 diabetes or in research protocols. C-peptide measurements >3 years after clinician diagnosis of type 1 diabetes in adults can be helpful in identifying those who have type 1 diabetes (low or undetectable c-peptide) from those who may have type 2 or monogenic diabetes. Use of OGTTs to examine insulin secretory reserve and intravenous glucose tolerance testing are also reviewed. These tests are primarily used in research studies. Evaluation of glycemic control is discussed, with special attention to hemoglobin A1c (HbA1c) and its correlation with mean blood glucose levels as well as assays of other glycated serum proteins. Finally, protocols used to evaluate hypoglycemia (glucose < 55 mg/dl (3.1 mmol/l)) are described, such as the supervised prolonged fast, during which measurements of glucose, insulin, c-peptide, oral insulin secretagogues, proinsulin, and beta-hydroxybutyrate are obtained. Insulinoma is suggested by elevated insulin, proinsulin and c-peptide levels, beta-hydroxybutyrate < 2.7 mmol/l, and undetectable insulin secretagogues. Use of a modified OGTT in the evaluation of the dumping syndrome is also described, as are the mixed meal test, glucagon tolerance test, c-peptide suppression test and evaluation of autoimmune hypoglycemia.


SCREENING FOR DIABETES MELLITUS AND PREDIABETES


Early detection and treatment of diabetes mellitus is important in preventing the chronic and acute complications of this disease. Individuals with symptoms suggestive of hyperglycemia, such as polyuria, polyphagia, polydipsia, unexplained weight loss, blurred vision, excessive fatigue, or infections or wounds that heal poorly should be promptly tested.


The American Diabetes Association (ADA) recommends routinely screening for type 2 diabetes in adults every three years beginning at age 45. In asymptomatic people, testing for type 2 diabetes should be considered in adults of any age if they are overweight or obese (BMI ≥ 25 kg/m2, or ≥ 23 kg/m2 if Asian), planning pregnancy, and/or if they have additional risk factors as listed below in Table 1. Repeat screening should be performed at least every three years. Patients with prediabetes should be screened yearly (1). The US Preventive Services Task Force recommends glucose screening for all asymptomatic overweight or obese adults ages 40-70 (2); the American Association of Clinical Endocrinologists recommends screening at risk individuals at any age (3).

Table 1. Risk Factors for the Development of Type 2 Diabetes (1)

Physical inactivity

First-degree relative with diabetes

High-risk race/ethnicity (e.g., African American, Latino, Native American, Asian American, Pacific Islander)

Women who delivered a baby weighing >9 lb. or were diagnosed with Gestational Diabetes

Hypertension (≥140/90 mm Hg or on therapy for hypertension)

HDL cholesterol level <35 mg/dL (0.90 mmol/L) and/or a triglyceride level >250 mg/dL (2.82 mmol/L)

Women with polycystic ovary syndrome

HbA1C ≥5.7%, Impaired Glucose Tolerance (IGT), or Impaired Fasting Glucose (IFG) on previous testing

Other clinical signs or conditions associated with insulin resistance (e.g., severe obesity, acanthosis nigricans)

History of cardiovascular disease

HIV


Type 2 diabetes is becoming a growing problem in children and adolescents in high-risk populations. To address this issue, the ADA recommends screening overweight [body mass index (BMI) ≥85th percentile] or obese (BMI ≥95th percentile) youth at least every 3 years, beginning at age 10 or at the onset of puberty, if they have 1 or more additional risk factors listed below in Table 2. Repeat testing should be done more frequently if BMI is increasing (1).

Table 2.  Risk Factors for Type 2 Diabetes in Children and Adolescents

Family history of type 2 diabetes (first and second-degree relatives)

High risk ethnicity (Native Americans, African-Americans, Latino, Asian/Pacific Islanders)

Signs of or conditions associated with insulin resistance (acanthosis nigricans, hypertension, dyslipidemia, small-for-gestational-age birth weight, or polycystic ovary syndrome)

Maternal history of diabetes or gestational diabetes during child's gestation


DIAGNOSING DIABETES AND PREDIABETES


The diagnosis of diabetes can be made using the fasting plasma glucose, random plasma glucose, oral glucose tolerance test, or hemoglobin A1c (HbA1c) (1). Testing should be performed on 2 separate days using one or more of the above tests, unless unequivocal hyperglycemia is present. Alternatively, in the absence of symptoms of hyperglycemia, diabetes can be diagnosed if there are two different abnormal test results from the same sample (1).


HbA1c


The use of the HbA1c assay was recommended for the diagnosis of diabetes in 2009 by an International Expert Committee (4). HbA1c levels reflect overall glycemic control and correlate with the development of microvascular complications. An HbA1c ≥ 6.5% on two separate occasions can be used to diagnose diabetes. An HbA1c level of 6.0% to less than 6.5% identifies high risk of developing diabetes. The ADA considers individuals with a HbA1c of 5.7% to 6.4% at increased risk for developing diabetes (1). HbA1c should not be used to diagnose gestational diabetes, diabetes in HIV positive individuals, post-organ transplantation, or in people with cystic fibrosis.

Table 3.  ADA Criteria for the Diagnosis of Diabetes (1)

HbA1C ≥6.5%. The test should be performed in a laboratory using a method that is National Glycohemoglobin Standardization Program certified and standardized to the Diabetes Control and Complications Trial (DCCT) assay.

FPG ≥126 mg/dL (7.0 mmol/L). Fasting is defined as no caloric intake for at least 8 h.

2-h plasma glucose ≥200 mg/dL (11.1 mmol/L) during an Oral Glucose Tolerance Test (OGTT). The test should be performed as described by the WHO, using a glucose load containing the equivalent of 75 g anhydrous glucose dissolved in water.

In a patient with classic symptoms of hyperglycemia or hyperglycemic crisis, a random plasma glucose ≥200 mg/dL (11.1 mmol/L) without repeat testing for confirmation.


Fasting and Random Plasma Glucose


Fasting plasma glucose is one method recommended by the ADA for the diagnosis of diabetes in children and non-pregnant adults (1). The test should be performed after an 8 hour fast. For routine clinical practice, fasting plasma glucose may be preferred over the oral glucose tolerance test because it is rapid, easier to administer, is more convenient for patients and providers, and has a lower cost (1). A random plasma glucose level, which is obtained at any time of the day regardless of the time of the last meal, can also be used in the diagnosis of diabetes in a patient with classic symptoms of hyperglycemia or hyperglycemic crisis.

Table 4.  Fasting Plasma Glucose Criteria


Fasting Plasma Glucose

Normal glucose tolerance

<100 mg/dl (5.6 mmol/l)

Impaired fasting glucose (pre-diabetes)

100-125 mg/dl (5.6-6.9 mmol/l)

Diabetes mellitus

≥126 mg/dl (7.0 mmol/l)


For the diagnosis of diabetes, standard venous plasma glucose specimens should be obtained. Specimens should be processed promptly, since glucose is metabolized at room temperature. This process is influenced by storage temperature, storage time as well as other factors, and is accelerated in the presence of bacteria or leukocytosis.


Whole blood glucose specimens obtained with point-of-care devices should not be used for the diagnosis of diabetes because of the inaccuracies associated with these methods. Capillary and venous whole blood glucose concentrations are approximately 15% lower than plasma glucose levels in fasting specimens.


Oral Glucose Tolerance Test (OGTT)


OGTTS FOR THE DIAGNOSIS OF DIABETES AND IMPAIRED GLUCOSE TOLERANCE IN NON-PREGNANT INDIVIDUALS


Formal oral glucose tolerance tests can be used to establish the diagnosis of diabetes mellitus. They are more cumbersome and costlier than the fasting plasma glucose test, however, the use of only the fasting plasma glucose may not identify a proportion of individuals with impaired glucose tolerance or diabetes (5). A plasma glucose level 2-hours after a glucose challenge may identify additional individuals with abnormal glucose tolerance who are at risk for microvascular and macrovascular complications, particularly in high-risk populations in which postprandial (versus fasting) hyperglycemia is evident early in the disease (6,7).


When using an OGTT, the criteria for the diagnosis of diabetes is a 2 h glucose >200 mg/dl (11.1 mmol/l) after a 75-gram oral glucose load (ADA and WHO criteria). The 75-gram glucose load should be administered when the patient has ingested at least 150 grams of carbohydrate for the 3 days preceding the test and after an overnight fast. Dilution of the 75-gram oral glucose load (300-900 ml) may improve acceptability and palatability without compromising reproducibility (8). The patient should not be acutely ill or be taking drugs that affect glucose tolerance at the time of testing, and should abstain from tobacco, coffee, tea, food, alcohol and vigorous exercise during the test.

Table 5.  Oral Glucose Tolerance Test Glucose Criteria


2-h Plasma Glucose (after 75-gram Glucose Load)

Normal glucose tolerance

<140 mg/dl (7.8 mmol/l)

Impaired glucose tolerance(pre-diabetes)

140-199 mg/dl (7.8-11.1 mmol/l)

Diabetes mellitus

≥200 mg/dl (11.1 mmol/l)


OGTTS FOR THE DIAGNOSIS OF GESTATIONAL DIABETES


The prevalence of gestational diabetes (GDM) varies among racial and ethnic groups and between screening practices, testing methods, and diagnostic criteria. The overall frequency of GDM in the 15 centers participating in the Hyperglycemia and Adverse Pregnancy Outcome (HAPO) Study was 17.8% (9), and regional estimates may vary from 10% to 25 % depending on the population studied (10). The prevalence increases with increased number of risk factors, such that 33% of women with 4 or more risk factors have gestational diabetes (11). This condition is important to diagnose early because of the increased perinatal morbidity associated with poor glycemic control.


The US Preventive Task Force recommends screening for gestational diabetes in asymptomatic women after 24 weeks (12); the ADA recommends screening all pregnant women routinely between 24- and 28-weeks’ gestation. If the woman has risk factors, however, screening should be performed at the initial prenatal visit using standard criteria (1).

Table 6.  Risk Factors for the Development of Gestational Diabetes

Overweight or obese

Previous history of impaired glucose tolerance, gestational diabetes, or delivery of a baby weighing >9 lb.

Glycosuria or history of abnormal glucose tolerance

Family history of diabetes (especially first degree relative)

Polycystic ovarian syndrome, hypertension, glucocorticoid use

History of poor obstetric outcome

Age (>25 years)

High risk ethnicity

Multiple gestation


Table 7.  Low Risk for the Development of Gestational Diabetes

Age (< 25 years)

Normal weight pre-pregnancy

Low risk ethnicity

No first-degree relatives with diabetes

No history of abnormal glucose tolerance

No history of poor obstetric outcome


Table 8.  Time of Initial Testing for Gestational Diabetes

Risk of Development of Gestational Diabetes

Time of Initial Testing for Gestational Diabetes

Low risk

24-28 weeks gestation

Average risk

24-28 weeks gestation

High risk

As soon as feasible; repeat at 24-28 weeks if earlier testing normal


More than one method has been recommended for the screening and diagnosis of gestational diabetes. The criteria for the diagnosis of this condition remain controversial because the glucose thresholds for the development of complications in pregnancies with diabetes remain poorly defined. Currently, the ADA suggests screening for GDM with either the “one-step” or “two-step” approach (1). Long term outcome studies evaluating pregnancies complicated by GDM are currently underway and hopefully a uniform approach will be adopted.


One-Step Strategy


The International Association of Diabetes and Pregnancy Study Group (IADPSG), an international consensus group with representatives from multiple obstetrical and diabetes organizations including the ADA recommend that all women not previously known to have diabetes undergo a 75-gram 2-hour OGTT at 24-28 weeks of gestation. This approach, which has been adopted internationally, is expected to increase the prevalence of GDM as only one abnormal value is sufficient to make the diagnosis (1,13). In 2017, the American College of Obstetricians and Gynecologists (ACOG) stated that clinicians may make the diagnosis of gestational diabetes based on only one elevated blood glucose value if warranted, based on their population, although this organization still supports the “two step” approach for diagnosis of GDM (14).

Table 9.  Oral Glucose Tolerance Test Glucose Criteria for the Diagnosis of GDM

75-gram 2- hour OGTT: Performed at 24-28 weeks gestation in the morning after an overnight fast of at least 8 hours

GDM is diagnosed when any of the following values are exceeded:

Fasting

≥ 92 mg/dL (5.1 mmol/L)

One Hour

≥ 180 mg/dL (10.0 mmol/L)

Two Hour

≥ 153 mg/dL (8.5 mmol/L)

These glucose thresholds were based on outcome data of the Hyperglycemia and Adverse Pregnancy Outcomes (HAPO) study that conveyed an odds ratio for adverse maternal, fetal and neonatal outcomes of at least 1.75 based on fully adjusted logistic regression models (15).

Two-Step Strategy 

The American College of Obstetricians and Gynecologists (ACOG) as well as the National Institutes of Health (NIH) have been in support of the "two step" approach which consists of universal screening of all pregnant women at 24-28 weeks gestation with a 50-gram glucose challenge regardless of timing of previous meals, followed by a 100-gram three-hour OGTT in screen positive patients (14, 16).


In the two-step approach, first a 50-gram oral glucose load is administered regardless of the timing of previous meals. The following thresholds have been defined as a positive screen: ≥130 mg/dL, ≥135 mg/dL, or ≥140 mg/dL (7.2 mmol/L, 7.5 mmol/L, or 7.8 mmol/L); the lower threshold has an estimated sensitivity and specificity of 88-99% and 66-77% compared to 70-88% and 69-89% respectively for the higher cutoff values of ≥135 mg/dL or ≥140 mg/dL (1).

Table 10.  Abnormal Glucose Level on Screening Test

50-gram Glucose Load

1-h Plasma Glucose

≥130 mg/dl (7.8 mmol/l)


If the screening test is abnormal, the diagnosis of gestational diabetes should be confirmed using a formal 100-gram OGTT. This test should be performed after an overnight (8-14 h) fast. It is generally recommended that the woman ingest at least 150 grams of carbohydrate/day for the 3 days prior to testing to prevent false positive results; however, the necessity of this preparatory diet in normally nourished women has been challenged (17). The ADA recommends using the Carpenter/Coustan criteria (1). At least 2 of the following 4 venous plasma glucose levels must be attained or exceeded to make the diagnosis of GDM (1).

Table 11.  Oral Glucose Tolerance Test Glucose Criteria for the Diagnosis of GDM


Carpenter/Coustan

National Diabetes Data Group

Fasting

≥95 mg/dl (5.3 mmol/l)

≥105 mg/dl (5.8 mmol/l)

One Hour

≥180 mg/dl (10.0 mmol/l)

≥190 mg/dl (10.6 mmol/l)

Two Hours

≥155 mg/dl (8.6 mmol/l)

≥165 mg/dl (9.2 mmol/l)

Three Hours

≥140 mg/dl (7.8 mmol/l)

≥145 mg/dl (8.1 mmol/l)


OGTTS FOR POSTPARTUM TESTING OF WOMEN WITH GESTATIONAL DIABETES

Women with a history of GDM are at a higher risk of developing type 2 diabetes than women without GDM (18,19). Women at the highest risk are those with multiple risk factors, those who had more severe gestational diabetes, and those with poorer beta cell function (11). The ADA recommends testing women 4-12 weeks after delivery using a two-hour 75-gram OGTT. Women with normal results should be retested at least every 3 years. It is recommended that women with impaired fasting glucose or impaired glucose tolerance be retested on a yearly basis (1).


Special Populations


Diabetes is common in patients with cystic fibrosis and is associated with adverse effects on nutritional status as well as pulmonary function. Annual screening for diabetes is recommended for individuals over age 10 with cystic fibrosis (1). HbA1c and fructosamine can be inaccurate in this population. In a retrospective analysis of the Toronto cystic fibrosis database, screening for diabetes using a HbA1c cutoff of 5.5% had a sensitivity of 91.8% and specificity of only 34.1% (20) but more studies need to be performed before the use of HbA1c is generally recommended for the diagnosis of diabetes in these individuals.


The use of the 2-hour 75 gm OGTT is recommended for the screening of healthy outpatients with cystic fibrosis. For patients receiving continuous drip feedings, laboratory glucose levels at the midpoint or immediately after feedings should be obtained. The diagnosis of diabetes is based on glucose levels ≥200 mg/dL on 2 separate occasions. If the patient is acutely ill or ingesting glucocorticoids, a FPG ≥126 mg/dL or 2-hour postprandial glucose ≥200 mg/dL that persists for >48 hours is sufficient to diagnose diabetes (21, 22). 


FASTING GLUCOSE FOR DIAGNOSIS OF PREDIABETES AND DIABETES IN PEOPLE LIVING WITH HIV


Screening for prediabetes and diabetes by measuring fasting glucose before and 3-6 months after starting or changing antiretroviral therapy is recommended for everyone living with HIV (1).  If normal, a fasting glucose test should be performed yearly.  Screening using a HbA1c test is not recommended for diagnosis due to risk of inaccuracies (1, 23). 


OGTTS FOR DIAGNOSIS OF POST-TRANSPLANTATION DIABETES


After an individual has had an organ transplant and is on stable immunosuppressive therapy, routine screening for diabetes is recommended.  The recommended screening test is an OGTT post- transplantation (1).


ESTIMATING INSULIN SENSITIVITY AND SECRETION


The hyperinsulinemic euglycemic insulin clamp procedure is the gold standard for measuring insulin resistance, and the hyperglycemic clamp is the gold standard for measuring insulin secretion.  These are only used in research studies. Fasting data and data from OGTTs are more often used due to ease of performance and lower cost. A simple widely used research method, the Homeostasis Model (HOMA), uses fasting glucose (G) and insulin (I) levels (or c-peptide (C) instead of insulin) to estimate beta cell function and insulin sensitivity. The HOMA calculator as well as additional information concerning this method can be found at: http://www.dtu.ox.ac.uk/homacalculator/. Insulin secretion has also been estimated using the Insulinogenic Index [IGI; ∆I30/∆G30] and the C-peptide Index (∆C30/∆G30). Additional estimates of insulin sensitivity include the Quantitative Insulin Sensitivity Check Index [QUICKI; 1/log(FI) + log (FG)] and the Whole-Body Insulin Sensitivity Index [WBISI]. The Oral Disposition Index is a measure of insulin secretion relative to insulin sensitivity [1/IFx (∆C30/∆G30)]. These measures are not used in routine clinical care.  A surrogate marker of insulin resistance is the lipid accumulation product (LAP) index, which uses information that can be obtained in routine clinical practice (24). It is calculated as follows: females (waist circumference-58) x (triglyceride [mmol/L]); males (waist circumference-68) x (triglyceride [mmol/L]).  The LAP cannot be used if triglycerides are >15 mmol/L.


Intravenous Glucose Tolerance Test


The short intravenous glucose tolerance test (IVGTT) is used in research studies to assess first phase insulin release. This acute insulin secretory response is typically lost early in the development of both type 1 and type 2 diabetes due to reduction of beta cells and islet cell dysfunction. Abnormal IVGTT results can occur prior to the onset of the diabetes. The test is performed after an overnight 10 h fast, and the patients are instructed to ingest at least 150 grams of carbohydrate for the 3 days preceding the test. A 25-gram glucose bolus (of a 25% glucose solution) is given intravenously, and the acute insulin response calculated from the third to fifth minute after the glucose bolus. The short intravenous glucose tolerance test is sometimes used to assess pancreatic function after pancreatic transplantation.


In the Diabetes Prevention Trial Type 1, a glucose load was given intravenously (0.5 g/kg body weight up to a maximum of 35 grams) over 3 minutes, and insulin levels at 1- and 3-minutes post-load were used to estimate acute insulin production (25). Individuals with low insulin response (<100 uU/ml) and positive autoantibodies were at high risk of developing type 1 diabetes. Until effective interventions are established, however, the routine use of this test for the detection of early type 1 diabetes is not recommended.


The standard intravenous glucose tolerance test is used in research studies to estimate insulin sensitivity (SI) and glucose effectiveness (SG) using minimal model methodology. The procedure for the standard intravenous glucose tolerance test is to intravenously inject glucose (0.33 g/kg body weight) over 2 minutes and to frequently sample for glucose and insulin over 3-4 hours. Modifications include the addition of a tolbutamide (125 mg/m2) or insulin (20-30 mU/kg) infusion 20-25 minutes after the glucose load. These tests are not used in clinical practice.


Additional information can be found in the chapter entitled “Assessing Insulin Sensitivity and Resistance in Humans” in the Diabetes or Endocrine Testing Protocol sections of Endotext.


C-Peptide Testing


During the processing of proinsulin to insulin in the beta cell of the pancreas, the 31 amino acid connecting peptide which connects the A and B chains, called c-peptide, is enzymatically removed and secreted into the portal vein. C-peptide circulates independently from insulin and is mainly excreted by the kidneys. Levels are elevated in renal failure. Standardization of different c-peptide assays is still suboptimal. C-peptide testing is used to examine insulin secretory reserve in people with diabetes.  Another important use of c-peptide measurements is in the evaluation of hypoglycemia, described below (see Section “Evaluation of Hypoglycemia”).

.

At the time of type 1 diabetes diagnosis, c-peptide levels commonly overlap with those observed in type 2 diabetes, and cannot reliably distinguish between these diabetes types. With longer duration, there is progressive loss of c-peptide, and although c-peptide levels in many individuals with long-standing type 1 diabetes are extremely low or undetectable, there is heterogeneity in residual beta cell function with detectable c-peptide being more common in adult-onset type 1 diabetes (26). In type 1 diabetes, detectable c-peptide is associated with better glycemic control, less hypoglycemia, and decreased microvascular disease (27-28).


Type 2 diabetes is heterogeneous, with many individuals having progressive loss of beta cell function over many years evidenced by decreasing c-peptide levels. Fasting and glucose-stimulated c-peptide levels have been used in the past to distinguish type 1 (severe insulin deficiency) from type 2 diabetes with limited success. However, targeted testing may be more discriminatory.  When random c-peptide testing was performed >3 years after clinical diagnosis of type 1 diabetes, 13% had a c-peptide ≥200 pmol/L, and after islet autoantibody and genetic testing, 6.8% of these were reclassified: 5.1% as having type 2 diabetes and 1.6% as having monogenic diabetes (29).


C-peptide stimulation using glucagon or a mixed meal such as Sustacal, has also been used to help differentiate between type 1 and type 2 diabetes, and to determine the need for insulin therapy in type 2 diabetes. In the glucagon stimulation test, glucose, insulin and c-peptide levels are measured 6 and 10 min after the intravenous injection of 1 mg of glucagon. Normal stimulation of c-peptide is a 150-300% elevation over basal levels. In the mixed meal tolerance test, Sustacal (6 mg/kg up to a maximum or 360 ml) is ingested over 5 minutes, and glucose and c-peptide are measured 90 min after oral ingestion.


These tests have had limited general clinical utility since they do not reliably discriminate between patients who require insulin therapy. They have been used in research studies and in the evaluation of patients after pancreatectomy and pancreatic transplantation. In the Diabetes Control and Complications Trial, a basal c-peptide value of <0.2 pmol/ml and stimulated level of <0.5 pmol/ml were used to confirm the presence of type 1 diabetes at entry (30).


PANCREATIC AUTOANTIBODIES


Islet autoantibodies can be detected early in the development of type 1 diabetes and are considered markers of autoimmune beta cell destruction. They predict progressive beta cell destruction and ultimately beta cell failure. The autoantibodies for which specific immunoassays are available include the 65-KDa isoform of glutamic acid decarboxylase (GAD65), insulin autoantibodies (IAA), zinc transporter antibodies (ZnT8), islet cell antigen 512 autoantibodies (ICA512), and autoantibodies to the tyrosine phosphatase related antigens islet antigen 2 (IA-2) and IA-2b. Measurements of ICA512, which are autoantibodies to parts of the IA-2 antigen, are no longer recommended. The presence of high levels of 2 or more antibodies is strongly predictive of type 1 diabetes mellitus. These antibodies may be detected before the onset of type 1 diabetes, at the time of diagnosis and for variable amounts of time after diagnosis. They have been used in screening for type 1 diabetes in first-degree relatives of an individual with type 1 diabetes or in research studies related to the early detection, treatment and prevention of type 1 diabetes (www.diabetestrialnet.org). These measurements are not recommended for use in general screening programs in low-risk individuals.


Commercially available assays for autoantibodies are sometimes useful in distinguishing type 1 diabetes from type 2 diabetes. The absence of detection of these antibodies, however, does not exclude the diagnosis of type 1 diabetes. Since IAA can form in response to insulin therapy, detection can be the result of insulin injections or autoimmune insulin antibody formation. GAD65 antibodies are frequently observed early in the course of type 1 diabetes. They are also present in the rare neurological disorder, stiff-man syndrome, and in some patients with polyendocrine autoimmune disease.


In adults with newly diagnosed diabetes for whom type 1 diabetes is a possible diagnosis, GAD65 is commonly measured first, along with or followed by IA2 and ZnT8. IAA are more commonly detected in young children who develop type 1 diabetes and are generally not measured in adults.


Lynam and coworkers (31) developed a clinical multivariable model to help differentiate between type 1 and type 2 diabetes in adults ages 18-50 years.  The model includes age at diagnosis, BMI, islet autoantibodies (GAD, IA-2), and a type 1 diabetes genetic risk score.  The authors define type 1 diabetes by a non-fasting c-peptide <200 pmol/L and rapid insulin requirement within the first 3 years of diagnosis. The definition of type 2 diabetes was not requiring insulin treatment within the first 3 years after diagnosis or, if insulin was used, having a c-peptide measurement of >600 pmol/L at ≥5 years post-diagnosis.  Since the measures of the genetic variants in the type 1 diabetes genetic risk score are not widely available, this model is not used clinically in the United States.


GENETIC TESTING FOR MONOGENIC DIABETES SYNDROMES


Monogenic diabetes syndromes account for 1%-5% of all individuals with diabetes and have been primarily classified as neonatal diabetes or Maturity-Onset Diabetes of the Young (MODY) based on clinical characteristics. More than 50 affected genes have been described. A Diabetes Care Expert Forum assembled in 2019 to re-consider the classification of monogenic diabetes syndromes. They recommend a classification system based upon molecular genetics, listing the affected gene, inheritance/phenotype, disease mechanism/special features, and the treatment implications (32).


When genetic testing is considered, involvement of centers with expertise in the diagnosis and treatment of monogenic diabetes syndromes is recommended (1).  Laboratories performing genetic testing should participate in quality assurance programs (32).  Proper diagnosis is critical since treatment approaches will differ depending upon the gene affected. 

Table 12.  When to Consider Genetic Testing for Monogenic Diabetes Syndromes

Diabetes diagnosed younger than 6 months of age

Diabetes in children and young adults not characteristic of type 1 or type 2 (negative pancreatic auto-antibodies, non-obese, no features of metabolic syndrome) and with a strong family history (diabetes in successive generations suggesting dominant inheritance)

Fasting glucose 100-150 mg/dL, stable A1c (5.6-7.6%), especially if in a non-obese child or young adult


The ADA recommends immediate genetic testing for all infants diagnosed with diabetes within the first 6 months of life (1). Common causes of neonatal diabetes include mutations in the following genes: KCNJ11 (potassium inward-rectifying channel, subfamily J, member 11), ABCC8 (ATP-binding cassette, sub-family C, member 8 of the potassium channel), INS (preproinsulin), 6q24 (PLAGL1, HYMA1), GATA6, EIF2AK3, EIF2B1 and FOXP3.


MODY most commonly manifests before age 25 years but can be diagnosed in older individuals. The inheritance is typically autosomal dominant. Individuals who have positive islet autoantibody test results and/or low c-peptide concentrations should not be tested for monogenic diabetes syndromes (33). The number of genetic mutations responsible has been increasing each year. Most common forms include: HNF4A-MODY (hepatocyte nuclear factor-4 alpha; MODY 1), GCK-MODY (glucokinase; MODY 2), HNF1A-MODY (hepatocyte nuclear factor 1 homeobox A;MODY 3 ), PDX1-MODY (MODY 4), HNF1B-MODY (hepatocyte nuclear factor-1 beta; MODY 5), NEUROD1-MODY (MODY 6), and INS-MODY (MODY 10).  A MODY risk calculator is available at: https://www.diabetesgenes.org/mody-probability-calculator


EVALUATION OF GLYCEMIC CONTROL IN DIABETES MELLITUS


Hemoglobin A1c


Glycosylated hemoglobin, or the hemoglobin A1c (HbA1c) assay, is the most widely accepted laboratory test for the measurement of glycemic control and is recommended for routine use in the management of patients with diabetes mellitus. HbA1c levels reflect average blood glucose levels over the preceding 2-3 months. Although the life span of erythrocytes is approximately 120 days, HbA1c levels represent a weighted average of blood glucose levels, with youngest red blood cells, reflecting mean glucose levels over the past month, contributing to a greater extent than older ones.


The International Federation of Clinical Chemistry Working Group on HbA1c defines the HbA1c as the hemoglobin A that is irreversibly non-enzymatically glycosylated at one or both N-terminal valines of the beta-chains of the hemoglobin. Multiple methods have been certified to measure HbA1c. The National Glycohemoglobin Standardization Program, which was started in 1996, has been largely successful in its goal to standardize HbA1c assays throughout the United States to the HPLC method used in the Diabetes Control and Complications Trial. The process has involved certification and proficiency testing, and long-term monitoring of quality control data. Providers should only use laboratories that are certified by the National Glycohemoglobin Standardization Program. Information concerning certified methods and laboratories can be found on their website http://www.ngsp.org/.


A consensus statement on the international standardization of HbA1c assays was issued by the American Diabetes Association (ADA), the European Association for the Study of Diabetes, the International Diabetes Federation, the International Federation of Clinical Chemistry and Laboratory Medicine, the International Society for Pediatric and Adolescent Diabetes, the Japanese Diabetes Society and the National Glycohemoglobin Standardization Program (34). HbA1c assays should be calibrated to this reference method and results reported in a standardized manner (A1c (%); A1c (mmol/mol), and estimated average glucose).


The ADA recommends determining HbA1c levels every 3 to 6 months to monitor glycemic control (1). Reducing the HbA1c level to as close to normal as possible is directly related to the reduction in the development and progression of the chronic complications of diabetes (31, 35-37). The ADA goal HbA1c is <7% (if this can be accomplished safely) but states that lower goals may be appropriate in individual patients. Higher HbA1c goals may be appropriate for patients with a history of severe hypoglycemia, limited life expectancy, advanced complications, and/or comorbid conditions and those in whom a lower goal is difficult to attain (1). The American Association of Clinical Endocrinologists target HbA1c is 6.5% for otherwise healthy patients at low risk for hypoglycemia. HbA1c targets should be individualized in patients with concurrent illness or those at risk for hypoglycemia (38).


The international A1c-Derived Average Glucose Study (ADAG) utilized frequent self-monitoring of blood glucose in adults with type 1 diabetes, type 2 diabetes, and no diabetes. The study described a linear relationship between HbA1c and average glucose level (39).  In the ADAG study, there was no significant difference in the regression lines between HbA1c and mean glucose levels among ethnic and racial groups, although there was a trend toward a difference in regression lines between African/African-American and Caucasian adults. Other studies have shown differences in HbA1c by race and ethnicity, but the reasons for this remain unknown and the individual differences within racial groups are greater than the variation between races (40-42). At this time the recommended HbA1c target does not differ based on race or ethnicity.


Table 13.  Correlation of HbA1c with Mean Blood Glucose Concentrations (39, 42-43)

Hemoglobin A1c (%)

Approximate Mean Plasma Glucose (mg/dL)


Nathan et al 2008 (ADAG study; reference 31)

Beck et al 2017
(reference 35)

6

100-152

101-163

7

123-185

128-190

8

147-217

155-218

9

170-249

182-249

10

193-282

209-273


Table 14. Relationship of HbA1c Levels with Mean Glucose Levels

Hemoglobin A1c (%)

Mean Glucose Concentrations (95% CI; reference 1)

Fasting (mg/dL)

Premeal (mg/dL)

Post meal (mg/dL)

Bedtime (mg/dL)

5.5-6.49

122
(117-127)

118
(115-121)

144
(139-148)

136
(131-141)

6.5-6.99

142
(135-150)

139
(134-144)

164
(159-169)

153
(145-161)

7.0-7.49

152
(143-162)

152
(147-157)

176
(170-183)

177
(166-188)

7.5-7.99

167
(157-177)

155
(148-161)

189
(180-197)

175
(163-188)

8.0-8.5

178
(164-192)

179
(167-191)

206
(195-217)

222
(197-248)


Depending upon the assay method being used, certain hemoglobinopathies may interfere with results. This problem is highly method-dependent. Inaccurate results may be obtained in the presence of salicylates, chronic alcohol or opiate use, hyperbilirubinemia, liver or renal disease, iron deficiency, vitamin C, vitamin E, hypertriglyceridemia, lead poisoning, recent blood transfusions, and when there are conditions of abnormal red blood cell turnover such as in anemia, hemolysis, pregnancy, or use of erythropoiesis-stimulating agents. See www.ngsp.org/interf/asp for a full list of interferences for different methods.


Because of the improved standardization and reference method for the HbA1c assay, both the ADA and an International Expert Committee suggest that a HbA1c > 6.5% on two occasions is diagnostic of diabetes (1,4). Benefits of the use of HbA1c for the diagnosis of diabetes are that the test is easy to perform, does not have to be performed in the fasting state, and does not require any special preparation. Potential problems include interference by factors associated with abnormal red blood cell turnover and cost (44). The HbA1c range that indicates high risk of developing diabetes is considered 6.0% to <6.5% by the International Expert Committee (4) and 5.7% to 6.4% by the ADA (1).


Fructosamine, Glycated Albumin and 1,5-Anhydroglucitol


Assays of glycated serum proteins, which mostly measure glycated serum albumin, can reflect short-term glycemic control. The fructosamine assay is most commonly used. Since albumin has a short half-life (14-20 days), this test indicates average blood glucose levels over the past few weeks, which can be helpful in certain conditions such as pregnancy or in patients with hemoglobinopathy or abnormal red blood cell turnover (1,45). These tests may be affected by hypertriglyceridemia, hyperbilirubinemia, hyperuricemia, hypothyroidism and hyperthyroidism, as well as by low serum protein and albumin levels. The relationship between these measures of glycemic control and HbA1c, fasting glucose and mean glucose have been reported in few studies shown below:

Table 15. Relationship Between Tests to Measure Glycemic Control

Hemoglobin A1c (%)

Mean Fasting Glucose (mg/dL)

Mean CGM Glucose (mg/dL)

Mean (Range) Fructosamine (μmol/L)

Mean (Range) Glycated Albumin (%)

Mean (Range) 1,5-anhydroglucitol (μg/mL)

5.4a

102a


219 (89-240)

12.2 (5.6-13.5)


100 b


224.9

12.5

27.5

5.7b


241.4

13.6

29.1


126 b


261.7

15.0

17.9

6.1a


238

13.3 (7.9-15.6)


6.2a

126


236
(159-265)

13.6


126


250.5-276.4

15.5-16.9

5.9-15.7

6.5 b


270.2

15.6

22.7

6.5c


254.7-289.5

16.1-18.3

5.0-15.3

7.4d


143

293

19.6

3.4

7.7 a

179


305
(266-355)

18.9
(15.7-23.0)


7.8d


170

312.5

22.8

4.2

8.2d


185

344

24.9

6.1

9.4d


218

427

30.4

11.6

10.5 a

269


445
(356-706)

30.3
(23.1-51.5)


a-c References 46-48: ARIC study (adults)

d Reference 49: DirecNet study (youth)

CGM: continuous glucose monitoring


Assays of 1,5-anhydroglucitol (1,5-AG) are an alternative measure of hyperglycemia. In the kidney, 1,5-AG is filtered by the glomeruli and reabsorbed in the proximal tubules. This reabsorption is competitively inhibited by glucose. When high glucose levels are associated with glycosuria, there is increased 1,5-AG excretion in the urine and lower serum levels. Concentrations of 1,5-AG reflect hyperglycemia-induced glycosuria over the prior 1-2 weeks. This test may be affected by pregnancy, advanced renal disease (CKD stages 4-5), and by use of SGLT-2 inhibitors.


There are few of studies demonstrating the usefulness of the fructosamine, glycated albumin, and 1,5-AG assays in predicting the development of diabetes-related complications (46, 50). Racial differences have also been reported for these assays (50). Since their clinical usefulness is not well established, testing is generally recommended in situations where HbA1c testing is expected to be inaccurate (e.g., abnormal red blood cell turnover).


Continuous Glucose Monitoring


Glucose data from continuous glucose monitors (CGM) are increasingly being used to assess glycemic control.  These data have the advantage of displaying glycemic patterns, glucose variability, time in target range, and time in hypoglycemia.  CGM is discussed in detail in the chapter entitled “Monitoring Technologies – Continuous Glucose Monitoring, Mobile Technology, Biomarkers of Glycemic Control” in the Diabetes section of Endotext.


EVALUATION OF HYPOGLYCEMIA


Symptomatic hypoglycemia is defined clinically using Whipple's triad, which includes the presence of symptoms (confusion, lightheadedness, loss of consciousness, seizure, aberrant behavior, sweating, palpitations, weakness, blurred vision, or hunger) at the time of a low plasma glucose level, with improvement of symptoms when plasma glucose levels return to normal (51). The physician should determine if the patient truly has hypoglycemia prior to seeking an etiology. A plasma glucose level < 55 mg/dl (3.1 mmol/l) should raise the suspicion for a hypoglycemic disorder and initiate further evaluation, but many authorities rely on a glucose <40 mg/dl (2.2 mmol/l) as being diagnostic (52). Although symptoms are commonly observed when plasma glucose falls to <55 mg/dl (3.1 mmol/l), levels of <45 mg/dl (2.5 mmol/l) are associated with cognitive dysfunction (neuroglycopenia). Capillary glucose determinations should not be used in the evaluation of hypoglycemic disorders due to their poor accuracy in these situations.


The Endocrine Society has published clinical practice guidelines for the evaluation and management of hypoglycemic disorders (53). In persons without diabetes, drugs or critical illnesses, hormone deficiencies, and non-islet cell tumors should be considered based on the clinical findings (54). If the cause of the hypoglycemia is not evident then plasma glucose, insulin, c-peptide, proinsulin, β-hydroxybutyrate, insulin antibodies, and a screen for oral hypoglycemic drugs should be obtained during an episode of spontaneous hypoglycemia. Glucagon 1 mg IV should then be administered with careful follow up of the glucose response. This will help determine if the condition is related to excessive endogenous insulin production. The diagnosis of pancreatic hyperinsulinemic hypoglycemia is supported by the demonstration that insulin secretion is not suppressed normally when the patient develops hypoglycemia. If testing cannot be conducted during an episode of spontaneous hypoglycemia, the prolonged fast or mixed meal test followed by the administration of glucagon is the most useful diagnostic study.


Some patients who have had bariatric surgery for the treatment of obesity, most commonly Roux-en-Y gastric bypass, will develop hypoglycemia. This is associated with abnormal OGTTs and mixed meal tests, abnormal transport of food to the small intestine, and, in some cases, hypersecretion of insulin and incretin hormones (55-58). Spontaneous hypoglycemia has been reported after islet auto-transplantation for chronic pancreatitis as well; a deficient glucagon response to hypoglycemia during a mixed meal test has been reported (59).


Prolonged Fast


The gold standard test in the evaluation of hypoglycemia is the 72-hour supervised fast although a 48-h fast is almost as effective in diagnosing patients with suspected insulinoma (60). The purpose of the fast is twofold. The first is to diagnose hypoglycemia as the cause of the patient's symptoms. The second is an attempt to determine the etiology of the hypoglycemia. Due to the risk of hypoglycemia, patients should be admitted to the hospital to undergo the fast in a monitored setting. The fast could be initiated in a carefully monitored outpatient facility, with the patient entering the hospital if the fast is not terminated prior to the closing of the site. Baseline bloodwork can include cortisol, growth hormone, glucagon, and catecholamines if deficient counterregulation is suspected.


During the fast, patients are allowed no food but can consume non-caloric caffeine-free beverages for up to 72 hours. The onset of the fast is the time of the last food consumption. During the fast all non-essential medications should be discontinued. Simultaneous insulin, c-peptide and glucose samples are obtained at the beginning of the fast and every 4-6 hours thereafter. Once the plasma glucose falls to <60 mg/dl, specimens should be taken every 1-2 hours under close supervision. Patients should continue activity when they are awake. The fast continues until the plasma glucose falls below 45 mg/dl (2.5 mmol/l) (plasma glucose <55 mg/dl (3.1 mmol/L) is recommended in the most recent Endocrine Society guidelines (53)) and symptoms of neuroglycopenia develop, at which time, insulin, glucose, c-peptide, oral insulin secretagogues, proinsulin and beta-hydroxybutyrate levels are obtained and the fast is terminated (52). Additional samples for insulin antibodies, anti-insulin receptor antibodies, IGF-1/IGF-2, and plasma cortisol, glucagon or growth hormone can also be obtained if a non-islet cell tumor, autoimmune etiology, or hormone deficiency is suspected. A glucagon tolerance test is then frequently performed to aid in diagnosis (Glucagon, 1 mg intravenously, administered with careful follow up of the glucose response every 10 minutes for 30 minutes. Further details regarding the glucagon tolerance test are below). Patients are fed at the conclusion of the test.


The diagnosis of endogenous hyperinsulinism is likely if the patient has neuroglycopenic symptoms, a fall in plasma glucose to <55 mg/dl, inappropriately elevated beta-cell polypeptides (insulin, proinsulin and c-peptide levels; see below table), with undetectable oral insulin secretagogue levels. β-hydroxybutyrate <2.7 mmol/L, and an increase in plasma glucose ≥25 mg/dL (1.4 mmol/L) after intravenous glucagon (53).


Table 16. Distinguishing Causes of Symptomatic Hypoglycemia (glucose < 55 mg/dl (3.0 mmol/l)) After a Prolonged Fast

Insulin (µU/mL)

C-peptide (nmol/L)

Proinsulin (pmol/L)

Oral hypoglycemic medication

Interpretation

≥3

<0.2

<5

No

Exogenous insulin

≥3

≥0.2

≥5

No

Endogenous insulina

≥3

≥0.2

≥5

Yes

Oral hypoglycemic (drug-induced)

a Insulinoma, non-insulinoma pancreatogenous hypoglycemia (NIPHS), post gastric bypass hypoglycemia.

Adapted from: Cryer, PE, et al. Evaluation and Management of Adult Hypoglycemic Disorders: An Endocrine Society Clinical Practice Guideline. J Clin Endocrinol Metab 94:709-728, 2009


Approximately 75% of patients with insulinomas are diagnosed after a 24 hour fast and 90-94% at 48 hours. Although some experts advocate conducting the prolonged fast for only 48 hours (60), others disagree, arguing that prolonging the fast up to 72 hours minimizes misdiagnosis and maximizes the probability of diagnosing an insulinoma (61).


Limitations of the prolonged fast:

  • Normal subjects, especially young women, can occasionally have plasma glucose levels of <40 mg/dl (2.2 mmol/l)
  • Rare insulinomas suppress their release of insulin in response to hypoglycemia
  • Insulin levels can sometimes be artificially elevated in the presence of anti-insulin antibodies.


OGTT and Mixed Meal Test


When the diagnosis of the dumping syndrome is being considered, a modified OGTT has been recommended (62).  After an overnight fast, a 75-gm glucose load is administered.  Glucose levels are measured at baseline and every 30 min up to 180 min.  To diagnose hypoglycemia due to the dumping syndrome, a glucose reading of <50 mg/dL is observed, typically between 60 and 180 min after receiving the glucose load. 


For patients with hypoglycemic symptoms several hours after meals, an OGTT or mixed meal test may be performed. The mixed meal test has not been well standardized. This test is typically done after an overnight fast. Patients eat a meal similar to one that provokes their symptoms. If this is not possible then a commercial mixed meal may be used. Patients are then observed for several hours. Samples for plasma glucose, insulin, c-peptide, and proinsulin are collected prior to the meal and every 30 minutes thereafter for 5 hours. If symptoms occur prior to the end of the test then additional samples for the above are collected prior to administration of carbohydrates. If Whipple’s triad is demonstrated, testing for oral hypoglycemic drugs and testing for insulin antibodies should be done. Interpretation of test results is the same as for the 72-hour fast or spontaneous hypoglycemia


Glucagon Tolerance Test


The glucagon tolerance test serves as a supplemental study to aid in the diagnosis of hypoglycemic disorders when results from the prolonged fast are inconclusive. Following an overnight fast (or at the conclusion of a prolonged fast), 1 mg of glucagon is injected intravenously over 2 minutes. Plasma glucose and insulin levels are measured at baseline, and either 10, 20, and 30 minutes after glucagon, or at 3, 5, 10, 15, 20, and 30 minutes after glucagon injection. In normal patients, maximum insulin response occurs rapidly and usually does not exceed 100 uU/ml (peak insulin 61+19 uU/ml at 3-15 minutes), and the serum glucose levels peak at 20-30 minutes (140 +24 mg/dl) (63).


Insulinoma patients demonstrate an exaggerated insulin response to glucagon, with values often exceeding 160 uU/ml within 15-30 minutes of the injection (peak insulin 93-343 uU/ml at 15 minutes) (54). In the hypoglycemic patient at the conclusion of the prolonged fast, an increase in plasma glucose of >25 mg/dl (1.4 mmol/l) post-glucagon suggests an insulin-mediated etiology (63).


Patients with malnutrition or hepatic disease may be unable to have a hyperglycemic response to glucagon due to depleted hepatic glycogen stores. Insulin responses in these subjects may be increased but not to the degree seen in subjects with an insulinoma. Drugs such as diazoxide, hydrochlorothiazide and diphenylhydantoin can cause false negative results (62). Patients with non-islet cell tumors such as hemangiopericytomas and meningeal sarcomas can have similar glucose elevations (30 mg/dl) as subjects with insulinomas following glucagon injection (65).


Another limitation of the glucagon stimulation test is the failure of some insulinoma patients to hypersecrete insulin following glucagon injection. This problem was reported in 8% of patients with insulinomas in one study (66). In addition, patients with cirrhosis with portocaval anastomosis can have peak insulin levels that are indistinguishable from subjects with insulinomas. Obese subjects and patients with acromegaly can also have exaggerated peak insulin responses, as can patients treated with sulfonylurea drugs and aminophylline.

An additional disadvantage of this test is the danger of causing hypoglycemia after 90-180 min (66) as well as inducing nausea and vomiting. Because of the possibility of severe hypoglycemia, a physician needs to be present during the test.


Autoimmune Hypoglycemia


The insulin autoimmune syndrome is a rare condition whereby antibodies, either directed against insulin or against the insulin receptor, are responsible for hypoglycemia. Autoimmune hypoglycemia due to insulin antibodies should be suspected when the hypoglycemia is associated with high insulin levels (usually >100 uU/mL) and incompletely suppressed C-peptide levels. Insulin levels are rarely >100 uU/mL in the presence of hypoglycemia due to an insulinoma. Although these elevated insulin levels can be observed with exogenous insulin administration, the associated c-peptide levels are usually extremely low. Autoimmune hypoglycemia is most often seen in people of Japanese descent but has been described in other populations (67). Autoimmune hypoglycemia may also be due to antibodies to the insulin receptor. These patients will have mildly elevated insulin levels (thought to be due to decreased clearance of insulin) and suppressed c-peptide levels, and may have other autoimmune conditions. Antibodies to insulin and/or proinsulin and insulin receptor antibodies can interfere with the measurements of pancreatic hormones using immunoassays (68-69). Insulin, proinsulin and/or insulin receptor antibody testing is needed to confirm the diagnosis of autoimmune hypoglycemia. This testing does not need to be done at the time of hypoglycemia.


C-Peptide Suppression Test


C-peptide and insulin are secreted in equimolar concentrations in the pancreas, making c-peptide levels a good marker of endogenous insulin secretion. The c-peptide suppression test can be used to test for an insulinoma or to provide supplemental diagnostic information, especially if the results of a supervised fast are not definitive. The c-peptide suppression test must be carefully administered, since the patient is given intravenous insulin to induce hypoglycemia. The advantage of the test is that it is of much shorter duration than the supervised fast.


The c-peptide suppression test is performed following an overnight fast. The procedure is to infuse regular insulin, 0.125 U/kg body weight, intravenously over 60 minutes. Blood samples are obtained from the contralateral arm at 0, 30, 60, 90, and 120 minutes for determination of insulin, c-peptide, and plasma glucose levels. An abnormal result is a lower percentage decrease of c-peptide at 60 minutes compared to normative data appropriately adjusted for the patient's body mass index and age (70). For example, an abnormal result for a 45-year-old with a BMI of 25-29 kg/m2 would be <61% suppression of c-peptide at 60 minutes (70). An alternative method (Regular insulin 0.075 IU/kg/hr. infused intravenously over 2 hours) using a different classification plot has been proposed (71) but few data using it have been published.


Limitations of this test include the fact that some patients with a documented insulinoma have normal c-peptide levels including normal percent decrease in c-peptide levels. There is also the danger of inducing severe hypoglycemia. In addition, little data concerning the reliability, sensitivity and safety of this test are published.


REFERENCES


  1. American Diabetes Association. Standards of medical care in diabetes - 2021. Diabetes Care 2021;44(Suppl.1):S15-S33.
  2. Siu AL; US Preventive Services Task Force. Screening for abnormal blood glucose and type 2 diabetes mellitus: U.S. Preventive Services Task Force Recommendation Statement. Ann Intern Med. 2015;163(11):861-8.
  3. American Association of Clinical Endocrinologists Medical Guidelines for Clinical Practice for Developing a Diabetes Mellitus Comprehensive Care Plan. Endocr Pract 2015;21(Suppl.2):1-87.
  4. The International Expert Committee. International Expert Committee Report on the role of the A1c assay in the diagnosis of diabetes. Diabetes Care 2009;32:1327-1334.
  5. Shaw JE, Zimmet PZ, McCarty D, de Courten M. Type 2 diabetes worldwide according to the new classification and criteria. Diabetes Care 2000;23 (Suppl 2):B5.
  6. The DECODE Study Group, the European Diabetes Epidemiology Group. Glucose tolerance and cardiovascular mortality: comparison of fasting and 2-hour diagnostic criteria. Arch Intern Med 2001;161:397-405.
  7. Harris TJ, Cook DG, Wicks PD, Cappuccio FP. Impact of the new American Diabetes Association and World Health Organization diagnostic criteria for diabetes on subjects from three ethnic groups living in the UK. Nutr Metab Cardiovasc Dis 2000;10:305-309.
  8. Sievenpiper JL, Jenkins DJA, Josse RG, Vuksan V. Dilution of the 75-g oral glucose tolerance test improves overall tolerability but not reproducibility in subjects with different body compositions. Diab Res Clin Pract 2001;51:87-95.
  9. Sacks DA, Hadden DR, Maresh M, et al. Frequency of gestational diabetes mellitus at collaborating centers based on IADPSG consensus panel-recommended criteria: the Hyperglycemia and Adverse Pregnancy Outcome (HAPO) Study. Diabetes Care. 2012;35:526–528.
  10. Guariguata L, Linnenkamp U Beagley J et al. Global estimates of the prevalence of hyperglycaemia in pregnancy. Diabetes Res Clin Pract. 2014;103(2):176.

11      Metzger BE, Buchanan TA, Coustan DR, et al. Summary and recommendations of the Fifth International Workshop-Conference on Gestational Diabetes Mellitus. Diabetes Care 2007; 30 (Suppl 2):S251-S260.

  1. Moyer VA; US Preventive Services Task Force. Screening for gestational diabetes mellitus; U.S Preventive Services Task Force recommendation. Ann Intern Med. 2014; 160(6):414-20.
  2. International Association of Diabetes and Pregnancy Study Groups Consensus Panel, Metzger BE, Gabbe SG, et al. International association of diabetes and pregnancy study groups recommendations on the diagnosis and classification of hyperglycemia in pregnancy. Diabetes Care 2010; 33:676.
  3. American College of Obstetricians and Gynecologists Practice Bulletin 180:Gestational Diabetes Mellitus. Obstet Gynecol. 2017;130:e17-37.
  4. HAPO Study Cooperative Research Group, Metzger BE, Lowe LP, et al. Hyperglycemia and adverse pregnancy outcomes. N Engl J Med 2008; 358:1991-2002.
  5. Vandorsten JP, Dodson WC, Espeland MA et al. NIH consensus development conference: diagnosing gestational diabetes mellitus. NIH Consens State Sci Statements 2013;29:1-31.
  6. Crowe SM, Mastrobattista JM, Monga M. Oral glucose tolerance test and the preparatory diet. Am J Obstet Gynecol 2000;182:1052-1054.
  7. Bellamy L, Casas JP, Hingorani AD, Williams D. Type 2 diabetes mellitus after gestational diabetes: a systematic review and meta-analysis. Lancet 2009; 373:1773.
  8. Noctor E, Crowe C, Carmody LA et al. ATLANTIC-DIP Investigators. Abnormal glucose tolerance post-gestational diabetes mellitus as defined by the International Association of Diabetes and Pregnancy Study Groups criteria. Eur J Endocrinol 2016;175:287-97.
  9. Moran A, Brunzell C, Cohen RC, Katz M, Marshall BC, et al. Clinical care guidelines for cystic fibrosis-related diabetes. A position statement of the American Diabetes Association and a clinical practice guideline of the Cystic Fibrosis Foundation, endorsed by the Pediatric Endocrine Society. Diabetes Care 2010;33:2697-2708.
  10. Moran A, Pillay K, Becker DJ, Acerini CL; International Society for Pediatric and Adolescent Diabetes. ISPAD Clinical Practice Consensus Guidelines 2014. Management of cystic –fibrosis related diabetes in children and adolescents. Pediatr Diabetes 2014;15(S20):65-76.
  11. Fiorentino TV, Marini MA, Succurro E, Andreozzi F, Sesti G. Relationships of surrogate indexes of insulin resistance with insulin sensitivity assessed by euglycemic hyperinsulinemic clamp and subclinical vascular damage.   BMJ Open Diabetes Res Care 2019;7:e000911.
  12. Chase HP, Cuthbertson DD, Dolan LM, Kaufman F, Krischer JP, Schatz DA, White NH, Wilson DM, Wolfsdorf J. The Diabetes Prevention Trial-Type 1 Study Group. First-phase insulin release during the intravenous glucose tolerance test as a risk factor for type 1 diabetes. J Pediatr 2001;138:2244-249.
  13. Davis AK, DuBose SN, Haller MJ, Miller KM, DiMeglio LA, Bethin KE, Goland RS et al. Prevalence of detectable c-peptide according to age at diagnosis of type 1 diabetes. .Diabetes Care 2015;38:476-481.
  14. Rickels MR, Evans-Molina C, Bahnson HT, Ylescupidez A, Nadeau KJ, Hao W, Clements MA, Sherr JL, Pratley RE, Hannon TS, Shah VN, Miller KM, Greenbaum CJ; T1D Exchange β-Cell Function Study Group. High residual C-peptide likely contributes to glycemic control in type 1 diabetes. J Clin Invest. 2020;130(4):1850-1862.
  15. Gubitosi-Klug RA, Braffett BH, Hitt S, Arends V, Uschner D, Jones K, Diminick L, Karger AB, Paterson AD, Roshandel D, Marcovina S, Lachin JM, Steffes M, Palmer JP; DCCT/EDIC Research Group. Residual β cell function in long-term type 1 diabetes associates with reduced incidence of hypoglycemia. J Clin Invest. 2021 Feb 1;131(3):e143011.
  16. Foteinopoulou E, Clarke CAL, Pattenden RJ, Ritchie SA, McMurray EM, Reynolds RM et al. Impact of routine clinic measurement of serum c-peptide in people with a clinician-diagnosis of type 1 diabetes. Diabet Med 2020 Nov 1,e14449.
  17. Diabetes Control and Complications Trial Research Group. The effect of intensive treatment of diabetes on the development and progression of long-term complications in insulin-dependent diabetes mellitus. N Engl J Med 1993;329:977-986.
  18. Riddle MC, Philipson LH, Rich SS, Carlsson A, Franks PW, Greeley SAW et al. Monogenic diabetes: from genetic insights to population-based precision in care: reflections from a Diabetes Care editors’ expert forum.  Diabetes Care 2020; 43:3117-3128.
  19. Shields BM, Shepherd M, Hudson M, McDonald TJ, Colclough K, Peters J, Knight B, Hyde C, Ellard S, Pearson ER, Hattersley AT; UNITED study team. Population-Based Assessment of a Biomarker-Based Screening Pathway to Aid Diagnosis of Monogenic Diabetes in Young-Onset Patients. Diabetes Care. 2017 Aug;40(8):1017-1025.
  20. Hanas R, John WG on behalf of the International HgbA1c Consensus Committee. 2013 Update on the Worldwide Standardization of the Hemoglobin A1c Measurement. Pediatric Diabetes 2013.
  21. Nathan DM, Cleary PA, Backlund JY, Genuth SM, Lachin JM, Orchard TJ, Raskin P, Zinman B; Diabetes Control and Complications Trial/Epidemiology of Diabetes Interventions and Complications (DCCT/EDIC) Study Research Group. Intensive diabetes treatment and cardiovascular disease in patients with type 2 diabetes. N Engl J Med. 2005;353:2643-2653.
  22. United Kingdom Prospective Diabetes Study Group. Intensive blood glucose control with sulphonylureas or insulin compared with conventional treatment and risk of complications in patients with type 2 diabetes (UKPDS 33). Lancet 1998;352:837-853.
  23. Ohkubo Y, Kishikawa H, Araki E, et al. Intensive insulin therapy prevents the progression of diabetic microvascular complications in Japanese patients with non-insulin-dependent diabetes mellitus: A randomized prospective 6-year study. Diabetes Res Clin Prac 1995;28:103-117.
  24. American Association of Clinical Endocrinologists Comprehensive Diabetes Management Algorithm 2018 Consensus Statement. Endocr Pract 2018;24(1):91-120.
  25. Nathan DM, Kuenen J, Borg R, Zheng H, Schoenfeld D, Heine RJ. Translating the A1C assay into estimated average glucose values. Diabetes Care 2008;31:1473-1478.
  26. Herman WH, and Cohen RM. Racial and ethnic differences in the relationship between HgbA1c and blood glucose: implications for the diagnosis of diabetes. J Clin Endocrinol Metab 2012;97:1067-1072.
  27. Bergenstal RM, Gal RL, Connor CG, Gubitosi-Klug R, Kruger D, Olson BA, Willi SM, Aleppo G, Weinstock RS et al. Racial differences in the relationship of glucose concentrations and hemoglobin A1c levels. Ann Intern Med 2017;167:95-102.
  28. Wei N, Zhang H, Nathan DM. Empirically establishing blood glucose targets to achieve HbA1c goals. Diabetes Care 2014;37:1048-1051.
  29. Beck RW, Connor CG, Mullen DM, Wesley DM, Bergenstal RM. The fallacy of average: how using HbA1c alone to assess glycemic control can be misleading. Diabetes Care 2017;40:994-999.
  30. Higgins T. HbA1c for screening and diagnosis of diabetes mellitus. Endocrine 2013;43:266-273.
  31. True MW. Circulating biomarkers of glycemia in diabetes management and implications for personalized medicine. J Diabetes Sci Technol 2009;3:743-747.
  32. Selvin E, Rawlings AM, Grams M, Klein R, Sharrett AR, Steffes M, Coresh J. Prognostic utility of fructosamine and glycated albumin for incident diabetes and microvascular complications. Lancet Diabetes Endocrinol 2014;2:279-288.
  33. Selvin E, Warren B, He X, Sacks DB, Saenger AK. .Establishment of community-based reference intervals for fructosamine, glycated albumin and 1.5-anhydroglucitol. Clin Chem 2018;64:843-850.
  34. Juraschek SP, Steffes MW, Selvin E. Associations of alternative markers of glycemia with hemoglobin A1c and fasting glucose. Clin Chem 2012;58:1648-1655.
  35. Beck R, Steffes M, Xing D, Ruedy K, Mauras N, Wilson DM, Kollman C.The interrelationships of glycemic control measures: HbA1c, glycated albumin, fructosamine, 1.5-anhydroglucitrol, and continuous glucose monitoring. Pediatr Diabetes 2011;12:690-695.
  36. Selvin E, Steffes ME, Ballantyne CM, Hoogeveen RC, Coresh J, Brancati FL. Racial differences in glycemic markers: a cross-sectional analysis of community-based data. Ann Intern Med 2011;154:303-309.
  37. Whipple AE. The surgical therapy of hyperinsulinism. J Int Chir 1938;3:237-276.
  38. Marks V: Recognition and differential diagnosis of spontaneous hypoglycaemia. Clin Endocrinol 1992;37:309.
  39. Cryer PE, Axelrod L, Grossman AB, Heller SR, Montori VM, Seaquist ER, Service FJ. Evaluation and management of adult hypoglycemic disorders: an Endocrine Society Clinical Practice Guideline. J Clin Endocrinol Metab. 2009;94:709-728.
  40. Dynkevich Y, Rother KI, Whitford I, Qureshi S, Galiveeti S, Szulc AL, Danoff A, Breen TL, Kaviani N, Shanik MH, Leroith D, Vigneri R, Koch CA, Roth J. Tumors, IGF-2 and hypoglycemia: insights from the clinic, the laboratory and the historical archive. .Endocr Rev 2013;34:798-826.
  41. Lee CJ, Brown T, Magnuson TH, Egan JM, Carlson, O, Elahi D. Hormonal response to a mixed-meal challenge after reversal of gastric bypass for hypoglycemia. J Clin Endocrinol Metab. 2013;98:E1208-1212.
  42. Ritz P, Hanaire H. Post-bypass hypoglycaemia: a review of current findings. Diabetes Metab. 2011;37:274-281.
  43. Roslin M, Damani T, Oren J, Andrews R, Yatco E, Shah P. Abnormal glucose tolerance testing following gastric bypass demonstrates reactive hypoglycemia. Surg Endosc 2011;25:1926-1932.
  44. Desimone ME, Weinstock RS. Hypoglycemia. In: Feingold KR, Anawalt B, Boyce A, et al., eds. Endotext. South Dartmouth (MA): MDText.com, Inc.; May 5, 2018.
  45. Bogachus LD, Bellin MD, Vella A, Robertson RP. Deficient glucagon response to hypoglycemia during a mixed meal in total pancreatectomy/islet autotransplantation recipients. J Clin Endocrinol Metab. 2018;103:1522-1529.
  46. Hirshberg B, Livi A, Bartlett DL, et al: Forty-eight-hour fast: the diagnostic test for insulinoma. J Clin Endocrinol Metab 2000;85:3222-3226.
  47. Service FJ, Natt N: Clinical perspective: the prolonged fast. J Clin Endocrinol Metab 2000;85:3973-3974.
  48. Scarpellini E, Arts J, Karamanolis G, Laurenius A, Siquini W, Suzuki H, Ukleja A, Van Beek A, Vanuytsel T, Bor S, Ceppa E, Di Lorenzo C, Emous M, Hammer H, Hellström P, Laville M, Lundell L, Masclee A, Ritz P, Tack J. International consensus on the diagnosis and management of dumping syndrome. Nat Rev Endocrinol. 2020;16:448-466.
  49. Kumar D, Mehtalia SD, Miller LV: Diagnostic use of glucagon-induced insulin response. Studies in patients with insulinoma or other hypoglycemic conditions. Ann Intern Med 1974;80:697-701.
  50. Service FJ: Hypoglycemic disorders. N Engl J Med 1995;332:1144-1152.
  51. Hoff AO, Vassilopoulou-Sellin R: The role of glucagon administration in the diagnosis and treatment of patients with tumor hypoglycemia. Cancer 1998;82:1585-1592.
  52. Marks V, Samols E: Glucagon test for insulinoma: a chemical study in 25 cases. J Clin Path 1968;21:346-352.
  53. Luspa BC, Chong AY, Cochran EK, Soos MA, Semple RK, Gorden P. Autoimmune forms of hypoglycemia. Medicine 2009;88:141-53.
  54. Hirata Y, Ishizu H, Ouchi N, Motomura S, Abe M, Hara Y, Wakasugi H, Takahashi I, Sakani H, Tanaka M, Kawano H, Kanesaka T. Insulin autoimmunity in a case with spontaneous hypoglycemia. J Japaneses Diab Soc. 1970;13:312-320.
  55. Ismail AAA. The insulin autoimmune syndrome (IAS) as a cause of hypoglycaemia: an update on the pathophysiology, biochemical investigations and diagnosis. Clin Chem Lab Med 2016;54:1715-1724.
  56. Service FJ, O'Brien PC, Kao PC, Young Jr WF: C-peptide suppression test: effects of gender, age and body mass index: implications for the diagnosis of insulinoma. J Clin Endocrinol Metab 1992;74:204-210.
  57. Saddig C, Bender R, Starke AA. A new classification plot for the C-peptide suppression test. 2002 ;3(1):16-25.


Principles of Genetic Testing for Dyslipidemia in Children

ABSTRACT


The genetic causes of several dyslipidemias have been identified. Our knowledge of the role of genetics in disorders affecting lipid and lipoprotein metabolism continues to improve along with advancements in technology and access of testing. Genetic testing offers diagnostic confirmation of disease, risk stratification, the ability to identify at risk biologic relatives, and individualized treatment options. While currently underutilized, genetic testing will increasingly play a key role in the treatment and management of children with lipid disorders. 


INTRODUCTION


In 2003, the cost of sequencing the first human genome was $2.7 billion. This pioneering work paved the way for genetic testing to become a practical tool in clinical practice. In 2016, the cost of genetic testing had declined to < $1,000. With cost continuing to decline, genetic testing is being utilized more frequently to help clinicians make informed decisions about clinical care. As genetic testing plays an increasingly important role in clinical management, it has become imperative that those who provide care for individuals with lipid and lipoprotein abnormalities understand the basic principles of genetic testing in order to provide appropriate care and accurate counseling, especially for affected children.


Although often underutilized, genetic testing helps to identify variants that play a causal role in disturbances of lipid and lipoprotein metabolism. Despite the benefits, the decision to perform a genetic test in youth requires a thorough understanding of the utility of genetic testing, as well as the nuances associated with testing in this younger population. Are children able to understand the purpose of the test being recommended and the short- and long-term consequences potentially associated with genetic test results? What rights does the child have in deciding whether or not to undergo testing? While many excellent and comprehensive publications are available on the genetic causes of lipid and lipoprotein disorders, the goal of this chapter is to discuss basic concepts of genetic testing, assist providers in the use of genetic testing – including the use of genetic counseling and interpretation and effective communication of results, address special considerations for genetic testing in youth, and discuss future directions in the field of diagnostic genetics as it relates to pediatric lipidology.


WHY IS GENETIC TESTING IMPORTANT?


When correctly utilized and properly communicated, genetic testing has the potential to provide significant benefits in both clinical management and patient education (1). Correct diagnosis of a genetic disorder can accurately assess risk and help inform clinical decision making for the child as well as affected and unaffected family members. 


For example, FH, a common condition (1:220), significantly increases an individual’s risk of premature cardiovascular disease (CVD) due to elevated levels of low-density lipoprotein cholesterol (LDL-C) (2). Although individuals with heterozygous FH have a variable phenotype, the presence of a genetic variant results in a significantly higher risk for developing CVD due to lifelong exposure of elevated levels of atherogenic LDL-C (3, 4).  Because FH is inherited in an autosomal co-dominant manner, first degree family members of those identified with a causative FH variant have a 50% chance of being affected and are at increased risk for developing CVD. Genetic testing can assist in therapeutic decision making for the index case as well as other family members identified by cascade screening or previously known to have hypercholesterolemia (5).


Value to Youth


When considering FH, unique benefits exist in identifying a causative genetic variant of those under 18 years of age. While CVD-related events typically occur in adulthood, the presence of persistently elevated cholesterol levels from an early age leads to the formation of atherosclerosis, beginning in childhood (5), and plays a key role in CVD risk and progression (6).  By identifying an at-risk child, properly assessing risk and initiating treatment, including early introduction of a heart-healthy lifestyle and appropriate lipid-lowering medications, risk can be dramatically reduced, with the goal of reducing or preventing future ASCVD-related events, such as a heart attack or stroke (7, 8).


Furthermore, when a child is identified with FH, reverse cascade screening can identify other affected family members. Because of its mode of inheritance, 50% of first-degree relatives of a child with genetically confirmed heterozygous FH are also affected, many often unaware of their condition, and therefore, not receiving lipid lowering medications (Figure 1) (9).

Figure 1. Sample pedigree from reverse cascade screening of proband. From Journal of Pediatric Nursing, 2019.

COMMON GENETIC TERMINOLOGY


Coverage: Number of genes sequenced. 

Depth: Number of times each nucleotide within a gene is sequenced.

Exome: Part of the genome that consists of exons. The exome accounts for roughly 1% of the genome (Figure 2).

Exon: A segment of a gene that encodes a protein (Figure 2).

Genome: A complete set of genetic information that provides all necessary information required for a human to function (Figure 2).

Intron: A noncoding region of DNA, or a segment of DNA that does not encode a protein (Figure 2).

Single Nucleotide Polymorphism (SNP): A common (present in >1% of population), typically low effect variant, occurring at a single nucleotide in the genome (Figure 2).

Splicing: A process by which introns are removed from a transcript to produce mature RNA, made up of exons (Figure 2).

Variant: An alteration in the DNA nucleotide sequence. Variants can be benign, pathogenic, or of unknown significance.

Figure 2. Visual depiction of a gene, nucleotide, introns and exons, splicing, and genome and exome sequencing.

AVAILABLE GENETIC TESTING


Targeted Panel


When considering conditions with known causal genetic loci, such as FH, targeted panels are often considered as a primary testing method. Four genes – LDLR, APOB, PCSK9, and LDLRAP1 – are principally considered when identifying pathogenic variants causing FH. While coverage is low (i.e., 4 genes), depth – depending on the performing laboratory – is high, often 100X up to 1,000X.


Targeted panels are most accurate when used to identify variants in exons and smaller deletions or duplications. Using a combination of next generation sequencing technologies, and Sanger sequencing and deletion/duplication analysis when necessary, analysis is performed to identify genetic variation often with >99% sensitivity and specificity. Introns are typically not sequenced beyond +/- 10 to 15 exon flanking base pairs.


Whole Exome Sequencing (WES)


As NGS technologies continue to evolve and cost declines, sequencing DNA of higher volume has become more feasible. WES allows for sequencing of all protein coding regions of a person’s genome, also known as the exome, along with flanking intronic regions. WES is often performed when the differential diagnosis is unclear or broad, or after a targeted genetic testing returns negative.


In the case of FH, WES can be helpful when no known variant is found in a traditional targeted panel. Several other conditions affecting lipid metabolism with known genetic variants – in APOE, ABCG5, ABCG8, LIPA, etc. – can produce a “FH phenotype,” in which conditions associated with variants in these genes create an overlap in elevated LDL-C levels with those seen in pathogenic FH variant carriers. Coverage in WES is high (i.e., 95 to >99% of the exome), while depth is often 20X up to 100X.


SECONDARY FINDINGS


It is important to note that targeted panels inclusive of candidate genes and WES have the potential of identifying unintentional or secondary findings. For example, certain variants in APOE are associated with a FH phenotype; however, other APOE variants are associated with a predisposition for Alzheimer’s disease. When WES is performed, secondary findings for variants in gene sites unrelated to the condition under suspicion can occur. For example, WES ordered for suspicion of FH could return variants in BRCA1/2 associated with a predisposition to develop breast or ovarian cancer and carry implications for other potentially affected family members. When secondary findings are identified, patients should be referred either to a geneticist or other relevant specialist.  However, depending on the test ordered, ideally directed by the patient’s and provider’s preferences, secondary findings can be excluded. Concerns about secondary findings can be alleviated by masking extraneous results.


SHOULD FAMILY MEMBERS BE TESTED?


Low or no cost genetic testing is sometimes offered to family members in an effort to both identify additional at-risk family members and help inform genotype/phenotype correlations for more accurate classification of gene variants.


INTERPRETING TEST RESULTS


How are Genetic Variants Classified?


Understanding a finding’s genetic variant classification can be a daunting task. No standardization of classification is uniformly adhered to, with each genetic testing laboratory offering their own definition or algorithm for classification. This ultimately results in the potential for one laboratory to define a variant as benign, while another may define the same variant as pathogenic. To further complicate matters, classification for each variant is subject to change as new and additional data about the variant is considered (10).


Interpretation of a pathogenic classification is the most straightforward. In the case of FH, the observed variant is considered to be the cause of the phenotype, based on sufficient evidence of 1) the variant type, and 2) other individuals previously identified with the same variant.

Interpretation becomes complicated in the case of a variant of unknown significance (VUS) and those with negative results. When faced with a VUS, it is important to consider how important additional data is in determining a causal link between a VUS and the clinical condition. Fortunately, many, but not all, genomics companies offer first degree relatives genetic testing at low or no cost. Familial testing provides additional data to assist in 1) more accurate classification of the finding in question, and 2) clinical judgement to more accurately guide health care decision making.


In the case of a negative result, it is important to understand any limitations that exist with the chosen test method.  If a targeted panel for FH is ordered and a pathogenic variant is not identified 1) the test ordered may not include all known variant sites, 2) additional potential variants exist, and 3) additional testing (WES) may be helpful.


COMMUNICATING TEST RESULTS


What is the Role of a Genetic Counselor? 


Given the complex nature of genetic testing as a diagnostic tool, genetic testing plays a crucial role in the patients understanding of risks and benefits of performing testing (11). Counseling should begin prior to testing being performed, and should continue after as a conversation with both the patient and their family.


Prior to testing, the patient should be informed of 1) the suspected condition and how genetics may play a role, 2) the possible benefits and risks of performing testing, and 3) the potential of discovering uncertain or secondary findings.


After completion, test results and interpretation of their impact on both direct patient care and family members should be discussed. If necessary, counseling for family planning and any further testing should be covered.


What is the Potential Impact of Genetic Testing Upon the Child? Family?


Proper genetic counseling and communication of test results provide the patient and family information of high utility, usually with minimal adverse impact (12). In 2017, using interviews of patients treated for FH who were the first to undergo genetically tested in their family, Hallowell et al. found testing was considered beneficial, as it provided patients with an origin of their disease and assessed their own and their family members’ risk (13). The majority of parents of children with FH want their children to be tested (14) and children have been found to understand and articulate their understanding of testing being conducted (15). A majority of families do not report psychological problems due to a diagnosis of FH (16).


WHO TO TEST?


In addition to those with FH, the genetic basis for several other disorders affecting lipid and lipoprotein metabolism have been described (Table 1).


Table 1. Genetic lipid disorders. Modified from Current Genetic Medical Reports, 2016


Condition

Variant Site

Inheritance

Typical Lipid Effect


Abetalipoproteinemia

MTTP

Autosomal recessive

↓↓LDL-C


Homozygous hypobetalipoproteinemia

APOB

Autosomal codominant

↓↓LDL-C


Heterozygous hypobetalipoproteinemia

↓LDL-C


Chylomicron retention disease

SAR1B

Autosomal recessive

↓LDL-C


PCSK9 deficiency

PCSK9

Autosomal codominant

↓LDL-C


Familial combined hypolipidemia

ANGPTL3

Autosomal codominant

↓LDL-C


Homozygous familial hypercholesterolemia

LDLR, APOB,PCSK9, LDLRAP11

Autosomal codominant
1Autosomalrecessive

↑↑LDL-C


Heterozygous familial hypercholesterolemia

↑LDL-C


Sitosterolemia

ABCG5, ABCG8

Autosomal recessive

↑LDL-C


Cerebrotendinous Xanthomatosis

CYP27A1

Autosomal recessive

↑LDL-C


Lysosomal acid lipase deficiency

LIPA

Autosomal recessive

↑LDL-C


Smith Lemli Opitz syndrome

DHCR7

Autosomal recessive

↓HDL-C


Tangier disease

ABCA1

Autosomal recessive

↓HDL-C


Fish eye disease

LCAT

Autosomal recessive

↓HDL-C


Apolipoprotein A-I deficiency

APOA1

Autosomal codominant

↓HDL-C


Scavenger Receptor B1 deficiency

SCARB1

Autosomal codominant

↑HDL-C


Cholesterol ester transfer protein deficiency

CETP

Autosomal codominant

↑HDL-C


Hepatic lipase deficiency

LIPC

Autosomal recessive

↑HDL-C


Familial chylomicronemia syndrome

APOA5, APOC2,GPD1, GPIHBP1,LMF1, LPL

Autosomal recessive

↑↑TG


Genetic testing in patients with lipid disorders may be considered in cases where diagnostic confirmation may benefit the patient through availability of or access to treatment, change in clinical management, or identification of other at-risk family members.


WHAT’S NEXT?


The progression of genetic testing has resulted in slowly changing the paradigm in clinical practice. Having most recently experienced the evolution of evidence-based medicine, we are entering an era of personalized medicine, and eventually, predictive medicine. In the coming years, existing methods and results will become better understood, and additional testing will likely become more affordable, accurate, and widely used, leading to a potential shift in the clinical focus from phenotype to genotype.


Genomic Medicine


The current focus of genetic testing involves sequencing of exomes, accounting for only 1% of the genome. In contrast, whole genome sequencing (WGS) offers sequencing of both exons – protein encoding regions – and introns, containing regulatory information which controls exon splicing, transcription, and translation. Deep intronic variants are currently associated with over 75 genetic conditions (17).


Additionally, RNA testing potentially offers similar benefits to WGS without having to analyze such a large volume of data. RNA testing potentially identifies any errors, including intronic variants, leading to incorrect splicing or transcript sequence. In the realm of lipidology, those with FH caused by a variant affecting apolipoprotein B (apoB) may have the most to benefit from RNA testing. ApoB circulates in 2 forms: apoB48, produced by the small intestine, and apoB100, produced by the liver, the latter involved in LDL assembly and uptake by the LDL receptor. Both forms are encoded by a single APOB gene, which undergoes an RNA editing process, producing both forms (18). In the future, investigating transcription and translation of APOB may prove useful in determining etiology of disease in patients with a currently unidentified variant. However, RNA sequencing may be complicated due to the necessity of tissue specific extraction. In the case of testing APOB, liver would be required for appropriate sequencing.


 Predictive Medicine


A significant portion of the general population, including those with a monogenic cause of FH, contain variants in genes associated with elevated cholesterol and CVD risk other than LDLR, APOB, PCSK9, and LDRAP1. SNPs are common variants of single nucleotides in a number of “low effect genes,” or genetic locations that do not greatly affect the phenotype. However, when cumulatively expressed, cholesterol or triglyceride levels or CVD risk can be raised to levels of those with monogenic disorders. It has been suggested that the vast majority of those with elevations of LDL-C may be a result of polygenic disorders, resulting in an FH-like phenotype. Additionally, severe TG elevation has been attributed to rare, polygenic forms of FCS and multifactorial chylomicronemia syndrome, a disorder in which cumulative expression of TG elevating variants along with a secondary risk factor (i.e., poorly controlled diabetes, obesity, hypothyroidism, etc.) results in a TG elevation similar to that seen in those with FCS. SNPs serve as the basis for genome wide association studies and genetic risk scores which respectively aim to correlate common genetic variations with presence of disease, and define risk of an outcome defined by the presence of a specific genetic profile.


Polygenic risk scores employ algorithms that aggregate a profile of an individual’s SNPs which have been associated with certain outcomes, including LDL-C or TG elevation, and CAD risk. Cholesterol and CAD risk scores are of increasing interest in clinical practice (19-23).


Screening and Preventive Medicine


Considering the future of current methodologies, genetic testing of youth and their parents has proven feasible and effective in the UK, and universal phenotypic screening of young children in the US is currently recommended (2, 24). FH also has potential to be a target for prenatal testing (25). By combining established universal phenotypic childhood screening (26) with reflex genetic and parental testing, the potential exists to identify every existing case of FH within one generation of testing. Subsequent targeted testing of affected patient’s children would identify future cases.


SPECIAL CONSIDERATIONS FOR YOUTH


While benefits exist that are unique to a pediatric population, additional unique circumstances should be also be considered when testing a child for a condition in which disease onset occurs during adulthood.


Should Children be Given a Choice?


The American Academy of Pediatrics (AAP) advocates for youth to have an increasingly important role in their own health care decisions as they age and mature. From a legal perspective, virtually no legal rights exist, nor are protections in place, to ensure a child possesses autonomy in the decision making process of their own health care (27). The decision to include the child in the process is ultimately left to the child’s parents and health care provider.


Should Testing be Deferred Until a Child is 18 Years-of-Age or Older?


In 2013, the AAP and American College of Medical Genetics (ACMG) released a joint policy statement on the use of genetic testing and screening of children (28), agreeing that the principle factor in determining whether to offer genetic testing should be the best interest of the child. In the case of FH, many feel that clear benefit exists in testing of children, as atherosclerosis can be reduced or prevented with early identification and treatment, ultimately reducing CVD risk.


Do the Results of Genetic Testing Create the Potential for Discrimination?


Once a child has undergone testing, results are entered into the patient’s medical record. The Genetic Information Nondiscrimination Act (GINA) of 2008 protects individuals from discrimination in health insurance and employment based on genetic information. GINA provides no guarantee that 1) Health insurers will pay for genetic test or the medical care that a genetic test indicates are appropriate; 2) Prevent revealing a test result or family history to an insurer to prove medical necessity; and 3) Protect against discrimination when applying for life insurance, disability insurance, or long term-care insurance. As children become adults, it is important to note that GINA does not apply to members of the United States military, veterans obtaining healthcare through VA, and the Indian Health Service.


In addition to perceived benefits, all potential risks must be considered and discussed before genetic testing of a minor is performed.


SUMMARY


Genetic testing offers 1) diagnostic confirmation; 2) enhanced risk assessment; 3) an ability to identify affected family members; and 4) the opportunity to individualized treatment options.  Lipidiologists are encouraged to use this emerging technology judiciously, mindful of the unique needs of youth. In the near future, genetic testing will likely be used on a wide scale to screen children and family members at-risk of CVD, with the goal of primary prevention. Given its current trajectory, genetic testing is becoming increasingly critical in our ability to provide accurate risk assessment as well as age appropriate and timely intervention to help guide our efforts in educating and managing youth with disorders of lipid and lipoprotein metabolism.


RESOURCES


Select Laboratories Offering Genetic Testing for Dyslipidemias


Quest Diagnostics: https://www.questdiagnostics.com/

LabCorp: https://www.labcorp.com/

Ambry Genetics: https://www.ambrygen.com/

Blueprint Genetics: https://blueprintgenetics.com/

GeneDx: https://www.genedx.com/

Invitae: https://www.invitae.com/en/


The Genetic Information Nondiscrimination Act (GINA) of 2008


https://www.eeoc.gov/laws/statutes/gina.cfm


REFERENCES


  1. W Burke. “Genetic testing.” New England Journal of Medicine, 2002;347:1867-1875.
  2. D Wald et al. “Child-parent familial hypercholesterolemia screening in primary care.” New England Journal of Medicine, 2016;375:1628-1637.
  3. A Sturm et al. “Clinical genetic testing for familial hypercholesterolemia.” Journal of the American College of Cardiology, 2018;72(6):662-680.
  4. A Khera et al. “Diagnostic yield and clinical utility of sequencing familial hypercholesterolemia genes in patients with severe hypercholesterolemia.” Journal of the American College of Cardiology, 2016;67(22)2578-2589.
  5. DM Kusters et al. “Carotid intima-media thickness in children with familial hypercholesterolemia.” Circulation Research, 2014;114:307-310.
  6. DP Wilson et al. “Screening for genetic variants in children and adolescents with dyslipidemia: importance of early identification and implications of missed diagnoses.” Expert Opinions on Orphan Drugs, 2016;7:699-710.
  7. M Braamskamp et al. “Statin initiation during childhood in patients with familial hypercholesterolemia: consequences for cardiovascular risk.” Journal of the American College of Cardiology, 2016;37(4):455-456.
  8. A Wiegman et al. “Familial hypercholesterolemia in children and adolescents: gaining decades of life by optimizing detection and treatment.” European Heart Journal, 2015;36(36):2425-2437.
  9. A Vinson et al. “Reverse cascade screening for familial hypercholesterolemia.” Journal of Pediatric Nursing, 2018;44:50-55.
  10. S Aronson et al. “Communicating new knowledge on previously reported genetic variants.” Genetics in Medicine, 2012;14:713-719.
  11. A Brautbar et al. “Genetics of familial hypercholesterolemia.” Current Atherosclerosis Reports, 2015;17(4):491.
  12. N Jenkins et al. “How do index patients participating in genetic screening programmes for familial hypercholesterolemia (FH) interpret their DNA results? A UK-based qualitative interview study.” Patient Education and Counseling, 2013;90(3):372-377.
  13. N Hallowell et al. “A qualitative study of patients’ perceptions of the value of molecular diagnosis for familial hypercholesterolemia (FH).” Journal of Community Genetics, 2017;8(1):45-52.
  14. M Umans-Eckenhausen et al. “Parental attitude towards genetic testing for familial hypercholesterolemia in children.” Journal of Medical Genetics, 2002;39:e49.
  15. E Smets et al. “Health-related quality of life of children with a positive carrier status for inherited cardiovascular diseases.” American Journal of Medical Genetics, Part A, 2008;146A:700-707.
  16. S Tonstead. “Familial hypercholesterolaemia: a pilot study of parents’ and children’s concerns.” Acta Paediatrica, 1996;85(11):1307-1313.
  17. R Vaz-Drago et al. “Deep intronic mutations and human disease.” Human Genetics, 2017;136(9):1093-1111.
  18. N Davidson et al. “Apolipoprotein B: mRNA editing, lipoprotein assembly, and presecretory degredation.” Annual Review of Nutrition, 2000;20:169-193.
  19. J Dron et al. “The evolution of genetic-based risk scores for lipids and cardiovascular disease.” Current Opinions in Lipidology, 2019;30(2):71-81.
  20. P Talmud et al. “Use of low-density lipoprotein cholesterol gene score to distinguish patients with polygenic and monogenic familial hypercholesterolaemia: a case-control study.” The Lancet, 2013; 381(9874):1293-1301.
  21. M Paquette et al. “Polygenic risk score predicts prevalence of cardiovascular disease in patients with familial hypercholesterolemia.” Journal of Clinical Lipidology, 2017;11(3):725-732.e5.
  22. A Rao et al. “Polygenic risk scores in coronary artery disease.” Current Opinions in Caridiology, 2019;34(4):435-440.
  23. A Sarraju et al. “Genetic testing and risk scores: impact on familial hypercholesterolemia.” Frontiers in Cardiovascular Medicine, 2019;6:5.
  24. L Hamilton et al. “Implementation of cholesterol screening at 2 years of age.” Journal of Clinical Lipidology, 2019;13(3):E3-E4.
  25. J Vergotine et al. “Prenatal diagnosis of familial hypercholesterolemia: importance of DNA analysis in the high-risk South African population.” Genetic Counseling, 2001;12(2):121-127.
  26. “Expert panel on integrated guidelines for cardiovascular health and risk reduction in children and adolescents.” NHLBI, Pediatrics, 2011;128(5):S213-S256.
  27. E Clayton. “How much control do children and adolescents have over genomic testing, parental access to their results, and parental communication of those results to others?” Journal of Law, Medicine & Ethics, 2016;43(3):538.544.
  28. “Ethical and policy issues in genetic testing and screening of children.” Committee on Bioethics, Committee on Genetics, American College of Medical Genetics, and Genomics Social, Ethical, and Legal Issues Committee, Pediatrics, 2013;131(3):620-622.

Pituitary Tumors in Childhood

ABSTRACT


The pituitary region in childhood can be mainly affected by two kinds of neoplasia: craniopharyngiomas and pituitary adenomas. Craniopharyngiomas accounts for 1.2 to 4% of all childhood intracranial tumors, at this age adamantinomatous with cyst formation is the most common histological type. Craniopharyngiomas are benign from a histological point of view, but they can be aggressive, invading surrounding tissues and bony structures. Clinical presentation is non-specific with neurological disturbances, such as headache and visual field defects, together with manifestations of endocrine deficiency. Pituitary adenomas constitute less than 3% of supra-tentorial tumors in children, they are less common in pediatric patients than in adolescents or adults. Prolactinoma is the most frequent adenoma type in children, followed by the corticotrophinoma and the somatotrophinoma. Non-functioning pituitary adenomas, TSH-secreting, and gonadotrophin-secreting adenomas are extremely rare in children, accounting for only 3-6% of all pituitary tumors. Presenting symptoms are typically related to endocrine dysfunction, rather than to mass effects. Pituitary adenomas in childhood may have a genetic cause and, in some cases, additional manifestations can occur as part of a syndromic disease. Therapeutic options depend on the tumor type, with surgical approach often remaining the first choice.


INTRODUCTION


Pituitary function depends on the integrity of the hypothalamo-pituitary axis and the functionality of numerous differentiated cell lines in the anterior pituitary lobe that specialize in specific hormone production. The development of these cell lines is the result of events during pituitary organogenesis that are under the sequential control of transcription factors (1). Any abnormality occurring in the pituitary gland, either congenital (congenital malformations, genetic abnormalities) or acquired (perinatal insults, tumors, infections), will cause profound alterations of the whole endocrine system.

Tumors in the pituitary region can be classified on the basis of topographic criteria as intra-, supra- para- or retrosellar (2). Intrasellar tumors are mostly represented by pituitary adenomas (more than 90% of all intrasellar lesions), while dys-embryogenetic lesions such as Rathke’s pouch cyst or pituitary blastomas are less frequent. The suprasellar tumors are dys-embryogenetic lesions of the midline such as craniopharyngiomas, germinomas, dermoid or epidermoid cysts, lipomas, teratomas, and hamartomas. Other tumors such as meningiomas or gliomas are uncommon during childhood or adolescence. Craniopharyngiomas, the most common cause of hypopituitarism in childhood, and adenomas are the most frequent lesions of the pituitary region in children and adolescents. Virtually all tumors of this region are benign.


This chapter aims at reviewing the most recent epidemiological, diagnostic, and therapeutic knowledge on pituitary tumors in childhood and adolescence.


CRANIOPHARYNGIOMAS


Craniopharyngiomas are rare embryonic malformations of the sellar and parasellar area with an incidence of 0.5 to 2 cases per million persons per year, 30 to 50% of all cases presenting during childhood and adolescence (3-7). They originate from squamous rest cells of the remnant of Rathke’s pouch between the adenohypophysis and neurohypophysis in the region of the pars tuberalis. Rathke’s pouch is a cystic diverticulum from the roof of the embryonic mouth that gives rise to the adenohypophysis and determines the induction of the neurohypophysis. Craniopharyngiomas represent 1.2 to 4% of all childhood intracranial tumors (8-10) and show a bimodal distribution during the first-second decade of life and then in the fifth, apparently without any gender difference (5, 7). The tumor generally originates in the suprasellar region (94-95%), purely suprasellar (20–41%) or both supra- and intrasellar (53–75%), whereas the purely intrasellar forms (5-6%) are less frequent (5). Extremely rare are forms originating in the III ventricle, in the rhinopharynx, in the sphenoid, or in other locations (5). In their pure form, the adamantinomatous form and papillary form are clinicopathologically distinct. In childhood and adolescence, its histological type is usually adamantinomatous with cyst formation (3-7).


The pathogenesis of adamantinomatous craniopharyngioma is characterized by the deregulation of the Wnt pathway, in particular by activating mutations in exon 3 of the CTNNB1 gene encoding for β-catenin (11-13). Otherwise, most of papillary craniopharyngioma show a BRAF V600E mutation, resulting into activation of MAPK pathway (13, 14). Papillary forms exhibiting BRAF V600E mutations are rarely found in the pediatric age range (15, 16).


Craniopharyngiomas are benign from a histological evaluation but they can be aggressive, invading surrounding bony structures and tissues; they commonly have cystic components that may be multiple and generally cause compression of adjacent neurological structures (3-7). The adamantinomatous form is more locally aggressive and is characterized by a higher rate of recurrence than the papillary form (17). The molecular basis of this phenomenon is still not defined; however, a recent study showed that tissue infiltration could be favored by signaling of tyrosine kinase (18).


Clinical Presentation and Diagnosis


The diagnosis of craniopharyngioma is often made late, sometimes years after the initial appearance of symptoms. Neurological disturbances, such as headache and visual field defects, together with manifestations of endocrine deficiency such as stunted growth and delayed puberty, are the common presenting symptoms of craniopharyngiomas (3-7). Among adult-onset craniopharyngioma patients, hormonal deficits at the time of diagnosis are much more pronounced when compared with childhood-onset craniopharyngioma patients (3). At diagnosis, endocrine dysfunction is found in up to 80% of patients (3-7). Reduced GH secretion is the most frequent finding, present in up to 75% of patients, followed by FSH/LH deficiency in 40%, and ACTH and TSH deficiency in 25% (3-7). Despite the fact that the tumor is frequently large at presentation, the pituitary stalk is usually not disrupted, and hyperprolactinemia secondary to pituitary stalk compression is found in only 20% of patients (3-7). Diabetes insipidus is also relatively uncommon, occurring in ~17% of patients (3-7, 19). An increase in weight tends to occur as a later manifestation, shortly before diagnosis (3-7). Then, the clinical combination of headache, visual impairment, decreased growth rate, and/or polydipsia/polyuria would be very suggestive of childhood craniopharyngioma in the differential diagnostic process (20).


To date, magnetic resonance imaging (MRI) before and after gadolinium application is the standard imaging for the detection for craniopharyngiomas. The neuroradiological diagnosis of craniopharyngiomas is based on the features of the lesion itself and on its relations with the surrounding structures. Particularly, the diagnosis is mainly based on the three characteristic components of the tumor: cystic, solid and calcified (5, 7, 21-23). The cystic component (Fig.1 and 2) constitutes the most important neoplastic part (up to the 70-75% of the total volume), and shows a variable signal depending on the chemical-physical properties of its content (24). A fluid content will appear hypointense in T1 and hyperintense in T2 while a lipid (due to cholesterol), methemoglobin or protein content will appear as hyperintense in T1 and T2 sequences. The solid portion shows an isointense signal in T1 and a hyperintense signal in T2 with enhancement after gadolinium, at variance with the cystic component (Fig. 3 and 4). However, enhancement after paramagnetic contrast is not a consistent feature (24). Computed tomography (CT) imaging is the only way to detect or exclude calcification, which is found in approximately 90% of tumors and therefore a crucial differentiating component for diagnosis (21-23).Calcification appears as areas of low signal in all sequences (23). The radiological appearance of non-homogeneous signal or a prevalent cystic component should not be regarded as a proof of a craniopharyngioma, since macroadenomas can also sometimes be characterized by patterns resembling craniopharyngiomas. Moreover, the craniopharyngioma, without evidence of calcification, could be confused with different neoplasms such as hypothalamic/chiasmatic astrocytomas, germ cell tumors, or Langerhans cell histiocytosis (24).

Figure 1. Resonance imaging T1-weighted sequences on coronal planes. Intra- and suprasellar craniopharyngioma in an 8-year-old boy presenting with reduced growth velocity and headache. This tumor has a total cystic component as shown by the hyper-intense spontaneous signal. (Kindly provided by S. Cirillo, II University of Naples)

Figure 2. Resonance imaging T1-weighted sequences on sagittal planes. Intra- and suprasellar craniopharyngioma in an 8-year-old boy presenting with reduced growth velocity and headache. This tumor has a total cystic component as shown by the hyper-intense spontaneous signal. (Kindly provided by S. Cirillo, II University of Naples)

Figure 3. Resonance imaging T1-weighted sequences on sagittal plane before IV gadolinium chelate administration. Extra-axial craniopharyngioma in the intra and suprasellar space, with non-homogenous signal due to calcifications and cysts, in a 7- year-old boy presenting with reduced growth velocity, sleepiness, and visual loss. (Kindly provided by S. Cirillo, II University of Naples).

Figure 4. Resonance imaging T1-weighted sequences on sagittal plane after IV gadolinium chelate administration. Extra-axial craniopharyngioma in the intra and suprasellar space, with non-homogenous signal due to calcifications and cysts, in a 7- year-old boy presenting with reduced growth velocity, sleepiness, and visual loss. After contrast medium non-homogenous enhancement of the solid component. (Kindly provided by S. Cirillo, II University of Naples).

Treatment Strategy


The treatment of craniopharyngioma is individualized on the basis of clinical presentation and several tumoral features such as dimension, location and extension, balancing the therapeutic radicality and the consequent risk of relapse with the onset of neurologic and endocrine complications. In instances where the onset of manifestation is an emergency with symptoms of raised intracranial pressure or rapid deterioration in visual function, to relieve these symptoms and prevent further visual deterioration initial surgical treatment, for hydrocephalus or tumor cyst decompression may be necessary prior to definitive treatment of the tumor (3-7).


To date, surgery remains the first treatment option in pediatric craniopharyngiomas. Craniopharyngiomas are characterized by variability of localization and a relationship with important structures like the hypothalamus, optic chiasm, third ventricle, and vessels of the circle of Willis: for this reason, there is no paradigmatic surgical treatment (25). The main purpose of surgery is significant tumoral removal and the operative approach is generally dictated by localization and extent of the craniopharyngioma. Optimal initial localization, without involvement of the hypothalamus and optic chiasm, allows one to aim at radical resection preserving visual and hypothalamic functions; indeed, purely infra-diaphragmatic as well as supra-diaphragmatic/infra-chiasmatic tumors have a favorable surgical outcome with higher gross total resection rates in experienced hands. Otherwise, lesions extending within the third ventricle and lesions beyond 3cm in diameter, independent of their localization, are characterized by a greater complexity of treatment and a worse therapeutic outcome. In effect, radical resection and attempting total neoplastic removal results in significantly impaired functional outcomes (26, 27) , so currently many prefer subtotal removal and subsequent radiotherapy. Aside from the traditional microscopic approach via the subfrontal or pterional craniotomy, transsphenoidal approaches and other minimal invasive surgical methods, e.g., catheter implantation into cystic formations of the tumor, have become popular (26, 27). The transsphenoidal approach is appropriate for infra-diaphragmatic lesions, whereas tumors with suprasellar extensions require a transcranial approach. Nevertheless, the extended transsphenoidal approach has been used in lesion with supradiaphragmatic extension, showing a higher frequency of endocrine and neurological complications compared to the use of the same technique for an intra-diaphragmatic one (28).


Radiotherapy is required in case of incomplete tumor removal, which is common for extra-sellar craniopharyngiomas, and can effectively be added to avoid recurrences, determining lower progression rates (21%) compared to subtotal surgery alone (71-90%) (28). In children, however, the benefit of any additional radiotherapeutic treatment should be balanced against the high risk of inducing hypopituitarism later in life. In a retrospective preliminary review aiming at evaluating the efficacy and toxicity of fractionated proton radiotherapy in the management of pediatric craniopharyngioma, local mass control was reported in 14 of 15 patients with few acute side effects and newly diagnosed panhypopituitarism, a cerebrovascular accident (from which the patient recovered), and an out-of-proton-field meningioma in a single patient who received previous radiotherapy as a long-term complications (8, 29).


Modern radiotherapy techniques allow a better conformation of the field of action, reducing the dose on the structures adjacent to the craniopharyngioma and the consequent adverse effects, particularly endocrine and visual ones. Currently, intensity modulated radiotherapy (IMRT) and proton beam therapy (PBT) have shown encouraging results in the pediatric population (25).


Further, therapeutic options for large cystic craniopharyngiomas are cyst drainage and intracystic instillation of Interferon-alpha, whereas instillation of bleomyicin is no longer used because of neurotoxicity due to leakage.Recently, a multicenter trial on the systemic use of peginterferon alpha-2b, administered subcutaneously, ended prematurely due to a lack of efficacy on the relapse prevention of the solid portion of the neoplasm (28). Relapse of craniopharyngioma occurs in about 35% of patients and the management of recurrence is influenced by previous therapy (30).


Currently, attention focuses on the potential of molecular target therapy. Agents that effect the Wnt pathway are not currently available, whereas evaluation of the use of vemurafenib and dabrafenib (BRAF inhibitors) and the combination of dabrafenib and trametinib (a MEK inhibitor) are showing encouraging results (14, 15, 31-33).


PITUITARY ADENOMAS


Pituitary adenomas are the most common cause of pituitary disease in adults but they are less common in children, becoming increasingly more frequent during the adolescent years (34-37). The estimated incidence of pituitary adenomas in childhood is still unknown since most published series included patients with onset of symptoms before the age of 20 yrs as pediatric patients. Pituitary adenomas constitute less than 3% of supra-tentorial tumors in children, and 2.3-6% of all pituitary tumors treated surgically (34, 35, 38, 39). The average annual incidence of pituitary adenomas in childhood has been estimated to be 0.1/million children (40). Among all supra-tentorial tumors treated during a 25-year period in a center, pituitary adenomas were diagnosed in only 1.2% of children (41). Pituitary carcinomas are rare in adults and extremely rare in children (42). The first, and probably unique, case of pituitary carcinoma in a child was described by Guzel et al. in 2008. A 9-year-old girl, with an history of hydrocephalus treated with ventriculoperitoneal shunt 3 years before, complained of progressive visual and gait disturbance, headache, and speech difficulties. Neurological examination revealed visual loss, papilledema, and dysarthria. Magnetic resonance revealed a large tumor mass in frontal region, multiple lesions in sellar-parasellar region, posterior fossa, and multiple intraspinal metastatic lesions. Gross total resection of frontal mass was performed, and the histopathological and immunohistochemical exams revealed a pituitary carcinoma. Despite of the post-operative use of temozolomide, the patient died after 2 months without response to this therapy (43). There is no consensus on the alleged greater invasiveness of pituitary adenomas in children than in adults, while a slightly greater prevalence in females has been reported (7, 34-36, 40). However, gender distribution reflects the relative contribution of the two main groups, PRL- and ACTH- secreting adenomas, which predominate in most series reported. Prolactinoma is indeed the most frequent adenoma histological type in children, followed by the corticotrophinoma and the somatotrophinoma (44). Non-functioning pituitary adenomas, TSH-secreting, and gonadotrophin-secreting adenomas are very rare in children, accounting for only 3-6% of all pituitary tumors. ACTH-secreting adenomas have an earlier onset and predominate in the pre-pubertal period, where interestingly male cases are more frequent, while GH-secreting adenomas are very rare before puberty, except in XLAG (7). Similar to adults, presenting symptoms are generally related to the endocrine dysfunction, such as growth delay and primary amenorrhea, rather than to mass effects (41, 42, 44-48). Symptoms of pituitary tumor presentation differ according to the tumor type as shown in Table 1 and detailed in the specific sections.


Table 1. Prevalence of Clinical Symptoms and Signs in Children/Adolescents with Pituitary Adenomas. Data drawn from ref. 47-53


PRL-secreting adenomas


ACTH-secreting

 adenomas


GH-secreting

 adenomas


 TSH-secreting

 adenomas


 Clinically non-functioning

adenomas


Acne


+


Delayed/arrest growth


-/+


+


++


++


Delayed/Advanced bone age


+


+


–/+


++


Delayed puberty


++


+


+


+


++


Early sexual development


++


Erythroses


+


Fatigue or weakness


+


+


Galactorrhea


+++


–/+


Gigantism/Acromegaly


++


Glucose intolerance


+


+


+


Gynecomastia


+


–/+


Headache


++


+


++


+


++


High school performance


+


Hirsutism


+


Hypertension


+


–/+


–/+


Menstrual irregularities


++


+


++


+


++


Mild hyperthyroidism


+


Osteoporosis


+


+


+


Premature thelarche


++


–/+


Primary amenorrhea


++


+


++


+


++


Sleep disturbances


+


++


Striae


+


Visual field defects


+++

––/+


+++


+++


+++


Weight increase


+


+


– Absent; –/+ rare; ––/+ very rare; + present; ++ frequent; +++ frequent in macroadenomas


PRL-SECRETING ADENOMAS


Prolactinomas are the most frequent pituitary tumors both in childhood and in adulthood, and their frequency varies with age and sex, occurring most frequently in females between 20-50 years (35, 44, 49-51). Also, pediatric prolactinomas are more frequent in girls, but earlier onset, larger adenoma volume, and higher serum prolactin levels are found in boys (52).


Clinical Presentation and Diagnosis


PRL-secreting adenomas are usually diagnosed at the time of puberty or in the post-pubertal period, and clinical manifestations vary in keeping with the age and sex of the child (34-36, 44, 50, 51). Pre-pubertal children generally present with a combination of headache, visual disturbance, growth failure, and amenorrhea (Table 1). Growth failure is not, however, a common symptom: in fact, in two different retrospective studies, 4% of 25 patients (51) and 10% of 20 patients (53) were reported to have short stature at the diagnosis of prolactinoma. Weight gain has been reported to occur in patients with hyperprolactinemia (54-56) but never described in children. In a re-evaluation of the young/adolescent patients with hyperprolactinemia admitted to the University Federico II from January 1st 1995 to December 31st 2004 (44, 57), short stature was found in 7 of 50 patients (14%), five girls and two boys, and another two patients, one girl and one boy, had their height below or at the 5th percentile and another 8 (3 girls) had their height between the 5th and 10th percentile. The height percentiles in the patients with extrasellar/invasive macroprolactinomas were lower than in those having smaller tumors (Fig. 5). Additionally, all girls presented with oligomenorrhoea or amenorrhea; most also had galactorrhea; gynecomastia was present in 12 of 21 boys (57.1%). The most common symptoms of prolactinomas in the peripubertal age are those associated with deficiency of the pituitary-gonadal axis. Menstrual irregularities in girls are common in all types of pituitary adenomas, except those causing Nelson’s syndrome (58). Galactorrhea should be carefully investigated by expressing the breast, because teenagers may not spontaneously refer to it as a symptom, and frequently it is not spontaneous. Headache and visual field defects predominate in patients bearing large adenomas (Table 2).

Figure 5. Height (shown as mean percentiles for age) and Body Mass Index in 50 patients with prolactinomas diagnosed before 20 years of age. Data from ref. (57).


Table 2. Presentation of Prolactinomas in Children and Adolescents: The Two-Decade Experience of the Department of Endocrinology and Oncology, University “Federico II” of Naples. Data from reference (57)


Microadenomas


Enclosed Macroadenomas


Extrasellar and/or Invasive Macroadenomas


Number


20


21


9


Girls/Boys


15/5


11/10


3/6


Age at diagnosis (yrs)


14.4±0.5


14.8±0.4


13.8±1.1


Basal PRL levels (μg/L)


138.4±21.6


671.4±161.9


2123±279


Tumor volume on MRI (mm3)


113.0±15.1


1145±145


2826±330


Symptoms (%)


Secondary or Primary Amenorrhea1


53.3%


72.7%


66.7%


Oligomenorrhea1


46.7%


18.2%


0%


Gynecomastia2


100%


60%


33.3%


Galactorrhea


42.8%


60%


33.3%


Visual field defects


0%


50%


66.7%


Headache


33.2%


80%


66.7%


Calculated only in 1girls or 2boys.


Impairment of other pituitary hormone secretion was reported to occur in a minority of patients at diagnosis (44, 51, 53, 58), and in some patient’s hypopituitarism developed after surgery. In a more recent analysis (59), we can confirm that only a minority of patients bearing large adenomas had a severe degree of hypopituitarism, while a very few patients with either microadenomas or enclosed macroadenomas had isolated hormone deficiency (Fig. 6). Macroadenomas at presentation are more likely in boys than in girls (37, 38, 44, 53, 60). In our series (57), microprolactinoma and enclosed macroadenomas were more frequent in females with a ratio of 1.7:1 while large macroprolactinomas were 2 times more frequent in males (Table 2).

Figure 6. Prevalence of pituitary deficit according with prolactinoma size in 50 patients at diagnosis. Data from ref. (57).

Hyperprolactinemic patients have a decrease in bone mineral density (BMD), and progressive bone loss has been demonstrated in untreated patients (61). Young hyperprolactinemic men were shown to have a more severe impairment of BMD than patients in whom hyperprolactinemia occurred at an older age (62). In 20 patients with diagnosis of hyperprolactinemia during adolescence, we found (63) significantly lower BMD values in adolescents than in young adult patients with hyperprolactinemia. This finding was confirmed in a large cohort of patients (57). In 22 patients all having a diagnosis of prolactinomas before the age of 18 yrs, the bone mineral density (BMD) in the lumbar spine was significantly lower than in age-matched controls (Fig. 7). The use of drugs to increase bone mass, such as amino bisphosphonates, has not been investigated.

Figure 7. Bone density (BMD) measured as g/cm2 or z-score in 22 patients with prolactinoma (individual data shown as solid circles) and their sex- and age-matched controls (data shown as mean ± SD). Data from ref. 52, modified from ref. (57).

The diagnosis of prolactinoma is based on the measurement of serum PRL levels and neuroradiological imaging. The differential diagnosis of hyperprolactinemia should consider any process interfering with dopamine (DA) synthesis, its transport to the pituitary gland, or its action at lactotroph DA-receptors. A single measurement of PRL levels is unreliable since PRL secretion is markedly influenced by physical and emotional stress. Basal PRL levels greater than 200ng/l are diagnostic, whereas levels between 100 and 200ng/ml and the presence of a mass requires additional investigation to rule out mass an effect of a non-functioning adenoma versus a prolactin- secreting adenoma. Some peculiar conditions should, however, be remembered (64). Serial serum PRL measurements at 0, 30 and 60 min after the needle was inserted into an antecubital vein is a valuable and simple measure to identify stress- related hyperprolactinemia in order to avoid diagnostic pitfalls and unnecessary treatments. It is important to exclude from the assay the monomeric PRL forms, big-prolactin (b-PRL), and big big- prolactin (bb-PRL); the latter may contain immunoglobulin (IgG) (65). These molecular complexes are seldom active but may be measured by the PRL assay. The absence of a clinical syndrome of hyperprolactinemia will suggest the presence of macroprolactin. The ‘high-dose hook effect’ can be a serious problem in the differential diagnosis between prolactinomas and non-functioning adenomas (NFPA): it is mandatory, in these cases and in every patient with a pituitary mass and hyperprolactinemia, to dilute PRL samples routinely (1:10 and 1:100 dilutions) or to use alternative methods to immunoradiometric assays. The difference between macroprolactinomas and ‘pseudoprolactinomas’ is essential to provide a correct treatment approach (66). This problem is, however, of little relevance in children and adolescents, as non-functioning macroadenomas are very rare at this age.


Treatment Strategy


The goals of prolactinoma treatment are the control of PRL excess and its clinical consequences, and the removal of pituitary adenoma. Today dopamine-agonists (e.g., bromocriptine, quinagolide, or cabergoline) should be considered the first treatment approach for pediatric prolactinomas (34, 44, 51-53, 59, 60). According to a recent study, dopamine-agonists should be started immediately at prolactinoma diagnosis even in case of severe visual impairment. If there are no improvement in visual defects and serum prolactin levels in the first 24-hours, early surgical treatment should be considered to avoid further visual deterioration and radiological signs of progression. The efficient use of dopamine-agonists reduces the necessity of surgical approach (52).


Situations requiring first-line neurosurgery typically occur in invasive macroadenomas: in these cases, the aim is resecting the tumor to relief the mass effect. Anyway, in these cases surgical cure usually cannot be obtained so medical therapy after debulking neurosurgery is required, with the benefit of a better response to anti-dopaminergic therapy due to the cytoreduction (67).


Treatment with dopamine-agonists is effective in normalizing PRL levels and shrinking tumor mass in the majority of adult patients with prolactinomas (34, 44, 51-53, 59, 60), preserving pituitary function and visual field in most cases (51). In children and adolescents, bromocriptine has been used successfully by several investigators (51, 68-71). In our series, bromocriptine at doses ranging from 2.5-20 mg/day orally normalized prolactin in 38.5% of patients (51). In the remaining patients, 10 with macro- (Fig. 8) and 6 with microprolactinoma (Fig. 9), PRL levels remained above the normal range despite a progressive increase of the dose of the drug. However, the possibility that some patients were indeed not taking bromocriptine appropriately cannot be ruled out as poor compliance to any chronic treatment is a well-known phenomenon in children and adolescents. In addition, some patients required drug discontinuation for intolerable side effects regarding the gastrointestinal tract. Both quinagolide, at doses ranging from 0.075-0.6 mg/day, or cabergoline, at doses ranging from 0.5-3.5 mg/week orally, two selective DA receptor subtype-2 selective agonists, have been reported to be effective in reducing PRL secretion and tumor size in most adult patients with prolactinoma, even in those previously shown to be poorly responsive or intolerant to bromocriptine (57). There are now data on cabergoline, showing that it is more effective and often better tolerated than bromocriptine, due to less and milder side effects. For these reasons cabergoline should be the initial treatment of choice.

Figure 8. Serum PRL response to different dopaminergic drugs, namely bromocriptine (BRC), quinagolide (CV), and cabergoline (CAB) in 15 children with macroprolactinomas. The shaded area represents the normal PRL range. Data are shown as nadir PRL values at diagnosis and during treatment. Data from ref. 51.

Figure 9. Serum PRL response to different dopaminergic drugs, namely bromocriptine (BRC), quinagolide (CV), and cabergoline (CAB) in 11 children with microprolactinoma. The shaded area represents the normal range. Data are shown as nadir PRL values at diagnosis and during treatment. Data from ref. (51).

Of our 50 cases (57), cabergoline induced normalization of PRL levels in all but 3 cases. Two of the three patients had large extrasellar macroprolactinomas (tumor volume of 4579 mm3 and 1983 mm3 respectively) with baseline PRL levels of 3300 μg/L and 1700 μg/L, respectively that progressively decreased but did not normalize after 2-7 years of treatment. Tumor shrinkage by 93.2% and 54.5% was seen in both patients. The third patient had a microprolactinoma (tumor volume=123.6 mm3) with a baseline PRL levels of 500 μg/L that progressively decreased to 88 μg/L at the last follow-up after 6 years of treatment and achieved tumor shrinkage by 53.9% (57). Only one case of pituitary apoplexy following cabergoline treatment in a young patient has been reported so far (72). Twelve of our 50 patients (one with enclosed macroprolactinoma and 11 with microprolactinoma) achieved the disappearance of the tumor so that they were withdrawn from treatment (57). In our former series, tumor shrinkage was observed in most patients with macroadenomas and even in some with microprolactinomas (Fig. 10). The easy weekly administration makes cabergoline an excellent therapeutic approach to children/adolescents with prolactinoma. Cabergoline has been reported to be tolerated, even at rather high doses (73). Relevant safety issues to be considered in patients treated with cabergoline are possible cardiac valve derangement (74-76) and psychiatric adverse effects (mood changes or obsessive behavior including hypersexuality). These phenomena were first described in patients with Parkinson’s disease, who require higher doses of the dopamine agonists than patients with prolactinomas, but has now been documented in patients with pituitary adenomas as well. Cardiac safety of treatment with cabergoline in prolactinomas, even long-term, has been demonstrated in adults (77, 78), so use in children should also be safe, although we need to be aware of cumulative dose builds up if treatment has been started in childhood. Knowledge about psychiatric consequences of dopamine agonists used in pediatric prolactinomas is still scant. Psychotic symptoms during bromocriptine therapy were observed in a child by Hoffman et al. (52). Bulwer et al. also described a case of an adolescent male with a giant prolactinoma who developed impulsive/compulsive sexual symptoms during cabergoline treatment. These were diagnosed as an iatrogenic effect, a hypothesis supported by symptomatic improvement during a one-month trial off cabergoline (79). Despite the rarity of both pediatric prolactinomas and development of psychiatric side effects of dopamine agonists, this important aspect it needs to be further investigated.


In patients with tumors resistant to dopamine agonists as well as in those showing severe neurological symptoms at diagnosis, surgery is indicated. Radiotherapy should be limited to the cases with aggressive tumors, non-responsive to dopamine agonists, because of the risk of neurological damage, hypopituitarism, and second malignancies later in the lives of these patients (44, 51-53, 57).

Figure 10. Tumor mass response after bromocriptine, quinagolide, or cabergoline treatment in 15 children with macro- and 11 with microprolactinoma. Data are shown as number of cases with empty sella; greater than 50% tumor shrinkage; 20-50% tumor shrinkage or less than 20% tumor shrinkage shown as unmodified tumor volume. Data from ref. (57).

ACTH-SECRETING ADENOMAS


Cushing's disease (CD), caused by an ACTH-secreting pituitary corticotroph adenoma, is the commonest cause of Cushing’s syndrome (CS) in children over 5 years of age (80, 81). CS can occur throughout childhood and adolescence; however, different etiologies are commonly associated with particular age groups with CD being the commonest cause after the pre-school years. The peak incidence of pediatric CD is during adolescence (81). A macroadenoma is rarely the cause of CD in children; pediatric CD is almost always caused by a pituitary microadenoma with diameter <5 mm with a significant predominance of males in pre-pubertal patients (80, 81).


The molecular basis of pediatric Cushing’s disease is complex. Recently, pathological variants of USP8 gene have been found in an elevated number of ACTH-secreting adenomas; in the pediatric population USP8 mutated adenomas are clinically distinguished from wild-type adenomas for older age at diagnosis, female preponderance, and more frequent recurrence. In USP8 wild-type adenomas, BRAF and USP48 mutations have been noted. In pediatric corticotrophinomas, the presence of copy number variations, indicating chromosomal instability, has been related to larger size and more frequent invasion of the cavernous sinus (82).


There are other extremely rare germline conditions that can predispose to the development of pediatric corticotrophinoma such as DICER1, CABLES1, and CDKN1B mutations. DICER1 syndrome is characterized by pituitary blastomas, and manifest itself in early infancy with a highly deadly Cushing’s syndrome. CABLES1 is another potential ACTH-secreting adenoma predisposition gene, whose mutation has been found in very few pediatric cases. CDKN1B mutation occurs in the MEN4 syndrome, in which pituitary tumors arise usually in adults, as no gene mutations have been found analyzing children bearing a pituitary adenoma (82).


Clinical Presentation and Diagnosis


The clinical manifestations of CD are mostly the consequence of excessive cortisol production. The clinical presentation is highly variable, with signs and symptoms that can range from subtle to obvious (Table 1). The diagnosis is generally delayed since a decrease in growth rate may be the only symptom for a long time. Growth failure in CD may be due to a decrease of free IGF-I levels and/or a direct negative effects of cortisol on the growth plate (83, 84). In a series of 50 children with CD, Magiakou et al. (85) found that obesity and growth retardation were the most frequent symptoms (in 90 and 83% of patients, respectively). Weight gain and stunted growth were the most frequent symptoms also in the series by Weber et al. (86) and Devoe et al. (87). The skin of the face is plethoric, and atrophic striae can be found in the abdomen, legs, and arms. Muscular weakness, hypertension, and osteoporosis, especially of the spine, are common. Results on BMD or bone metabolism in children with CD have been reported only in a limited number of patients in a few studies (86, 88). Consistent with the findings in adult patients, marked osteopenia was also found in affected children. The bone loss is more evident in trabecular than in cortical bone (89). As compared to patients with adult-onset disease, those with childhood-onset CD have a similar degree of bone loss at the lumbar spine and similar increased bone resorption (90). In a study conducted in 10 patients with childhood-onset and 18 with adulthood-onset CD, BMD at the lumbar spine was significantly lower than in sex and age-matched controls (Fig. 11) (90). Osteoporosis was found in 16 patients (57.1%) (8 adolescent (80%) and 8 adult (44·4%) patients) while osteopenia was found in 12 patients (42.8%) (2 adolescent (20%) and 10 adult (55·6%) patients) (90). Additionally, we have reported that two years of cortisol normalization improved but did recover bone mass and turnover neither in children nor in adult patients with CD (91). This negative finding suggests that a longer period of time is necessary to restore bone mass after the cure of CD and, thus, other therapeutic approaches may be indicated to limit bone loss and/or accelerate bone recovery in these patients (87). In a study Lodish et al. (92) analyzed retrospectively, 35 children with CD; in these patients, vertebral BMD was more severely affected than femoral BMD and this effect was independent of degree or duration of hypercortisolism. BMD for the lumbar spine improved significantly after TSS; osteopenia in this group may be reversible. Complete reversal to normal BMD was not seen.

Figure 11. Z score of bone density at lumbar spine in 10 patients with childhood onset Cushing’s disease compared to 10 healthy adolescents of matched sex- and age and in 18 patients with adult-onset Cushing's disease compared to 18 healthy adults matched sex- and age. Data from ref. (90).

Hypercortisolism leads to decreased bone formation through direct or indirect inhibition of osteoblast function, while bone resorption is normal or increased in patients with CD (90, 93). Hypercortisolism is known to be associated with loss of skeletal mass and can lead to increased vertebral fracture risk (94, 95). It should also be noted that in children with CD the direct negative effect of hypercortisolism on bone formation is further worsened by concomitant hypogonadism and GH deficiency, both of which are associated with decreased BMD. Children with CD often have musculoskeletal weakness and can have decreased weight-bearing activity that may contribute to impaired BMD.


Children with CD may also have impaired carbohydrate tolerance, while overt diabetes mellitus is uncommon. Excessive adrenal androgens may cause acne and excessive hair growth, or premature sexual development in the first decade of life. On the other hand, hypercortisolism may cause pubertal delay in adolescent patients. Peculiarly, young patients with CD may present neuropsychiatric symptoms which differ from those of adult patients. Frequently, they tend to be obsessive and are high performers at school.


The differential diagnosis of CD includes adrenal tumors, ectopic ACTH production, and the very rare ectopic CRH-producing tumors. However, ectopic ACTH secretion is extremely rare in the pediatric age. In a child/adolescent with suspected CD the diagnosis is based on measurement of basal and stimulated levels of cortisol and ACTH. Measurement of 24-h urinary free cortisol is elevated, and a low dose of dexamethasone (15 μg/Kg) at midnight does not induce suppression of morning serum cortisol concentrations as in normal subjects (96). Loperamide, an opioid agonist, lowers cortisol secretion and has been proposed as a reliable screening test for hypercortisolism in children and adolescents (97) , but has not achieved popular use. Suppression of the spontaneous circadian variations of serum cortisol is another feature of CD. Suppression of cortisol by more than 50% after high-dose dexamethasone (150 μg/kg) given at midnight will confirm that hypercortisolism is due to an ACTH-secreting pituitary adenoma (97). Midnight salivary cortisol measurements have been suggested as an alternative non-invasive screening test in the diagnosis of CS in adults(98), but is there is not much experience of its use in this age group.


All patients should undergo pituitary MRI with the administration of gadolinium, but since ACTH- secreting pituitary adenomas are significantly smaller than all other types of adenomas, often having a diameter of 2mm or less (99), pituitary MRI may fail to visualize the tumor. In most instances the diagnosis of CD can be made by initial clinical and laboratory data (Fig.12). Bilateral inferior petrosal sinus sampling has a high specificity, so that no patient with extra-pituitary CS runs the risk of being submitted to transsphenoidal surgery, but it carries a significant number of false negative results (99). This procedure can also be technically difficult in children, and the risk of morbidity from surgery and/or anesthesia must be considered.


Lateralization of the adenoma can be of greater help to the surgeon than pituitary scanning (100). Therefore, bilateral venous sampling should only be performed in centers with wide experience in the technical procedure as well as in the interpretation of the results. If a patient without anomalous venous drainage patterns exhibits a lateralizing ACTH gradient of 2:1 or greater (101, 102), removal of the appropriate half of the anterior pituitary gland will be curative in 80% of cases (99). Kunwar and Wilson (99) reported that in the presence of a negative surgical exploration, a guide to the probable location of the adenoma is invaluable, and under the right circumstances, a hemi-hypophysectomy is appropriate and successful in most cases.

Figure 12. The diagnosis of Cushing’s syndrome. LDST, low dose suppression test; HDST, high dose suppression test; CRH, corticotrophin releasing hormone. Data from ref. (36).

Treatment Strategy


The goal of the treatment of Cushing’s disease are normalization of cortisol levels, reversion of hypercortisolism-related signs and symptoms, and pituitary adenoma removal. Transsphenoidal adenomectomy is the treatment of choice for ACTH-secreting adenomas in childhood and adolescence, because of the greater prevalence of microadenomas in this population that allows for total tumor removal and thus disease remission. Radiotherapy could be the first-line treatment in children with surgical contraindications (103). Transsphenoidal microsurgery is considered successful when it is followed by remission of signs and symptoms of hypercortisolism and by normalization of laboratory values. Surgical excision is successful in the majority of children, with initial remission rates of 70-98% and long-term cure of 50-98% in most studies (38, 39, 80, 81, 84, 86, 87, 104-109). The success rate decreases when the patients are followed-up for more than 5 years (84, 86, 87), and the outcome cannot be predicted either by preoperative or immediate postoperative tests (87). Surgical cure was found in 59% of 27 patients over a 21-year period, with a higher age favoring cure, as did an identifiable tumor seen at surgery and positive histology (110). Several conditions are indeed predictors of Cushing’s disease recurrence in children: older age at the time of disease symptoms, younger age at the time of surgery, larger tumor diameter, and mutations in USP8 gene in resected tumor tissue (111).The recurrence rate of Cushing’s disease in children in about 40% in 10 years (67).

Noteworthy in pediatric patients there are several technical difficulties with the transsphenoidal surgical approach due to a different anatomic conformation in children compared to adults. In children, the smaller size of the sella and pituitary may interfere with surgical maneuvers, in addition to the difficult identification of surgical landmarks due to different anatomic variations of sellar region such as the shorter intercarotid distance and piriform aperture, and the low pneumatization of sphenoid bone. Furthermore, in children with skull base lesions short nasal-sellar and vomer-clivus distances and smaller transsphenoidal angles than healthy children have been noted (112).


Surgery is usually followed by adrenal insufficiency and patients require hydrocortisone replacement for 6-12 months. After normalization of cortisol levels, resumption of normal growth or even catch-up growth can be observed. Generally, final height is compromised compared to target height (68, 85). Johnston et al. (113) have, however, reported that some children do achieve a normal final stature. However, even if catch-up and favorable long-term growth can be achieved after treatment for Cushing's disease, post-treatment GH deficiency is frequent (114). Lebrethon et al. (114) demonstrated that early hGH replacement may contribute to a favorable outcome on final stature (Fig.13). A re-analysis of this series confirmed that pediatric Cushing’s disease patients achieve a normal final stature provided that replacement therapy including GH is correctly performed (115). Normal body composition is more difficult to achieve. Many patients remain obese and BMI SDS was elevated at mean interval of 3.9 years after cure in 14 patients (115).


Rarely, surgery may induce panhypopituitarism, permanent diabetes insipidus, and cerebrospinal fluid leak (46); transient diabetes insipidus, and cerebrospinal fluid leak occur more frequently in pediatric patients than adults (116). Probably such a higher prevalence may be due to technical difficulties related to the anatomy of pediatric sellar region. Cure is more likely to be achieved and morbidity is low if the surgery is performed by an experienced neurosurgeon, by analogy with other studies performed in acromegaly (113).

Figure 13. GH treatment in children with Cushing’s disease improves the height gain. Upper graph: Evaluation of growth (change (D) in height SD score) in eight patients during hGH treatment. Bottom graph: Individual changes of height standard deviation score before and after GH replacement. 1= At diagnosis; 2= Before GH treatment; 3= After 1 year of GH treatment; 4= Final height. Data drawn from ref. (114).

In recent times, the endonasal approach, consisting in a direct access of neurosurgeon to the sellar region through the patient’s nares, has also been used in pediatric Cushing’s disease, usually using an endoscope aiming to improve surgical visualization. However, because of small patients’ nares, an expert neurosurgeon is required (112). Nowadays, while there is little evidence of this less invasive technique are available, it seems to be an effective treatment for pediatric CD, without relapses observed in treated patients (109, 117, 118). However, no studies comparing microscopic and endoscopic endonasal technique in pediatric pituitary adenomas are available (67).


The treatment modality in patients who have relapses after transsphenoidal adenomectomy is still controversial. Some authors recommend repeat surgery (84, 119), while others favor radiotherapy (120, 121). Transsphenoidal surgery is actually suggested as a second-line treatment in recurrent or persistent CD patients (103), and is required in case of incomplete initial tumor removal, in patients with tumor reappearance after initial complete surgical resection, or even in persistent patients in the days immediately after first TSS aiming to optimize therapeutic efficacy (116). The efficacy of a second surgical treatment in Cushing’s pediatric disease is still unclear, due to the presence in literature of only single case reports, or case series. Interestingly, in one of this case series Lonser et al. reported an initial diseaseremission in 93% of patients (122).


Radiotherapy techniques currently used for pediatric corticotrophinomas are divided in two groups: conventional radiotherapy (RT) and stereotactic RT. Conventional RT, in which small, daily radiation doses are delivered to the target tumor over a 25-30 days period, and stereotactic RT, where high radiation doses are delivered to a more precisely identified target area, minimizing radiation exposure to the surrounding central nervous system structures. Stereotactic RT could be performed as a single treatment, called stereotactic radiosurgery such as gamma-knife radiosurgery, or as a fractionated treatment, called stereotactic conformal radiotherapy.


Disease remission using conventional radiotherapy is reached by about 80% of pediatric corticotrophinoma (113, 121, 123-127). Conventional RT is a safe treatment, as no nerve damage or other major complications were observed in treated patients. Compared to adults with Cushing’s disease treated with Conventional RT as a second-line treatment, this seems to be slightly more effective in pediatric corticotrophinoma (116). There are only two studies concerning gamma-knife radiosurgery in the pediatric population, reporting a remission rate of 87.5 % and 79.2%, respectively (128, 129). Radiotherapy usually requires time before reaching its maximum result, and for this reason pharmacotherapy could be considered as a temporary treatment until this achievement (103, 116). Of note, hypothalamo-pituitary dysfunction is an early and frequent complication of radiation (87).


For the medical therapy of Cushing’s disease, three pharmacological categories are currently available: pituitary-directed agents, adrenal-directed agents, and glucocorticoid receptor antagonists. Scientific evidence regarding their use in pediatrics is scant, and there are no data on the use of mifepristone in pediatric patients.


Data on the use of etomidate, an adrenal-directed agent, in the emergency management of severe hypercortisolemia seems to be promising. There are at least 3 case reports demonstrating that intravenous infusion of etomidate at doses ranging from 1 to 3.5 mg/h, with constant dose titration according to serum levels, adding contemporaneous hydrocortisone infusion at 0.25-0.5 mg/kg/h to prevent adrenal insufficiency is a safe and effective approach in patients with very severe Cushing’s disease prior to bilateral adrenalectomy (130-132).


Moreover, experience with cabergoline for CD in childhood and adolescence is also limited (133). Bilateral adrenalectomy is actually a third-line treatment, employed in cases of surgical and radiotherapeutic failures. This therapeutic approach has gradually lost his importance in the context of pediatric corticotrophinoma treatment, due to the side effects and the growing evidence of pharmacological treatment as valid therapeutic alternative (116, 119).


It is interesting that in pediatric Cushing’s disease patients, in contrast to adult ones, there does not appear to be complete recovery from cognitive function abnormalities despite rapid reversibility of cerebral atrophy (134).


GH-SECRETING ADENOMAS


GH excess derives from a GH-secreting adenoma in over 98% of cases. In adulthood, these adenomas are relatively rare with an incidence of 1.1 new cases/100,000 individuals per year, and a prevalence from 3 to >13 cases per 100,000 individuals according to the country under study (135) , while gigantism is extremely rare with a little bit more than 400 reported cases to date (136, 137). In childhood, GH-secreting adenomas account for 5-15% of all pituitary adenomas (138). In less than 2% of the cases excessive GH secretion may depend on a hypothalamic or ectopic GH releasing hormone (GHRH)-producing tumor (gangliocytoma, bronchial or pancreatic carcinoid), which causes somatotroph hyperplasia or a well-defined adenoma (139-142).


Nowadays, approximately 50% of patients with pituitary gigantism have a known genetic mutation causing the disease, so genetic counselling should be considered (143). In this genetic context, pituitary gigantism could be part of syndromic, or non-syndromic disease. Recently, non-syndromic pituitary gigantism has been described due to aryl hydrocarbon receptor-interacting protein (AIP) gene mutations and Xq26.3 microduplication causing X-linked acrogigantism (XLAG) (144-146). AIP mutations occur in about 40% of gigantism cases, sporadically or in the setting of familial isolated pituitary adenoma (FIPA)., and patients with truncating AIP mutation had a younger age at disease onset and diagnosis, compared to patients with non-truncating AIP mutation (146).


Typically, AIP-mutated adenomas bear several features: early disease is manifest usually in the second decade of life, the majority of the cases are GH- or mixed GH/prolactin-secreting pituitary adenomas (144, 146), the tumors are large and invasive, often with suprasellar extension, resistance to first-generation SSA treatment is common, thus require a multimodal treatment and pituitary apoplexy can often occur, especially in pediatric patients (82, 137, 146). Interestingly, AIP-mutated patients with GH excess had been shown to be taller than the non-mutated counterparts (147).


XLAG represents 10% of the cases of pre-pubertal gigantism (143). X-LAG is due to a submicroscopic chromosome Xq26.3 duplications that include GPR101 gene, which is differentially overexpressed in the affected pituitary adenoma (82, 148). Duplications are germline in females and somatic in sporadic males with variable levels of mosaicism in the latter (82). Somatic mosaicism occurs in sporadic males but not in females with XLAG syndrome, although the clinical characteristics of the disease are similarly severe in both sexes (148). Three rare case of families in which the germline duplication was transmitted from the affected mother to son have been described, and all carriers of the duplication had gigantism (149). The disease often occurs during the first year of life, mostly in females and as sporadic disease.


Regarding the characteristics of the pituitary gland at diagnosis in these patients, most of them harbor macroadenomas, generally mixed GH- and PRL-secreting tumors, while a minority have hyperplasia alone (82, 137, 145). A pattern of multiple microadenomatous foci against a hyperplastic background has also been described (82).Noteworthy is the peculiar presence of acromegalic features in these pediatric patients, and a poor response to SSA treatment such as AIP-mutated somatotrophinomas (82).


Concerning syndromic pituitary gigantism, Carney Complex and McCune-Albright syndromes contribute to gigantism approximately in 1% and 5% respectively, where pituitary hyperplasia or a distinct pituitary adenoma could be found in the pituitary gland (82, 143). GH-secreting adenomas may also occur in MEN1 syndrome and cause 1% of cases of pituitary gigantism; the possibility of pituitary hyperplasia due to GHRH hypersecretion from neuroendocrine tumor should be considered in this syndromic context (143).


Somatotrophinomas could also be one of the manifestations of the MEN4 syndrome and the pheochromocytoma/paraganglioma and pituitary adenoma association (82) (151).

GH excess and consequent gigantism could be a rare manifestation of NF-1 syndrome, characterized by the presence of optic pathway gliomas but not pituitary adenomas, in addition to the characteristic syndromic manifestations. In this case it can be speculated that GH secretion could be either due to loss of somatostatinergic inhibition or presence of excessive GHRH secretion due to disrupted regulation of GHRH by the optic pathway tumor (82).


Clinical Presentation and Diagnosis


In adults, chronic GH and IGF-1 excess causes acromegaly, which is characterized by local bone overgrowth, while in children and adolescents leads to gigantism. The associated secondary hypogonadism delays epiphysial closure, thus allowing continued long-bone growth (Fig.14). However, the two disorders may be considered along a spectrum of GH excess, with principal manifestations determined by the developmental stage during which such excess originates (Table 1). Supporting this model has been the observation of clinical overlap between the two entities, with approximately 10% of acromegalics exhibiting tall stature (150), and the majority of giants eventually demonstrating features of acromegaly (151).


Gigantism predominantly affects males (78%), is generally characterized at diagnosis by the presence of a macroadenoma, often invading surrounding structures (54.5%), and prolactin co-secretion is present in 34% of pituitary adenomas causing pituitary gigantism (143). As demonstrated, older age at diagnosis, and the consequent longer time of exposure to higher GH and IGF-1 levels than normal, is associated with an increased prevalence of many pathological signs and symptoms, particularly those related to longer-term exposure such as joint disease, facial changes, skin changes, and diabetes mellitus (136, 143). In contrast to adults where there is an increased prevalence of cardiovascular, respiratory, neoplastic, and metabolic complications (136, 141, 152), there is no report of similar complications in childhood.


In our study, we did not find any patient with hypertension, arrhythmias, diabetes or glucose intolerance; as expected, however, some degree of insulin resistance and enhanced ß-cell function was observed in our patients at diagnosis (153). In a study conducted in six patients with gigantism, Bondanelli et al. (154) showed that 33% of giant patients had left ventricular hypertrophy and inadequate diastolic filling, 16.7% had isolated intraventricular septum thickening and impaired glucose metabolism. In acromegaly, clinical features develop insidiously and progressively over many years and in modern epidemiological studies the average delay between the onset of symptoms and diagnosis is approximately 5 years (135), while the presentation of gigantism is usually dramatic and the diagnosis is straightforward. All growth parameters are affected although not necessarily symmetrically. Mild-to-moderate obesity occurs frequently (138), and macrocephaly has been reported to precede linear and weight acceleration in at least one patient (155). All patients also had coarse facial features, disproportionately large hands and feet with thick fingers and toes, frontal bossing and a prominent jaw (138). In girls menstrual irregularity can be present (156) while glucose intolerance and diabetes mellitus are rare. Tall stature and/or acceleration of growth velocity was observed in 10 of 13 patients. Headache, visual field defects, excessive sweating, hypogonadism, and joint disorders may also be present (143). Several cases of ketoacidosis have been reported(157, 158).


The diagnosis of acromegaly and gigantism is usually clinical, and can be readily confirmed by measuring GH levels, which in more than 90% of patients are above 10 μg/l (139-141). The oral glucose tolerance test (OGTT) is the simplest and most specific dynamic test for both the diagnosis and the evaluation of the optimal control of GH excess (139-141). In healthy subjects, the OGTT (75-100 grams) suppresses GH levels below 1 μg/l after 2 hours, while in patients with GH-secreting adenoma such suppression is lacking, and a paradoxical GH increase is frequently observed. GH excess should be confirmed by elevated circulating IGF-I concentrations for age and gender (159, 160). The assay of IGF-I binding protein-3 is conversely not useful for diagnosis nor for the follow-up of the patients (161, 162). The presence of different GH isoforms in patients with gigantism/acromegaly may represent a diagnostic problem (163). A greater sensitivity of the GH assay may facilitate the distinction between patients and normal subjects, as shown by the use of a chemiluminescent GH assay (164). It might help in demonstrating the persistence of GH hypersecretion after surgery or during medical therapy. In cases of clinical and laboratory findings suggestive of a GH-producing adenoma, pituitary MRI must be performed to localize and characterize the tumor (141-143) (Fig. 15).


Figure 14. The patient’s growth and weight chart with normal growth and weight curves (solid lines, 5th, 50th, 75th, and 95th percentile). Measurements subsequent to therapeutic intervention. Reproduced from (165), with permission.

Figure 15. The extent of tumor invasion as visualized with coronal and lateral MRI views and their outlines. Reproduced from (165) with permission.

Treatment Strategy


The objectives of treatment of GH excess are tumor removal with resolution of its eventual mass effects, restoration of normal basal and stimulated GH secretion, relief of symptoms directly caused by GH and IGF-1 excess, and prevention of progressive disfigurement, bone expansion, osteoarthritis and cardiomyopathy which are disabling long-term consequences, as well as prevention of hypertension, insulin resistance, diabetes mellitus and lipid abnormalities that are risk factors for vascular damage (139-141). The currently available treatment options for pituitary gigantism include surgery, radiotherapy, and pharmaco-therapeutic suppression of GH levels.


For pituitary gigantism treatment, combination therapy is often necessary due to the aggressiveness of the disease, and the consequent low rate of primary control using both surgical and medical first approach, 26 % and 4% respectively (143). Satisfactory results are obtained in the treatment of hyperprolactinemia using dopamine agonists in prolactin co-secreting adenomas.


Transsphenoidal adenomectomy is the cornerstone in the treatment of GH-secreting tumors, and is a valid first-line therapeutic option (143). In pediatric patients with gigantism, transsphenoidal surgery was found to be as safe as in adults (166), although some technical difficulties exist due to the different anatomic conformation in children compared to adults as previously reported in the ACTH-secreting adenoma section. The surgical approach can be difficult in McCune-Albright syndrome patients due to the fibrous dysplasia in the surrounding tissue.


In patients with intrasellar microadenomas, surgical removal provides biochemical control with normalization of IGF-I in 75–95% of patients (167, 168). In case of macroadenomas, particularly when they exhibit extrasellar growth, transcranial approach might be requested, and persistent postoperative hypersecretion of GH occurs frequently. Despite this, tumor debulking contributes to improving disease control using medical therapy (143). In most surgical series, only about 60% of acromegalic patients achieve circulating GH levels below 5 μg/l (169-173), with better success score when the neurosurgeon is skilled in pituitary surgery (169, 170).


Concerning gigantism, for medical treatment it is necessary to consider that several drugs used for acromegaly are not formally studied in children, and for those employed drug-dosing is labelled for adults and might not be directly applicable in pediatric patients. Treatment with somatostatin analogues can be effective in patients with GH excess (150, 174, 175), although limited data are available in adolescent patients. Octreotide given subcutaneously in two patients was shown to inhibit GH levels and reduce growth velocity (176, 177). Of interest, in adolescents, as in adults, we observed tumor shrinkage by 30% on average after first-line treatment with somatostatin analogues. Whether this treatment has facilitated the subsequent surgical approach in this series could not be ruled out because of the limited number of cases studied. Treatment was tolerated very well by all patients (153).


 As about one third of patients had concomitant hyperprolactinemia and combined treatment with dopaminergic compounds such as cabergoline and somatostatin analogues, may be necessary.


In another case of a 15 yr-old girl with a mixed GH/PRL-secreting adenoma (165), octreotide-LAR (at the dose of 20 mg/28 days) combined with cabergoline (at the dose of 0.5 mg twice/week) normalized serum GH and IGF-I levels, and decreased growth rate from 12 cm/yr to nearly 2.5 cm/yr. This association has be proven to be effective also in an adolescent bearing a somatotropinoma in the context of McCune-Albright syndrome (178). In seven of the eight hyperprolactinemic patients included in our study, combined treatment with octreotide plus bromocriptine or octreotide-LAR or lanreotide plus cabergoline was effective and well tolerated by all patients. Only two patients (15.4%) of the entire series still presented with active acromegaly after treatment with surgery and pharmacotherapy with somatostatin analogues plus dopamine-agonists(153).


Although long-acting somatostatin analogues have been shown to be effective and safe in pediatric patients, this therapy often fails to achieve disease control especially in the most frequent genetic forms of pituitary gigantism (AIP-mutated adenomas and X-LAG acrogigantism), which are characterized by poor responses to first generation SSAs. Recently the successful use of pasireotide LAR has been reported in two cases of AIP-mutated gigantism not controlled by surgery and first-generation somatostatin analogues, respectively. Pasireotide LAR allowed not only biochemical control but also the reduction of the pituitary adenoma volume. These patients developed pasireotide-induced diabetes, controlled by drug therapy (179).


The GH receptor antagonist pegvisomant is a very potent drug which has been introduced into clinical practice. In patients with resistant acromegaly, the use of the GH-receptor antagonist pegvisomant was followed by normalization of IGF-I levels in more than 80% of patients (180-182). However, there are few data related to pediatric patients. In a 12-year-old girl with tall stature (178 cm), bearing a GH/PRL-secreting macroadenoma inoperable since tumor tissue was fibrous and adherent to the optical nerves, the GH receptor antagonist at a dose of 20 mg/day completely normalized IGF-I levels (183). In a 3.4 year-old girl with a GH/prolactin-secreting adenoma, treatment with pegvisomant and cabergoline was effective to normalize IGF-I levels and height velocity without side effects (184). Combined therapy with the addition of pegvisomant to octreotide LAR rapidly allowed biochemical control in three children with pituitary gigantism, pituitary tumor size did not change despite concomitant therapy with a somatostatin analogue (185). The main limit of pegvisomant is the eventual adenoma size increase during treatment, requiring treatment suspension. Pegvisomant was successfully used also in the youngest known patient with AIP-related pituitary adenoma, in which despite of the previously transsphenoidal surgery, and the medical treatment after surgery with temozolomide, subsequently in addition to bevacizumab, IGF-1 was normalized only after pegvisomant treatment (186).


Radiation therapy is rarely used in pediatric patients, and is generally is considered only after the failure of both primary surgical and medical therapies, because of a maximum response is achieved 10–15 years after radiotherapy is administered (187, 188), and the involvement of surrounding structures in the radiation-induced damage. Radiation-induced damage of the surrounding normal pituitary tissue results in hypogonadism, hypoadrenalism, or hypothyroidism in most patients within 10 years (187), whereas complications such as optic nerve damage, cranial nerve palsy, impaired memory, lethargy, and local tissue necrosis have been reduced thanks to improved precise isocentric simulators and accurate dosing techniques. At long term follow-up, about 43% of patients with pituitary gigantism among who undergone to secondary radiotherapy have shown controlled GH and IGF-I levels (136). Noteworthy, as a consequence of the multiple operations and radiotherapy, 64% of patients develop hypopituitarism during long-term follow-up (143).


TSH-SECRETING ADENOMAS


This tumor type is rare in adulthood and even rarer in childhood and adolescence with only a few cases reported so far (189). Plurihormonal adenomas with GH and TSH co-secretion can also occur. It is frequently a macroadenoma presenting with mass effect symptoms such as headache, visual disturbance, together with variable symptoms and signs of hyperthyroidism (Table 1). TSH-secreting adenomas must be differentiated from the syndrome of thyroid hormone resistance (190). In most cases, the classical criteria of lack of TSH response to TRH stimulation, elevation of serum α-subunit levels, and a high α-subunit/TSH ratio along with a pituitary mass on MRI, are diagnostic of a TSH-secreting adenoma (190).


Treatment Strategy


Transsphenoidal surgery is the first treatment approach to these tumors. However, since the majority of these adenomas are macroadenomas, which tend to be locally invasive, surgery alone fails to normalize TSH and thyroid hormone levels in most cases. In adults, radiotherapy is recommended as routine adjunctive therapy when surgery has not been curative (190). However, due to the high frequency of post-radiotherapy hypopituitarism, in children pharmacotherapy is the preferred second choice. There is very little success with dopamine agonists for treatment of these tumors (191). In contrast, therapy with somatostatin analogues normalizes TSH levels in the majority of patients, and tumor shrinkage occurs in approximately half of cases (192-195) and shown be useful in children as well. Rabbiosi et al., first used lanreotide successfully as first-line treatment in a pediatric patient bearing a macroadenoma characterized by a low probability of complete surgical eradication due to its antero-superior extension. The response to medical treatment was optimal, with significant tumor shrinkage and development of central hypothyroidism after few months. Thus, suggesting that preoperative somatostatin analogue treatment used for tumor shrinkage may be helpful to prepare a hyperthyroid patient to surgery (189). Before this somatostatin analogue in the pediatric age had only been used in two post-pubertal boys (189). Chronic treatment with SR-lanreotide reduced plasma TSH and normalized fT4 and fT3 levels, suggesting its use in the long-term medical treatment of these adenomas (190, 195).


CLINICALLY NONFUNCTIONING ADENOMAS


Clinically non-functioning adenomas (NFAs) are extremely rare in childhood, compared with adults (196). Nonetheless, there is in vitro and in vivo evidence that almost all of these tumors synthesize glycoprotein hormones or their subunits (197, 198). In adults, NFAs represent 33-50% of all pituitary tumors, while in pediatric patients they account for less than 4-6% of cases (38, 40, 44), for this reason incidentally discovered adenomas in childhood are rare (199). In a study, 5 out of 2288 patients treated at Hamburg University between 1970-1996 were diagnosed to bear a clinically NFAs (196). In a most recent surgical series, 9 out 85 pituitary adenomas (10.6%) were NFAs in the pediatric group (107). Most silent adenomas arise from gonadotroph cells, the clinical presentation includes visual field defects, headache, and some degree of pituitary insufficiency since invariably all patients had a macroadenoma (Table 1). Recent data show that hypogonadism is the most frequent pituitary deficiency at diagnosis occurring in 71.4% of pediatric patients, followed by TSH deficiency (33.3%), and GH and ACTH deficiency (both 11.1%). No case of diabetes insipidus occurred in this pediatric series (107). Larger macroadenoma could also cause hydrocephalus due to the obstruction of foramen of Monro (199). A modest hyperprolactinemia can also be present due to pituitary stalk compression (196).


Treatment Strategy


The first approach to these adenomas, silent and even functioning, is transsphenoidal surgery to remove tumor mass and decompress parasellar structures. As in the other adenoma types, surgery has a low morbidity and leads to an improvement of visual symptoms in the majority of cases. Endoscopic endonasal unilateral transsphenoidal approach to the pituitary (204), which has the same indications as the conventional transsphenoidal microsurgery, overcomes many of the potential problems tied to the surgical route, thanks to its minimal invasiveness. This procedure involves no sublabial dissection nor any fracture of the facial bones with dental or naso-sinusal complications. Furthermore, a wider surgical vision of the operating field is obtained, which potentially improves the likelihood of a better and safer tumor removal. In addition, this procedure requires a shorter hospitalization, permits a rapid recovery of the child (205), and maintains neuroendocrine-pituitary integrity, with ensuing normal growth. This approach can also be safely used for the surgical removal of remnant pituitary tumors (206). After surgery these patients partially recover from hypopituitarism. Postoperative radiotherapy can be used in patients with subtotal tumor removal to prevent tumor re-growth and reduce residual tumors, but is burdened by a high prevalence of pan-hypopituitarism (207-209).


Medical therapy has poor effects on clinically non-functioning adenomas (197, 210), and data are from adults. A positive response to cabergoline associated with detection of dopamine receptors in vitro has been proven in clinically non-functioning adenomas (211). Positive effects of cabergoline were observed in some patients with α-subunit secreting adenomas, mostly in patients with tumors expressing high number of dopamine D2 receptors (212). Greenman et al. proved that dopamine agonists treatment in adult patients with NFAs is associated with decreased prevalence of residual adenoma growth after neurosurgery. A decrease in residual mass was observed in 38% of patients treated immediately after surgery, while a stable or enlarged residual adenoma was observed in 49% and in 13%, respectively. A significant shrinkage or stabilization of residual mass was achieved (58%) also in patients in which the administration of the same therapy was performed when residual growth was noted during the post-operative follow-up (213). In vitro, chimeric dopamine/SSTR agonists are effective in inhibiting cell proliferation in two-thirds of non-functioning adenomas (214). Somatostatin analogues and dopamine agonists have not been tested in children/adolescents with clinically non-functioning adenomas.


Concerning medical therapy for functioning gonadotroph adenomas, there is little published information in the literature about the use of dopamine agonists, somatostatin analogues, GnRH agonists, and antagonists in the pediatric age range (203).


REFERENCES


  1. Dattani, M.T. and I.C. Robinson, The molecular basis for developmental disorders of the pituitary gland in man. Clin Genet, 2000. 57(5): p. 337-46.
  2. Jagannathan, J., et al., Benign brain tumors: sellar/parasellar tumors. Neurol Clin, 2007. 25(4): p. 1231-49, xi.
  3. Karavitaki, N., et al., Craniopharyngiomas. Endocr Rev, 2006. 27(4): p. 371-97.
  4. Muller, H.L., Childhood craniopharyngioma. Pituitary, 2013. 16(1): p. 56-67.
  5. Muller, H.L., Craniopharyngioma. Endocr Rev, 2014. 35(3): p. 513-43.
  6. Larkin, S.J. and O. Ansorge, Pathology and pathogenesis of craniopharyngiomas. Pituitary, 2013. 16(1): p. 9-17.
  7. Bunin, G.R., et al., The descriptive epidemiology of craniopharyngioma. J Neurosurg, 1998. 89(4): p. 547-51.
  8. Matson, D.D. and J.F. Crigler, Jr., Management of craniopharyngioma in childhood. J Neurosurg, 1969. 30(4): p. 377-90.
  9. Schoenberg, B.S., et al., The epidemiology of primary intracranial neoplasms of childhood. A population study. Mayo Clin Proc, 1976. 51(1): p. 51-6.
  10. Kuratsu, J. and Y. Ushio, Epidemiological study of primary intracranial tumors in childhood. A population-based survey in Kumamoto Prefecture, Japan. Pediatr Neurosurg, 1996. 25(5): p. 240-6; discussion 247.
  11. Sekine, S., et al., Craniopharyngiomas of adamantinomatous type harbor beta-catenin gene mutations. Am J Pathol, 2002. 161(6): p. 1997-2001.
  12. Martinez-Barbera, J.P., Molecular and cellular pathogenesis of adamantinomatous craniopharyngioma. Neuropathol Appl Neurobiol, 2015. 41(6): p. 721-32.
  13. Goschzik, T., et al., Genomic Alterations of Adamantinomatous and Papillary Craniopharyngioma. J Neuropathol Exp Neurol, 2017. 76(2): p. 126-134.
  14. Brastianos, P.K., et al., Dramatic Response of BRAF V600E Mutant Papillary Craniopharyngioma to Targeted Therapy. J Natl Cancer Inst, 2016. 108(2).
  15. Himes, B.T., et al., Recurrent papillary craniopharyngioma with BRAF V600E mutation treated with dabrafenib: case report. J Neurosurg, 2018: p. 1-5.
  16. Borrill, R., et al., Papillary craniopharyngioma in a 4-year-old girl with BRAF V600E mutation: a case report and review of the literature. Childs Nerv Syst, 2019. 35(1): p. 169-173.
  17. Pekmezci, M., et al., Clinicopathological characteristics of adamantinomatous and papillary craniopharyngiomas: University of California, San Francisco experience 1985-2005. Neurosurgery, 2010. 67(5): p. 1341-9; discussion 1349.
  18. Stache, C., et al., Insights into the infiltrative behavior of adamantinomatous craniopharyngioma in a new xenotransplant mouse model. Brain Pathol, 2015. 25(1): p. 1-10.
  19. Ghirardello, S., et al., Diabetes insipidus in craniopharyngioma: postoperative management of water and electrolyte disorders. J Pediatr Endocrinol Metab, 2006. 19 Suppl 1: p. 413-21.
  20. Muller, H.L., Childhood craniopharyngioma--current concepts in diagnosis, therapy and follow-up. Nat Rev Endocrinol, 2010. 6(11): p. 609-18.
  21. Warmuth-Metz, M., et al., Differential diagnosis of suprasellar tumors in children. Klin Padiatr, 2004. 216(6): p. 323-30.
  22. Pusey, E., et al., MR of craniopharyngiomas: tumor delineation and characterization. AJR Am J Roentgenol, 1987. 149(2): p. 383-8.
  23. Tsuda, M., et al., CT and MR imaging of craniopharyngioma. Eur Radiol, 1997. 7(4): p. 464-9.
  24. Rossi, A., et al., Neuroimaging of pediatric craniopharyngiomas: a pictorial essay. J Pediatr Endocrinol Metab, 2006. 19 Suppl 1: p. 299-319.
  25. Jensterle, M., et al., Advances in the management of craniopharyngioma in children and adults. Radiol Oncol, 2019. 53(4): p. 388-396.
  26. Flitsch, J., J. Aberle, and T. Burkhardt, Surgery for pediatric craniopharyngiomas: is less more? J Pediatr Endocrinol Metab, 2015. 28(1-2): p. 27-33.
  27. Elliott, R.E., J.A. Jane, Jr., and J.H. Wisoff, Surgical management of craniopharyngiomas in children: meta-analysis and comparison of transcranial and transsphenoidal approaches. Neurosurgery, 2011. 69(3): p. 630-43; discussion 643.
  28. Bogusz, A. and H.L. Muller, Childhood-onset craniopharyngioma: latest insights into pathology, diagnostics, treatment, and follow-up. Expert Rev Neurother, 2018. 18(10): p. 793-806.
  29. Luu, Q.T., et al., Fractionated proton radiation treatment for pediatric craniopharyngioma: preliminary report. Cancer J, 2006. 12(2): p. 155-9.
  30. Yang, I., et al., Craniopharyngioma: a comparison of tumor control with various treatment strategies. Neurosurg Focus, 2010. 28(4): p. E5.
  31. Aylwin, S.J., I. Bodi, and R. Beaney, Pronounced response of papillary craniopharyngioma to treatment with vemurafenib, a BRAF inhibitor. Pituitary, 2016. 19(5): p. 544-6.
  32. Rostami, E., et al., Recurrent papillary craniopharyngioma with BRAFV600E mutation treated with neoadjuvant-targeted therapy. Acta Neurochir (Wien), 2017. 159(11): p. 2217-2221.
  33. Roque, A. and Y. Odia, BRAF-V600E mutant papillary craniopharyngioma dramatically responds to combination BRAF and MEK inhibitors. CNS Oncol, 2017. 6(2): p. 95-99.
  34. Steele, C.A., et al., Pituitary adenomas in childhood, adolescence and young adulthood: presentation, management, endocrine and metabolic outcomes. Eur J Endocrinol, 2010. 163(4): p. 515-22.
  35. Webb, C. and R.A. Prayson, Pediatric pituitary adenomas. Arch Pathol Lab Med, 2008. 132(1): p. 77-80.
  36. Davis, C.H., G.L. Odom, and B. Woodhall, Brain tumors in children; clinical analysis of 164 cases. Pediatrics, 1956. 18(6): p. 856-70.
  37. Mindermann, T. and C.B. Wilson, Pediatric pituitary adenomas. Neurosurgery, 1995. 36(2): p. 259-68; discussion 269.
  38. Partington, M.D., et al., Pituitary adenomas in childhood and adolescence. Results of transsphenoidal surgery. J Neurosurg, 1994. 80(2): p. 209-16.
  39. Ludecke, D.K., H.D. Herrmann, and F.J. Schulte, Special problems with neurosurgical treatments of hormone-secreting pituitary adenomas in children. Prog Exp Tumor Res, 1987. 30: p. 362-70.
  40. Gold, E.B., Epidemiology of pituitary adenomas. Epidemiol Rev, 1981. 3: p. 163-83.
  41. Haddad, S.F., J.C. VanGilder, and A.H. Menezes, Pediatric pituitary tumors. Neurosurgery, 1991. 29(4): p. 509-14.
  42. Kane, L.A., et al., Pituitary adenomas in childhood and adolescence. J Clin Endocrinol Metab, 1994. 79(4): p. 1135-40.
  43. Guzel, A., et al., Pituitary carcinoma presenting with multiple metastases: case report. J Child Neurol, 2008. 23(12): p. 1467-71.
  44. Colao, A. and S. Loche, Prolactinomas in children and adolescents. Endocr Dev, 2010. 17: p. 146-159.
  45. Avramides, A., et al., TSH-secreting pituitary macroadenoma in an 11-year-old girl. Acta Paediatr, 1992. 81(12): p. 1058-60.
  46. Dyer, E.H., et al., Transsphenoidal surgery for pituitary adenomas in children. Neurosurgery, 1994. 34(2): p. 207-12; discussion 212.
  47. Maira, G. and C. Anile, Pituitary adenomas in childhood and adolescence. Can J Neurol Sci, 1990. 17(1): p. 83-7.
  48. Richmond, I.L. and C.B. Wilson, Pituitary adenomas in childhood and adolescence. J Neurosurg, 1978. 49(2): p. 163-8.
  49. Keil, M.F. and C.A. Stratakis, Advances in the Diagnosis, Treatment, and Molecular Genetics of Pituitary Adenomas in Childhood. US Endocrinol, 2009. 4(2): p. 81-85.
  50. Catli, G., et al., Clinical and diagnostic characteristics of hyperprolactinemia in childhood and adolescence. J Pediatr Endocrinol Metab, 2013. 26(1-2): p. 1-11.
  51. Colao, A., et al., Prolactinomas in children and adolescents. Clinical presentation and long-term follow-up. J Clin Endocrinol Metab, 1998. 83(8): p. 2777-80.
  52. Hoffmann, A., et al., Pediatric prolactinoma: initial presentation, treatment, and long-term prognosis. Eur J Pediatr, 2018. 177(1): p. 125-132.
  53. Cannavo, S., et al., Clinical presentation and outcome of pituitary adenomas in teenagers. Clin Endocrinol (Oxf), 2003. 58(4): p. 519-27.
  54. Creemers, L.B., et al., Prolactinoma and body weight: a retrospective study. Acta Endocrinol (Copenh), 1991. 125(4): p. 392-6.
  55. Delgrange, E., J. Donckier, and D. Maiter, Hyperprolactinaemia as a reversible cause of weight gain in male patients? Clin Endocrinol (Oxf), 1999. 50(2): p. 271.
  56. Greenman, Y., K. Tordjman, and N. Stern, Increased body weight associated with prolactin secreting pituitary adenomas: weight loss with normalization of prolactin levels. Clin Endocrinol (Oxf), 1998. 48(5): p. 547-53.
  57. Colao, A., et al., Withdrawal of long-term cabergoline therapy for tumoral and nontumoral hyperprolactinemia. N Engl J Med, 2003. 349(21): p. 2023-33.
  58. Artese, R., et al., Pituitary tumors in adolescent patients. Neurol Res, 1998. 20(5): p. 415-417.
  59. Gillam, M.P., et al., Advances in the treatment of prolactinomas. Endocr Rev, 2006. 27(5): p. 485-534.
  60. Liu, Y., et al., Prolactinomas in children under 14. Clinical presentation and long-term follow-up. Childs Nerv Syst, 2015. 31(6): p. 909-16.
  61. Shibli-Rahhal, A. and J. Schlechte, The effects of hyperprolactinemia on bone and fat. Pituitary, 2009. 12(2): p. 96-104.
  62. Di Somma, C., et al., Bone marker and bone density responses to dopamine agonist therapy in hyperprolactinemic males. J Clin Endocrinol Metab, 1998. 83(3): p. 807-13.
  63. Colao, A., et al., Prolactinomas in adolescents: persistent bone loss after 2 years of prolactin normalization. Clin Endocrinol (Oxf), 2000. 52(3): p. 319-27.
  64. Di Sarno, A., et al., An evaluation of patients with hyperprolactinemia: have dynamic tests had their day? J Endocrinol Invest, 2003. 26(7 Suppl): p. 39-47.
  65. Cavaco, B., et al., Some forms of big big prolactin behave as a complex of monomeric prolactin with an immunoglobulin G in patients with macroprolactinemia or prolactinoma. J Clin Endocrinol Metab, 1995. 80(8): p. 2342-6.
  66. Colao, A., et al., Medical therapy for clinically non-functioning pituitary adenomas. Endocr Relat Cancer, 2008. 15(4): p. 905-15.
  67. Perry, A., et al., Pediatric Pituitary Adenoma: Case Series, Review of the Literature, and a Skull Base Treatment Paradigm. J Neurol Surg B Skull Base, 2018. 79(1): p. 91-114.
  68. Tyson, D., et al., Prolactin-secreting macroadenomas in adolescents. Response to bromocriptine therapy. Am J Dis Child, 1993. 147(10): p. 1057-61.
  69. Blackwell, R.E. and J.B. Younger, Long-term medical therapy and follow-up of pediatric-adolescent patients with prolactin-secreting macroadenomas. Fertil Steril, 1986. 45(5): p. 713-6.
  70. Howlett, T.A., et al., Prolactinomas presenting as primary amenorrhoea and delayed or arrested puberty: response to medical therapy. Clin Endocrinol (Oxf), 1989. 30(2): p. 131-40.
  71. Dalzell, G.W., et al., Normal growth and pubertal development during bromocriptine treatment for a prolactin-secreting pituitary macroadenoma. Clin Endocrinol (Oxf), 1987. 26(2): p. 169-72.
  72. Knoepfelmacher, M., et al., Pituitary apoplexy during therapy with cabergoline in an adolescent male with prolactin-secreting macroadenoma. Pituitary, 2004. 7(2): p. 83-7.
  73. Howell, D.L., et al., The use of high-dose daily cabergoline in an adolescent patient with macroprolactinoma. J Pediatr Hematol Oncol, 2005. 27(6): p. 326-9.
  74. Colao, A., et al., Increased prevalence of tricuspid regurgitation in patients with prolactinomas chronically treated with cabergoline. J Clin Endocrinol Metab, 2008. 93(10): p. 3777-84.
  75. Horvath, J., et al., Severe multivalvular heart disease: a new complication of the ergot derivative dopamine agonists. Mov Disord, 2004. 19(6): p. 656-62.
  76. Pinero, A., P. Marcos-Alberca, and J. Fortes, Cabergoline-related severe restrictive mitral regurgitation. N Engl J Med, 2005. 353(18): p. 1976-7.
  77. Auriemma, R.S., et al., Cabergoline use for pituitary tumors and valvular disorders. Endocrinol Metab Clin North Am, 2015. 44(1): p. 89-97.
  78. Auriemma, R.S., et al., Safety of long-term treatment with cabergoline on cardiac valve disease in patients with prolactinomas. Eur J Endocrinol, 2013. 169(3): p. 359-66.
  79. Bulwer, C., et al., Cabergoline-related impulse control disorder in an adolescent with a giant prolactinoma. Clin Endocrinol (Oxf), 2017. 86(6): p. 862-864.
  80. Savage, M.O., et al., Work-up and management of paediatric Cushing's syndrome. Curr Opin Endocrinol Diabetes Obes, 2008. 15(4): p. 346-51.
  81. Storr, H.L., et al., Paediatric Cushing's syndrome: epidemiology, investigation and therapeutic advances. Trends Endocrinol Metab, 2007. 18(4): p. 167-74.
  82. Vandeva, S., et al., Somatic and germline mutations in the pathogenesis of pituitary adenomas. Eur J Endocrinol, 2019. 181(6): p. R235-R254.
  83. Baron, J., et al., Catch-up growth after glucocorticoid excess: a mechanism intrinsic to the growth plate. Endocrinology, 1994. 135(4): p. 1367-71.
  84. Magiakou, M.A., et al., Cushing's syndrome in children and adolescents. Presentation, diagnosis, and therapy. N Engl J Med, 1994. 331(10): p. 629-36.
  85. Magiakou, M.A., G. Mastorakos, and G.P. Chrousos, Final stature in patients with endogenous Cushing's syndrome. J Clin Endocrinol Metab, 1994. 79(4): p. 1082-5.
  86. Weber, A., et al., Investigation, management and therapeutic outcome in 12 cases of childhood and adolescent Cushing's syndrome. Clin Endocrinol (Oxf), 1995. 43(1): p. 19-28.
  87. Devoe, D.J., et al., Long-term outcome in children and adolescents after transsphenoidal surgery for Cushing's disease. J Clin Endocrinol Metab, 1997. 82(10): p. 3196-202.
  88. Leong, G.M., et al., The effect of Cushing's disease on bone mineral density, body composition, growth, and puberty: a report of an identical adolescent twin pair. J Clin Endocrinol Metab, 1996. 81(5): p. 1905-11.
  89. Dempster, D.W., M.A. Arlot, and P.J. Meunier, Mean wall thickness and formation periods of trabecular bone packets in corticosteroid-induced osteoporosis. Calcif Tissue Int, 1983. 35(4-5): p. 410-7.
  90. Di Somma, C., et al., Severe impairment of bone mass and turnover in Cushing's disease: comparison between childhood-onset and adulthood-onset disease. Clin Endocrinol (Oxf), 2002. 56(2): p. 153-8.
  91. Di Somma, C., et al., Effect of 2 years of cortisol normalization on the impaired bone mass and turnover in adolescent and adult patients with Cushing's disease: a prospective study. Clin Endocrinol (Oxf), 2003. 58(3): p. 302-8.
  92. Lodish, M.B., et al., Effects of Cushing disease on bone mineral density in a pediatric population. J Pediatr, 2010. 156(6): p. 1001-1005.
  93. Canalis, E., Clinical review 83: Mechanisms of glucocorticoid action in bone: implications to glucocorticoid-induced osteoporosis. J Clin Endocrinol Metab, 1996. 81(10): p. 3441-7.
  94. Khanine, V., et al., Osteoporotic fractures at presentation of Cushing's disease: two case reports and a literature review. Joint Bone Spine, 2000. 67(4): p. 341-5.
  95. Mancini, T., et al., Cushing's syndrome and bone. Pituitary, 2004. 7(4): p. 249-52.
  96. Newell-Price, J., et al., The diagnosis and differential diagnosis of Cushing's syndrome and pseudo-Cushing's states. Endocr Rev, 1998. 19(5): p. 647-72.
  97. Buzi, F., et al., Loperamide test: a simple and highly specific screening test for hypercortisolism in children and adolescents. Acta Paediatr, 1997. 86(11): p. 1177-80.
  98. Yaneva, M., et al., Midnight salivary cortisol for the initial diagnosis of Cushing's syndrome of various causes. J Clin Endocrinol Metab, 2004. 89(7): p. 3345-51.
  99. Kunwar, S. and C.B. Wilson, Pediatric pituitary adenomas. J Clin Endocrinol Metab, 1999. 84(12): p. 4385-9.
  100. Colao, A., et al., Inferior petrosal sinus sampling in the differential diagnosis of Cushing's syndrome: results of an Italian multicenter study. Eur J Endocrinol, 2001. 144(5): p. 499-507.
  101. Lienhardt, A., et al., Relative contributions of inferior petrosal sinus sampling and pituitary imaging in the investigation of children and adolescents with ACTH-dependent Cushing's syndrome. J Clin Endocrinol Metab, 2001. 86(12): p. 5711-4.
  102. Oldfield, E.H., et al., Petrosal sinus sampling with and without corticotropin-releasing hormone for the differential diagnosis of Cushing's syndrome. N Engl J Med, 1991. 325(13): p. 897-905.
  103. Nieman, L.K., et al., Treatment of Cushing's Syndrome: An Endocrine Society Clinical Practice Guideline. J Clin Endocrinol Metab, 2015. 100(8): p. 2807-31.
  104. Styne, D.M., et al., Treatment of Cushing's disease in childhood and adolescence by transsphenoidal microadenomectomy. N Engl J Med, 1984. 310(14): p. 889-93.
  105. Leinung, M.C., et al., Long term follow-up of transsphenoidal surgery for the treatment of Cushing's disease in childhood. J Clin Endocrinol Metab, 1995. 80(8): p. 2475-9.
  106. Crock, P.A., et al., A personal series of 100 children operated for Cushing's disease (CD): optimizing minimally invasive diagnosis and transnasal surgery to achieve nearly 100% remission including reoperations. J Pediatr Endocrinol Metab, 2018. 31(9): p. 1023-1031.
  107. Barzaghi, L.R., et al., Pediatric Pituitary Adenomas: Early and Long-Term Surgical Outcome in a Series of 85 Consecutive Patients. Neurosurgery, 2019. 85(1): p. 65-74.
  108. Chen, J., R.E. Schmidt, and S. Dahiya, Pituitary Adenoma in Pediatric and Adolescent Populations. J Neuropathol Exp Neurol, 2019. 78(7): p. 626-632.
  109. Locatelli, D., et al., Transsphenoidal surgery for pituitary adenomas in pediatric patients: a multicentric retrospective study. Childs Nerv Syst, 2019. 35(11): p. 2119-2126.
  110. Storr, H.L., et al., Factors influencing cure by transsphenoidal selective adenomectomy in paediatric Cushing's disease. Eur J Endocrinol, 2005. 152(6): p. 825-33.
  111. Pasternak-Pietrzak, K., E. Moszczynska, and M. Szalecki, Treatment challenges in pediatric Cushing's disease: Review of the literature with particular emphasis on predictive factors for the disease recurrence. Endocrine, 2019. 66(2): p. 125-136.
  112. Marino, A.C., et al., Surgery for Pediatric Pituitary Adenomas. Neurosurg Clin N Am, 2019. 30(4): p. 465-471.
  113. Johnston, L.B., et al., Normal final height and apparent cure after pituitary irradiation for Cushing's disease in childhood: long-term follow-up of anterior pituitary function. Clin Endocrinol (Oxf), 1998. 48(5): p. 663-7.
  114. Lebrethon, M.C., et al., Linear growth and final height after treatment for Cushing's disease in childhood. J Clin Endocrinol Metab, 2000. 85(9): p. 3262-5.
  115. Davies, J.H., et al., Final adult height and body mass index after cure of paediatric Cushing's disease. Clin Endocrinol (Oxf), 2005. 62(4): p. 466-72.
  116. Pivonello, R., et al., The Treatment of Cushing's Disease. Endocr Rev, 2015. 36(4): p. 385-486.
  117. Tarapore, P.E., et al., Microscopic endonasal transsphenoidal pituitary adenomectomy in the pediatric population. J Neurosurg Pediatr, 2011. 7(5): p. 501-9.
  118. Storr, H.L., et al., Endonasal endoscopic transsphenoidal pituitary surgery: early experience and outcome in paediatric Cushing's disease. Clin Endocrinol (Oxf), 2014. 80(2): p. 270-6.
  119. Friedman, R.B., et al., Repeat transsphenoidal surgery for Cushing's disease. J Neurosurg, 1989. 71(4): p. 520-7.
  120. Estrada, J., et al., The long-term outcome of pituitary irradiation after unsuccessful transsphenoidal surgery in Cushing's disease. N Engl J Med, 1997. 336(3): p. 172-7.
  121. Jennings, A.S., G.W. Liddle, and D.N. Orth, Results of treating childhood Cushing's disease with pituitary irradiation. N Engl J Med, 1977. 297(18): p. 957-62.
  122. Lonser, R.R., et al., Outcome of surgical treatment of 200 children with Cushing's disease. J Clin Endocrinol Metab, 2013. 98(3): p. 892-901.
  123. Cassar, J., et al., Treatment of Cushing's disease in juveniles with interstitial pituitary irradiation. Clin Endocrinol (Oxf), 1979. 11(3): p. 313-21.
  124. Grigsby, P.W., et al., Long-term results of radiotherapy in the treatment of pituitary adenomas in children and adolescents. Am J Clin Oncol, 1988. 11(6): p. 607-11.
  125. Storr, H.L., et al., Clinical and endocrine responses to pituitary radiotherapy in pediatric Cushing's disease: an effective second-line treatment. J Clin Endocrinol Metab, 2003. 88(1): p. 34-7.
  126. Chan, L.F., et al., Long-term anterior pituitary function in patients with paediatric Cushing's disease treated with pituitary radiotherapy. Eur J Endocrinol, 2007. 156(4): p. 477-82.
  127. Acharya, S.V., et al., Radiotherapy in paediatric Cushing's disease: efficacy and long term follow up of pituitary function. Pituitary, 2010. 13(4): p. 293-7.
  128. Thoren, M., et al., Treatment of Cushing's disease in childhood and adolescence by stereotactic pituitary irradiation. Acta Paediatr Scand, 1986. 75(3): p. 388-95.
  129. Shrivastava, A., et al., Outcomes After Gamma Knife Stereotactic Radiosurgery in Pediatric Patients with Cushing Disease or Acromegaly: A Multi-Institutional Study. World Neurosurg, 2019. 125: p. e1104-e1113.
  130. Greening, J.E., et al., Efficient short-term control of hypercortisolaemia by low-dose etomidate in severe paediatric Cushing's disease. Horm Res, 2005. 64(3): p. 140-3.
  131. Mettauer, N. and J. Brierley, A novel use of etomidate for intentional adrenal suppression to control severe hypercortisolemia in childhood. Pediatr Crit Care Med, 2009. 10(3): p. e37-40.
  132. Chan, L.F., et al., Use of intravenous etomidate to control acute psychosis induced by the hypercortisolaemia in severe paediatric Cushing's disease. Horm Res Paediatr, 2011. 75(6): p. 441-6.
  133. Lila, A.R., et al., Efficacy of cabergoline in uncured (persistent or recurrent) Cushing disease after pituitary surgical treatment with or without radiotherapy. Endocr Pract, 2010. 16(6): p. 968-76.
  134. Merke, D.P., et al., Children experience cognitive decline despite reversal of brain atrophy one year after resolution of Cushing syndrome. J Clin Endocrinol Metab, 2005. 90(5): p. 2531-6.
  135. Colao, A., et al., Acromegaly. Nat Rev Dis Primers, 2019. 5(1): p. 20.
  136. Rostomyan, L., et al., Clinical and genetic characterization of pituitary gigantism: an international collaborative study in 208 patients. Endocr Relat Cancer, 2015. 22(5): p. 745-57.
  137. Iacovazzo, D., et al., Germline or somatic GPR101 duplication leads to X-linked acrogigantism: a clinico-pathological and genetic study. Acta Neuropathol Commun, 2016. 4(1): p. 56.
  138. Eugster, E.A. and O.H. Pescovitz, Gigantism. J Clin Endocrinol Metab, 1999. 84(12): p. 4379-84.
  139. Colao, A. and G. Lombardi, Growth-hormone and prolactin excess. Lancet, 1998. 352(9138): p. 1455-61.
  140. Melmed, S., Medical progress: Acromegaly. N Engl J Med, 2006. 355(24): p. 2558-73.
  141. Chanson, P. and S. Salenave, Acromegaly. Orphanet J Rare Dis, 2008. 3: p. 17.
  142. Borson-Chazot, F., et al., Acromegaly induced by ectopic secretion of GHRH: a review 30 years after GHRH discovery. Ann Endocrinol (Paris), 2012. 73(6): p. 497-502.
  143. Beckers, A., et al., The causes and consequences of pituitary gigantism. Nat Rev Endocrinol, 2018. 14(12): p. 705-720.
  144. Igreja, S., et al., Characterization of aryl hydrocarbon receptor interacting protein (AIP) mutations in familial isolated pituitary adenoma families. Hum Mutat, 2010. 31(8): p. 950-60.
  145. Beckers, A., et al., X-linked acrogigantism syndrome: clinical profile and therapeutic responses. Endocr Relat Cancer, 2015. 22(3): p. 353-67.
  146. Hernandez-Ramirez, L.C., et al., Landscape of Familial Isolated and Young-Onset Pituitary Adenomas: Prospective Diagnosis in AIP Mutation Carriers. J Clin Endocrinol Metab, 2015. 100(9): p. E1242-54.
  147. Marques, P., et al., Significant Benefits of AIP Testing and Clinical Screening in Familial Isolated and Young-onset Pituitary Tumors. J Clin Endocrinol Metab, 2020. 105(6).
  148. Daly, A.F., et al., Somatic mosaicism underlies X-linked acrogigantism syndrome in sporadic male subjects. Endocr Relat Cancer, 2016. 23(4): p. 221-33.
  149. Trivellin, G., et al., An orphan G-protein-coupled receptor causes human gigantism and/or acromegaly: Molecular biology and clinical correlations. Best Pract Res Clin Endocrinol Metab, 2018. 32(2): p. 125-140.
  150. Sotos, J.F., Overgrowth. Hormonal Causes. Clin Pediatr (Phila), 1996. 35(11): p. 579-90.
  151. Whitehead, E.M., et al., Pituitary gigantism: a disabling condition. Clin Endocrinol (Oxf), 1982. 17(3): p. 271-7.
  152. Clayton, P.E., et al., Growth hormone, the insulin-like growth factor axis, insulin and cancer risk. Nat Rev Endocrinol, 2011. 7(1): p. 11-24.
  153. Colao, A., et al., Growth hormone excess with onset in adolescence: clinical appearance and long-term treatment outcome. Clin Endocrinol (Oxf), 2007. 66(5): p. 714-22.
  154. Bondanelli, M., et al., Cardiac and metabolic effects of chronic growth hormone and insulin-like growth factor I excess in young adults with pituitary gigantism. Metabolism, 2005. 54(9): p. 1174-80.
  155. Blumberg, D.L., et al., Acromegaly in an infant. Pediatrics, 1989. 83(6): p. 998-1002.
  156. Kaltsas, G.A., et al., Menstrual irregularity in women with acromegaly. J Clin Endocrinol Metab, 1999. 84(8): p. 2731-5.
  157. Alvi, N.S. and J.M. Kirk, Pituitary gigantism causing diabetic ketoacidosis. J Pediatr Endocrinol Metab, 1999. 12(6): p. 907-9.
  158. Ali, O., et al., Management of type 2 diabetes mellitus associated with pituitary gigantism. Pituitary, 2007. 10(4): p. 359-64.
  159. Katznelson, L., et al., American Association of Clinical Endocrinologists medical guidelines for clinical practice for the diagnosis and treatment of acromegaly--2011 update. Endocr Pract, 2011. 17 Suppl 4: p. 1-44.
  160. Giustina, A., et al., Criteria for cure of acromegaly: a consensus statement. J Clin Endocrinol Metab, 2000. 85(2): p. 526-9.
  161. de Herder, W.W., et al., IGFBP-3 is a poor parameter for assessment of clinical activity in acromegaly. Clin Endocrinol (Oxf), 1995. 43(4): p. 501-5.
  162. Marzullo, P., et al., Usefulness of different biochemical markers of the insulin-like growth factor (IGF) family in diagnosing growth hormone excess and deficiency in adults. J Clin Endocrinol Metab, 2001. 86(7): p. 3001-8.
  163. Ng, L.L., et al., Growth hormone isoforms in a girl with gigantism. J Pediatr Endocrinol Metab, 1999. 12(1): p. 99-106.
  164. Bidlingmaier, M. and C.J. Strasburger, Growth hormone assays: current methodologies and their limitations. Pituitary, 2007. 10(2): p. 115-9.
  165. Maheshwari, H.G., et al., Long-acting peptidomimergic control of gigantism caused by pituitary acidophilic stem cell adenoma. J Clin Endocrinol Metab, 2000. 85(9): p. 3409-16.
  166. Locatelli, D., et al., Endoscopic endonasal transsphenoidal surgery for sellar tumors in children. Int J Pediatr Otorhinolaryngol, 2010. 74(11): p. 1298-302.
  167. Ludecke, D.K. and T. Abe, Transsphenoidal microsurgery for newly diagnosed acromegaly: a personal view after more than 1,000 operations. Neuroendocrinology, 2006. 83(3-4): p. 230-9.
  168. Nomikos, P., M. Buchfelder, and R. Fahlbusch, The outcome of surgery in 668 patients with acromegaly using current criteria of biochemical 'cure'. Eur J Endocrinol, 2005. 152(3): p. 379-87.
  169. Lissett, C.A., et al., The outcome of surgery for acromegaly: the need for a specialist pituitary surgeon for all types of growth hormone (GH) secreting adenoma. Clin Endocrinol (Oxf), 1998. 49(5): p. 653-7.
  170. Ahmed, S., et al., Outcome of transphenoidal surgery for acromegaly and its relationship to surgical experience. Clin Endocrinol (Oxf), 1999. 50(5): p. 561-7.
  171. Yamada, S., et al., Retrospective analysis of long-term surgical results in acromegaly: preoperative and postoperative factors predicting outcome. Clin Endocrinol (Oxf), 1996. 45(3): p. 291-8.
  172. Sheaves, R., et al., Outcome of transsphenoidal surgery for acromegaly using strict criteria for surgical cure. Clin Endocrinol (Oxf), 1996. 45(4): p. 407-13.
  173. Shimon, I., et al., Transsphenoidal surgery for acromegaly: endocrinological follow-up of 98 patients. Neurosurgery, 2001. 48(6): p. 1239-43; discussion 1244-5.
  174. Ferone, D., et al., Pharmacotherapy or surgery as primary treatment for acromegaly? Drugs Aging, 2000. 17(2): p. 81-92.
  175. Melmed, S., et al., Guidelines for acromegaly management: an update. J Clin Endocrinol Metab, 2009. 94(5): p. 1509-17.
  176. Gelber, S.J., D.S. Heffez, and P.A. Donohoue, Pituitary gigantism caused by growth hormone excess from infancy. J Pediatr, 1992. 120(6): p. 931-4.
  177. Yoshida, T., et al., Growth hormone (GH) secretory dynamics in a case of acromegalic gigantism associated with hyperprolactinemia: nonpulsatile secretion of GH may induce elevated insulin-like growth factor-I (IGF-I) and IGF-binding protein-3 levels. J Clin Endocrinol Metab, 1996. 81(1): p. 310-3.
  178. Tajima, T., et al., Case study of a 15-year-old boy with McCune-Albright syndrome combined with pituitary gigantism: effect of octreotide-long acting release (LAR) and cabergoline therapy. Endocr J, 2008. 55(3): p. 595-9.
  179. Daly, A.F., et al., AIP-mutated acromegaly resistant to first-generation somatostatin analogs: long-term control with pasireotide LAR in two patients. Endocr Connect, 2019. 8(4): p. 367-377.
  180. Trainer, P.J., et al., Treatment of acromegaly with the growth hormone-receptor antagonist pegvisomant. N Engl J Med, 2000. 342(16): p. 1171-7.
  181. van der Lely, A.J., et al., Long-term treatment of acromegaly with pegvisomant, a growth hormone receptor antagonist. Lancet, 2001. 358(9295): p. 1754-9.
  182. Colao, A., et al., Efficacy of 12-month treatment with the GH receptor antagonist pegvisomant in patients with acromegaly resistant to long-term, high-dose somatostatin analog treatment: effect on IGF-I levels, tumor mass, hypertension and glucose tolerance. Eur J Endocrinol, 2006. 154(3): p. 467-77.
  183. Rix, M., et al., Pegvisomant therapy in pituitary gigantism: successful treatment in a 12-year-old girl. Eur J Endocrinol, 2005. 153(2): p. 195-201.
  184. Bergamaschi, S., et al., Eight-year follow-up of a child with a GH/prolactin-secreting adenoma: efficacy of pegvisomant therapy. Horm Res Paediatr, 2010. 73(1): p. 74-9.
  185. Goldenberg, N., et al., Treatment of pituitary gigantism with the growth hormone receptor antagonist pegvisomant. J Clin Endocrinol Metab, 2008. 93(8): p. 2953-6.
  186. Dutta, P., et al., Surgery, Octreotide, Temozolomide, Bevacizumab, Radiotherapy, and Pegvisomant Treatment of an AIP MutationPositive Child. J Clin Endocrinol Metab, 2019. 104(8): p. 3539-3544.
  187. Minniti, G., et al., The long-term efficacy of conventional radiotherapy in patients with GH-secreting pituitary adenomas. Clin Endocrinol (Oxf), 2005. 62(2): p. 210-6.
  188. Jenkins, P.J., et al., Conventional pituitary irradiation is effective in lowering serum growth hormone and insulin-like growth factor-I in patients with acromegaly. J Clin Endocrinol Metab, 2006. 91(4): p. 1239-45.
  189. Rabbiosi, S., et al., Asymptomatic thyrotropin-secreting pituitary macroadenoma in a 13-year-old girl: successful first-line treatment with somatostatin analogs. Thyroid, 2012. 22(10): p. 1076-9.
  190. Beck-Peccoz, P., et al., Pituitary tumours: TSH-secreting adenomas. Best Pract Res Clin Endocrinol Metab, 2009. 23(5): p. 597-606.
  191. Bevan, J.S., et al., Dopamine agonists and pituitary tumor shrinkage. Endocr Rev, 1992. 13(2): p. 220-40.
  192. Fukuda, T., et al., Thyrotropin secreting pituitary adenoma effectively treated with octreotide. Intern Med, 1998. 37(12): p. 1027-30.
  193. Chanson, P., B.D. Weintraub, and A.G. Harris, Octreotide therapy for thyroid-stimulating hormone-secreting pituitary adenomas. A follow-up of 52 patients. Ann Intern Med, 1993. 119(3): p. 236-40.
  194. Gancel, A., et al., Effects of a slow-release formulation of the new somatostatin analogue lanreotide in TSH-secreting pituitary adenomas. Clin Endocrinol (Oxf), 1994. 40(3): p. 421-8.
  195. Kuhn, J.M., et al., Evaluation of the treatment of thyrotropin-secreting pituitary adenomas with a slow release formulation of the somatostatin analog lanreotide. J Clin Endocrinol Metab, 2000. 85(4): p. 1487-91.
  196. Abe, T., D.K. Ludecke, and W. Saeger, Clinically nonsecreting pituitary adenomas in childhood and adolescence. Neurosurgery, 1998. 42(4): p. 744-50; discussion 750-1.
  197. Jaffe, C.A., Clinically non-functioning pituitary adenoma. Pituitary, 2006. 9(4): p. 317-21.
  198. Katznelson, L., J.M. Alexander, and A. Klibanski, Clinical review 45: Clinically nonfunctioning pituitary adenomas. J Clin Endocrinol Metab, 1993. 76(5): p. 1089-94.
  199. Keil, M.F. and C.A. Stratakis, Pituitary tumors in childhood: update of diagnosis, treatment and molecular genetics. Expert Rev Neurother, 2008. 8(4): p. 563-74.
  200. Di Rocco, C., G. Maira, and P. Borrelli, Pituitary microadenomas in children. Childs Brain, 1982. 9(3-4): p. 165-78.
  201. Tashiro, H., et al., A follicle-stimulating hormone-secreting gonadotroph adenoma with ovarian enlargement in a 10-year-old girl. Fertil Steril, 1999. 72(1): p. 158-60.
  202. Gryngarten, M.G., et al., Spontaneous ovarian hyperstimulation syndrome caused by a follicle-stimulating hormone-secreting pituitary macroadenoma in an early pubertal girl. Horm Res Paediatr, 2010. 73(4): p. 293-8.
  203. Ntali, G., et al., Clinical review: Functioning gonadotroph adenomas. J Clin Endocrinol Metab, 2014. 99(12): p. 4423-33.
  204. Cappabianca, P., L.M. Cavallo, and E. de Divitiis, Endoscopic endonasal transsphenoidal surgery. Neurosurgery, 2004. 55(4): p. 933-40; discussion 940-1.
  205. de Divitiis, E., et al., The role of the endoscopic transsphenoidal approach in pediatric neurosurgery. Childs Nerv Syst, 2000. 16(10-11): p. 692-6.
  206. Cappabianca, P., et al., Endoscopic endonasal transsphenoidal surgery in recurrent and residual pituitary adenomas: technical note. Minim Invasive Neurosurg, 2000. 43(1): p. 38-43.
  207. Littley, M.D., et al., Hypopituitarism following external radiotherapy for pituitary tumours in adults. Q J Med, 1989. 70(262): p. 145-60.
  208. Colao, A., et al., Effect of surgery and radiotherapy on visual and endocrine function in nonfunctioning pituitary adenomas. J Endocrinol Invest, 1998. 21(5): p. 284-90.
  209. Turner, H.E., et al., Audit of selected patients with nonfunctioning pituitary adenomas treated without irradiation - a follow-up study. Clin Endocrinol (Oxf), 1999. 51(3): p. 281-4.
  210. Colao, A., et al., New medical approaches in pituitary adenomas. Horm Res, 2000. 53 Suppl 3: p. 76-87.
  211. Pivonello, R., et al., Dopamine receptor expression and function in clinically nonfunctioning pituitary tumors: comparison with the effectiveness of cabergoline treatment. J Clin Endocrinol Metab, 2004. 89(4): p. 1674-83.
  212. Colao, A., et al., Hormone levels and tumour size response to quinagolide and cabergoline in patients with prolactin-secreting and clinically non-functioning pituitary adenomas: predictive value of pituitary scintigraphy with 123I-methoxybenzamide. Clin Endocrinol (Oxf), 2000. 52(4): p. 437-45.
  213. Greenman, Y., et al., Treatment of clinically nonfunctioning pituitary adenomas with dopamine agonists. Eur J Endocrinol, 2016. 175(1): p. 63-72.
  214. Florio, T., et al., Efficacy of a dopamine-somatostatin chimeric molecule, BIM-23A760, in the control of cell growth from primary cultures of human non-functioning pituitary adenomas: a multi-center study. Endocr Relat Cancer, 2008. 15(2): p. 583-96.

Diabetic Retinopathy

ABSTRACT

Diabetic retinopathy is a significant life-altering complication affecting patients with diabetes. Understanding its pathogenesis, prevention, and treatment is critical to delivering effective and comprehensive care for patients with diabetes at all stages. This review discusses the risk factors, epidemiology, pathogenesis, clinical features, and treatment options for diabetic retinopathy, with an emphasis on practical information useful for endocrinologists and other non-ophthalmologists.

INTRODUCTION

Diabetic retinopathy (DR) is the most common microvascular complication of diabetes and a leading cause of blindness worldwide and in the US (1-3). The individual lifetime risk of DR is estimated to be 50–60% in patients with type 2 diabetes and over 90% in patients with type 1 diabetes (4). It is the most frequent cause of blindness in adults between 20-74 years of age in developed countries (5). The same pathologic mechanisms that damage the kidneys and other organs affect the microcirculation of the eye (6). With the global epidemic of diabetes, one expects that diabetes will be the leading global cause of vision loss in many countries (1,2). While DR is specific for diabetes, other eye disorders, such as glaucoma and cataracts, occur earlier and more frequently in people with diabetes (5).

Often, by the time patients seek ophthalmologic examination and treatment, there are significant alterations of the retinal microvasculature. Therefore, it is important for non-ophthalmologists to recognize the importance of eye disease in patients with diabetes so that appropriate referral to eye-care specialists can be a part of their diabetes management program.

EPIDEMIOLOGY 

In the Wisconsin Epidemiologic Study of Diabetic Retinopathy (WESDR), the prevalence of DR in patients with type 1 diabetes was 17% in those with less than 5 years of diabetes vs 98% in those with 15 or more years of diabetes (6). Proliferative diabetic retinopathy (PDR) was absent in patients with type 1 diabetes of short duration but present in 48% of those with 15 or more years of diabetes. In patients with type 1 diabetes, the 25-year rate of progression of DR was 83%, with progression to PDR occurring in 42% of patients (7). Improvement of DR was observed in 18% of patients with type 1 diabetes. In the WESDR, 3.6% of patients with type 1 diabetes were legally blind, and 86% of the blindness was attributable to DR (8). The risk of blindness increases with the duration of diabetes.

In the WESDR, patients with type 2 diabetes of less than 5 years had a prevalence of DR of 28%, while in patients with greater than 15 years of diabetes, the prevalence was 78% (6). A considerable number of patients with type 2 diabetes (12-19%) have DR at the time of the diagnosis of diabetes (1). The prevalence of PDR was relatively low in patients with type 2 diabetes (2%) in patients with less than 5 years duration vs 16% in patients with greater than 15 years duration of diabetes (6). The prevalence of DR and PDR was greater in the patients with type 2 diabetes using insulin. In the patients with type 2 diabetes, 1.6% were legally blind, and one-third of cases of legal blindness were due to DR (8).

Of note, the WESDR cohort is 99% white, and data suggest a higher prevalence of DR in Mexican-Americans and African-Americans with type 2 diabetes (6,9,10). Asians appear to have the same or lower prevalence of DR (1,10). DR occurs in both males and females with diabetes, but males appear to be at a slightly higher risk (9). Diabetic macular edema (DME) occurs more commonly in patients with type 2 diabetes, and with the marked increase in the prevalence of type 2 diabetes, DME is becoming more common (2). DME is over two times more prevalent than PDR (9).

In a pooled analysis of 35 studies between 1980 and 2008, among 22,896 individuals with diabetes, the overall prevalence of DR was 34.6%, PDR 6.96%, DME 6.81%, and vision-threatening DR 10.2% (11). The longer the duration of diabetes, the greater the prevalence of all of these diabetic eye manifestations (11). Moreover, the prevalence of DR, PDR, and DME was greater in patients with type 1 diabetes (77%, 32%, and 14%) compared to patients with type 2 diabetes (32%, 3, and 6%) (1,11).

In developed countries the incidence and the risk of progression of DR have greatly declined in patients with type 1 and type 2 diabetes (1,2,12). The WESDR showed that from 1980 to 2007, the estimated annual incidence of PDR decreased by 77%, and vision impairment decreased by 57% in patients with type 1 diabetes (12). In an analysis of 28 studies with 27,120 patients, the rates of DR and PDR were lower among participants in 1986-2008 than in 1975-1985 (13). Thus, patients with recently diagnosed type 1 or type 2 diabetes in developed countries have a much lower risk of PDR, DME, and visual impairment as compared with patients who developed diabetes in the past (1,12). This marked decrease in the prevalence and incidence of DR and vision impairment is likely due to improved glycemia control, early screening for eye disease, and the more aggressive treatment of blood pressure (1). However, in countries with limited medical resources, this reduced risk of DR and vision impairment is not occurring (2).

In caring for patients with diabetes, health care providers must bear in mind the substantial risks of developing visual loss that these patients face and the treatments that can reduce this risk. For affected patients, diabetes-related visual loss decreases the quality of life and interferes with the performance of daily activities.

RISK FACTORS

Hyperglycemia

The most important treatable risk factor for the development of DR is hyperglycemia. In patients with both type 1 and type 2 diabetes, elevated HbA1c levels are associated with an increased risk and progression of DR (2,7,14-16). Most importantly, randomized controlled trials comparing intensive glycemic control vs. usual care demonstrated a decrease in DR. A meta-analysis of 6 relatively small randomized trials prior to the publication of the Diabetes Control and Complications Trial (DCCT) reported that after 2 to 5 years of intensive therapy the risk of retinopathy progression was significantly reduced (OR 0.49, p = 0.011) (17). Intensive therapy significantly retarded retinopathy progression to more severe states such as PDR or changes requiring laser treatment (OR 0.44, p = 0 018) (17).

The DCCT was a randomized, controlled study of intensive glycemic control (HbA1c approximately 7%) vs. usual care (HbA1c approximately 9%) in 1,441 patients with type 1 diabetes (18). This study found that intensive glucose control reduced the risk of developing retinopathy by 76% compared to usual care (18). In patients with pre-existing retinopathy, intensive control slowed progression of the DR by 54% (18). For every 10% reduction in HbA1c (e.g., 10% to 9% or 9% to 8.1%) the risk of retinopathy progression was reduced on average by 44% (19).The DCCT participants were followed in an observational Epidemiology of Diabetes Interventions and Complications (EDIC) study. During the EDIC study, the mean HbA1c levels became very similar in the intensive and usual care group, with the HbA1c of the intensive treatment group increasing to approximately 8% and the usual care group HbA1c decreasing to approximately 8% (19). Despite the similar A1c levels in the 2 groups over 30 years there continued to be an approximately 50% risk reduction of further DR progression and the development of PDR and DME in the original intensive control group, a phenomenon termed metabolic memory (19). These results indicate the need for early intensive glucose control.

In the Kumamoto study, 110 patients with type 2 diabetes were randomly assigned to a multiple insulin injection treatment group (MIT group) or to a conventional insulin injection treatment group (CIT group) and followed for 6 years (20,21). HbA1c levels were 7.1% in the MIT group and 9.4% in the CIT group. Moreover, the development of DR after 6 years was 7.7% for the MIT group and 32.0% for the CIT group in the primary-prevention cohort (no microvascular disease at baseline) (P = 0.039), and progression of DR occurred in 19.2% of the MIT group and 44.0% of the CIT group in the secondary-intervention cohort (microvascular disease at baseline) (P = 0.049). This study demonstrated that improved glycemic control reduced DR in patients with type 2 diabetes.

In the UK Prospective Diabetes Study (UKPDS), 3,867 newly diagnosed patients with type 2 diabetes were randomized to diet therapy alone or to sulfonylureas or insulin with the goal of achieving a fasting glucose of 108 mg/dL (6mMol/L) in those treated with sulfonylureas or insulin (intensive group). Over 10 years, HbA1c levels were approximately 7.0% in the patients treated with sulfonylureas/insulin therapy compared with 7.9% in the diet group. This study found a 25% reduction in the risk of microvascular endpoints, including the need for diabetic retinal laser treatment, with intensive glucose control (22). A risk reduction of 21% per 1% decrease in HbA1c was observed in this trial. Patients were closely followed after the study ended, and HbA1c levels after one year became similar in the two groups. Similar to the results seen in the DCCT/EDIC study, the benefits on microvascular disease persisted in the intensive control group, confirming the concept of metabolic memory in patients with type 2 diabetes (23).

The ACCORD study was a randomized trial that enrolled 10,251 individuals with type 2 diabetes who were at high risk for cardiovascular disease to receive either intensive or standard treatment for glycemia (HbA1c 6.4% vs. 7.5%). A subgroup of 2,856 individuals were evaluated for the effects of intensive vs. standard care at 4 years on the progression of diabetic retinopathy by 3 or more steps on the Early Treatment Diabetic Retinopathy Study Severity Scale. After 4 years, the rates of progression of diabetic retinopathy were 7.3% in the intensive group vs.10.4% in the standard therapy group (odds ratio, 0.67; P=0.003) (24). It should be noted that in an analysis of the entire ACCORD study cohort, three-line change in visual acuity was reduced in the intensive control group (HR 0.94, CI 0.89-1.00; p=0.05) but no differences in photocoagulation, vitrectomy, or severe visual loss were observed (25). Four years after the ACCORD trial ended, DR progressed in 5.8% of the intensive treatment group vs.12.7% in the standard treatment group (odds ratio 0.42, P < 0.0001) (26), once again confirming the concept of metabolic memory.

It should be noted that two large cardiovascular outcome trials, the ADVANCE trial and the VADT, failed to demonstrate a benefit of intensive glucose control on diabetic retinopathy (27,28). However, a meta-analysis of the four large cardiovascular outcome studies in patients with type 2 diabetes (UKPDS, ACCORD, ADVANCE, and VADT) found that more intensive glucose control resulted in a decrease in HbA1c of -0.90% and a 13% reduction in the need for retinal photocoagulation therapy or vitrectomy, development of PDR, or progression of DR (29). Another meta-analysis of 7 trials with 10,793 participants reported a 20% decrease in DR with intensive glycemic control (0.80, 0.67 to 0.94; P=0.009) (30).

Taken together, these results clearly demonstrate that in patients with both type 1 and type 2 diabetes, improvements in glycemic control will reduce the risk of the development and progression of DR.  

 Rapid Improvement in Glycemic Control

Deterioration of DR, upon initiation of intensive diabetes treatment, was described in the 1980s in patients with type 1 diabetes who were treated intensively with continuous subcutaneous insulin infusions (31-34). In patients with poor glycemic control and DR, rapidly improving glycemic control can worsen DR and, in some instances, result in PDR or DME. This worsening can occur as soon as 3 months after initiating intensive glycemic control. In the DCCT early worsening was observed at the 6- and/or 12-month visit in 13.1% of patients in the intensive treatment group and in 7.6% of patients assigned to conventional treatment (odds ratio, 2.06; P < .001) (35). In the DCCT the most important risk factors for early worsening of DR were a higher HbA1c level and reduction of this level during the first 6 months of treatment (35). It must be recognized that in the DCCT the long-term outcomes in intensively treated patients who had early worsening were similar to or more favorable than outcomes in conventionally treated patients (35). This early worsening of DR with improved glycemic control has also been described in patients with type 2 diabetes treated with insulin or GLP-1 agonists, following bariatric surgery, in pregnant women with diabetes, and following pancreatic transplants in patients with type 1 diabetes (36). The mechanism(s) leading to early worsening of DR with improvements in glycemic control are unknown (36).

While this worsening is distressing, it must be recognized that the long-term benefits of improving glycemic control on DR greatly outweigh the risks of early worsening. Ophthalmologic evaluation should be obtained prior to initiating intensive treatment and close monitoring should occur at 3-month intervals for 6 to 12 months in patients with significant pre-existing DR.

Hypertension

In the WESDR, blood pressure (BP) was not related to incidence or progression of retinopathy in the patients with type 2 diabetes using insulin or the type 2 patients not using insulin, but in the patients with type 1 diabetes systolic BP was a significant predictor of the incidence of DR (37). In contrast, in the UKPDS and other studies high BP in patients with type 2 was associated with the development of DR (2,16,38). In one prospective study the risk of DR increased by 30% for every 10 mm Hg increase in systolic BP at baseline (39).

While observational studies can show an association, randomized controlled trials are required to demonstrate causation and the benefits of treatment. A number of studies have examined the effect of lowering BP in patients with hypertension on the development and progression of DR.

STUDIES IN PATIENTS WITH HYPERTENSION

The UKPDS examined the effect of tight vs. less tight BP control in 1,148 hypertensive patients with type 2 diabetes (40). In the tight BP control group (captopril and atenolol), BP was significantly reduced compared to the less tight group (144/82 mm Hg vs.154/87 mm Hg; (P<0.0001). After nine years the tight BP control group had a 34% reduction in the deterioration of retinopathy (P=0.0004) and a 47% reduced risk (P=0.004) of deterioration in visual acuity. Additionally, patients in the tight BP group were less likely to undergo photocoagulation (RR, 0.65; P = .03), a difference primarily due to a decrease in photocoagulation due to maculopathy (RR, 0.58; P = .02) (41). In contrast to glycemic control, the benefits of lowering BP were not sustained when therapy was discontinued and the differences in blood pressure were not maintained, indicating the absence of metabolic memory (42).

The HOPE study was a randomized study that compared ramipril vs. placebo in 3,577 participants with diabetes who had a previous cardiovascular event or at least one other cardiovascular risk factor (43). The baseline BP was approximately 142/80 mm Hg, and BP decreased by 1.92/3.3 mm Hg in the ramipril group vs a 0.55 mm Hg increase in systolic BP and 2.30 mm Hg decrease in diastolic BP in the placebo group.  This study was not focused on DR but did report that the need for laser was 9.4% in the ramipril group vs. 10.5% in the placebo group (22% decrease; p=0.24).

The ADVANCE study examined the effect of BP control on DR in 1,241 patients with type 2 diabetes (44). Patients were randomized to BP-lowering agents (perindopril and indapamide) or placebo and followed for approximately 4-5 years. Baseline BP was approximately 143/79 mm Hg. In the group randomized to BP medications, a decrease in systolic BP of 6.1 ± 1.2 mmHg and diastolic BP of 2.3 ± 0.6 mmHg was observed (p < 0.001 for both).  Fewer patients on BP lowering therapy experienced new or worsening DR compared with those on placebo (OR 0.78; 95% CI 0.57–1.06; p = 0.12), but the difference was not quite statistically significant. Certain secondary outcomes were significantly reduced (for example DME) in the BP lowering group, but most other eye end points were not significantly decreased compared to the placebo group.

The ACCORD eye study evaluated 2,856 patients with type 2 diabetes for the effect of intensive BP control (BP<120 mm Hg) vs standard BP control (BP<140 mm Hg) on the progression of DR after 4 years of treatment (24). Systolic BP was 117 mm Hg in the intensive-therapy group and 133 mm Hg in the standard-therapy group. The progression of DR was 10.4% with intensive blood-pressure therapy vs. 8.8% with standard therapy (adjusted odds ratio, 1.23; P=0.29).

The Appropriate Blood Pressure Control in Diabetes (ABCD2) Trial was a randomized blinded trial that compared the effects of intensive versus moderate BP control in 470 patients with type 2 diabetes and hypertension (45). The intensive group was treated with either nisoldipine or enalapril, while the usual care BP group received placebo. The mean blood pressure achieved was 132/78 mm Hg in the intensive group and 138/86 mm Hg in the moderate group. Over the 5-year follow-up period, there was no difference in the progression of DR between the intensive and moderate groups.

Thus, in patients with hypertension, randomized trials of lowering BP have not consistently shown beneficial effects on DR.

BASIS FOR VARIABILITY

There are numerous possible explanations for the differences in results between these studies. First, the severity of the hypertension may be important, with greater responses in individuals with higher BP levels. Second, the magnitude of the reduction in BP may be important, with greater benefit with greater decreases in BP. Third, the duration of the study may be an important variable, with the longer the study the greater the chances of benefits. Fourth, the presence of DR at baseline and the severity of DR at baseline may influence the response to BP lowering. Fifth, patient variables such as glycemic control, age, diabetes type, duration of diabetes, etc., may influence results. Finally, the drugs used to lower BP may be a key variable as described below.

STUDIES IN PATIENTS WITH NORMAL BP

Because of the potential benefits of angiotensin converting enzyme inhibitors (ACE inhibitors) and angiotensin receptor inhibitors (ARBs) (Renin-Angiotensin System (RAS) inhibitors) on microvascular disease independent of BP effects, a number of studies have explored the effects of these drugs on DR in patients without elevated BP. Below we briefly describe the largest of these studies.

The EUCLID trial was a randomized double-blind placebo-controlled trial in 354 patients with type 1 diabetes who were not hypertensive and were normoalbuminuric (85%) or microalbuminuric (46). Study participants were randomized to lisinopril or placebo and followed for 2 years. Systolic BP was 3 mm Hg lower in the lisinopril group than in the placebo group. DR progressed in 23.4% of patients in the placebo group and 13.2% of patients in the lisinopril group (p=0.02). Notably progression to PDR was also reduced in the lisinopril treated group.

The Appropriate Blood Pressure Control in Diabetes (ABCD1) trial was a randomized trial in 480 normotensive type 2 diabetic subjects of more intensive vs. usual BP control (47). The intensive group was treated with either nisoldipine or enalapril, while the usual care BP group received placebo. Mean BP in the intensive group was 128/75 mm Hg vs. 137/81 mm Hg in the placebo group (P < 0.0001). After a mean follow-up of 5.4 years, the intensive BP control group demonstrated less progression of diabetic retinopathy (34% vs. 46%, P = 0.019). PDR developed in 0% of patients in the intensive therapy group vs. 3.9% in the placebo group. However, in patients who at baseline did not have DR, the number of patients developing retinopathy was similar in the two groups (39% of patients in the intensive therapy group vs. 42% in the placebo group).

The DIRECT- Prevent 1 trial was a randomized, double-blind, placebo-controlled trial in 1,421 normotensive, normoalbuminuric individuals with type 1 diabetes without retinopathy (48). Patients were randomized to candesartan or placebo and followed for 4.7 years. Mean systolic and diastolic BP was reduced by 2.6 mm Hg and 2.7 mm Hg, respectively, in the candesartan group vs. the placebo group. DR developed in 25% of the participants in the candesartan group vs. 31% in the placebo group (18% decrease). 

The Direct Protect 1 was a randomized, double-blind, placebo-controlled trial in 1,905 normotensive, normoalbuminuric patients with type 1 diabetes with existing retinopathy (48). Patients were randomized to candesartan or placebo and followed for 4.7 years. Mean systolic and diastolic BP was reduced by 3.6 mm Hg and 2.5 mm Hg, respectively, in the candesartan group versus the placebo group. There was an identical 13% progression of DR in the placebo and candesartan groups, and progression to the combined secondary endpoint of PDR or clinically significant DME, or both, did not differ between the two groups.

The DIRECT-Protect 2 trial was a randomized, double-blind, placebo-controlled trial in 1,905 normoalbuminuric, normotensive, or treated hypertensive people with type 2 diabetes with mild to moderately severe retinopathy (49). Patients were randomized to candesartan or placebo and followed for 4.7 years. The decrease in systolic/diastolic blood pressure was 4.3/2.5 mm Hg greater in the candesartan group than in the placebo group in individuals who were receiving antihypertensive treatment at baseline (p<0·0001 for both), and for those not on anti-hypertensive therapy at baseline the decrease was 2.9/1.3 mm Hg (p=0.0003/p=0.0045). The risk of progression of retinopathy was non-significantly reduced by 13% in patients on candesartan compared to the placebo group (HR 0.87; p=0.20). However, regression on active treatment was increased by 34% (HR 1.34; p=0.009), and overall change towards less severe retinopathy by the end of the trial was observed in the candesartan group (odds 1.17; p=0.003).

The RASS trial was a controlled trial involving 223 normotensive patients with type 1 diabetes and normoalbuminuria and who were randomly assigned to receive losartan, enalapril, or placebo (50). The systolic and diastolic BP during the study were lower in the enalapril group (113/66 mm Hg) and the losartan group (115/66 mm Hg) than in the placebo group (117/68 mm Hg) (P<0.001 for the two systolic and P≤0.02 for the two diastolic comparisons, respectively). After 5 years progression in DR occurred in 38% of patients receiving placebo but only 25% of those receiving enalapril (P=0.02) and 21% of those receiving losartan (P=0.008).   

META-ANALYSIS OF ACE INHIBITORS AND ARBS             

Many of the studies described above used either an ACE inhibitor or an ARB with variable results on DR. To better understand the effect of RAS inhibitors on DR, a meta-analysis has extensively examined these studies and a number of other trials (51). In 7 studies with 3,705 participants without DR, RAS inhibitors reduced the development of DR by 27% (p= 0.00006). This decrease in the development of DR was seen in patients with both type 1 and type 2 diabetes and patients who were hypertensive or normotensive. In 16 studies with 9,580 participants with pre-existing DR, RAS inhibitors decreased the progression of DR by 13% (p=0.00006). This decrease in progression of DR was seen in patients with both type 1 and type 2 diabetes and patients who were normotensive. In hypertensive patients there was a trend (7% decrease) that was not statistically significant. It should be noted that in the hypertensive patients RAS inhibitors were compared to other hypertensive drugs, and the number of hypertensive participants was relatively small (n=839). Therefore, the absence of a decrease in progression of DR in hypertensive patients is not definitive. Six studies with 2,624 participants examined the effect of RAS inhibitors on inducing regression of DR. RAS inhibitors increased the regression of DR by 39% (p=0.00002), and this beneficial effect was seen in patients with type 1 and type 2 diabetes. ACE inhibitors were more effective in reducing the development, progression, and regression of DR than ARBs. Thus, with the data available, RAS inhibitors appear to have benefits on DR above and beyond their effects on BP control.  

CONCLUSION 

Observational studies have shown an association of elevated BP with a higher risk of DR. As should be obvious from the above discussion, the beneficial effects of lowering BP in hypertensive patients on DR have not produced consistent results. Several large carefully carried out studies have failed to demonstrate a beneficial effect of lowering BP on DR (ACCORD, ADVANCE, ABCD2). Potential reasons for this inconsistency were discussed above. It is unlikely that future studies will provide definitive data on this issue, as lowering BP in hypertensive patients with diabetes to prevent cardiovascular disease is essential, and therefore designing clinical trials regarding DR will be very difficult. From the clinician’s viewpoint, treating hypertension in patients with diabetes to prevent cardiovascular disease is standard therapy and may also have beneficial effects DR. Similar to the beneficial effects on renal disease, RAS inhibitors appear to decrease the development and progression of DR, and therefore when treating patients with diabetes who are hypertensive, one should be preferentially consider RAS inhibitors to lower BP in patients with or at high risk of DR. In normotensive patients the available data suggests that RAS inhibition will have beneficial effects on DR, and further studies in this population are possible and would be informative.          

Hyperlipidemia

Observational studies of the association of plasma lipids with DR have been inconsistent (52) with some studies reporting an increased risk of DR with elevated lipid levels (53-57), while other studies have not observed a relationship between lipid levels and DR (10,38,58-60). Of note a Mendelian randomization study did not demonstrate a causal role of total cholesterol, LDL cholesterol, HDL cholesterol, or triglycerides on DR (61). From the clinician’s point of view the key question is whether lowering lipid levels will have a beneficial effect on DR.

FIBRATES

Small studies in the 1960’s presented evidence that treatment with clofibrate improved diabetic retinopathy (62,63). Larger randomized studies have confirmed these observations.

The Fenofibrate Intervention and Event Lowering in Diabetes (FIELD) study was a randomized trial in patients with Type 2 diabetes. Patients were randomly assigned to receive either fenofibrate 200 mg/day (n=4895) or placebo (n=4900). Laser treatment for retinopathy was significantly lower in the fenofibrate group than in the placebo group (3.4% patients on fenofibrate vs 4.9% on placebo; p=0.0002) (64). Fenofibrate therapy reduced the need for laser therapy to a similar extent for maculopathy (31% decrease) and for proliferative retinopathy (30% decrease). In the ophthalmology sub-study (n=1012), the primary endpoint of 2-step progression of retinopathy grade did not differ significantly between the fenofibrate and control groups (9.6% patients on fenofibrate vs 12.3% on placebo; p=0.19). In patients without pre-existing retinopathy there was no difference in progression (11.4% vs 11.7%; p=0.87). However, in patients with pre-existing retinopathy, significantly fewer patients on fenofibrate had a 2-step progression than did those on placebo (3.1% patients vs 14.6%; p=0.004). A composite endpoint of 2-step progression of retinopathy grade, macular edema, or laser treatments was significantly reduced in the fenofibrate group (HR 0.66, 95% CI 0.47-0.94; p=0.022).

In the ACCORD Study a subgroup of participants was evaluated for the progression of diabetic retinopathy by 3 or more steps on the Early Treatment Diabetic Retinopathy Study Severity Scale or the development of diabetic retinopathy necessitating laser photocoagulation or vitrectomy over a four-year period (24). At 4 years, the rates of progression of diabetic retinopathy were 6.5% with fenofibrate therapy (n=806) vs. 10.2% with placebo (n=787) (adjusted odds ratio, 0.60; 95% CI, 0.42 to 0.87; P = 0.006). Of note, this reduction in the progression of diabetic retinopathy was of a similar magnitude as intensive glycemic treatment vs. standard therapy.

A double-blind, randomized, placebo-controlled study in 296 patients with type 2 diabetes mellitus and DR evaluated the effect of placebo or etofibrate on DR (65). After 12 months an improvement in ocular pathology was more frequent in the etofibrate group vs the placebo group ((46% versus 32%; p< 0.001).

The MacuFen study was a small double-blind, randomized, placebo-controlled study in 110 subjects with DME who did not require immediate photocoagulation or intraocular treatment. Patients were randomized to fenofibric acid or placebo for 1 year. Patients treated with fenofibric acid had a modest improvement in total macular volume that was not statistically significant compared to the placebo group.

Taken together these results indicate that fibrates have beneficial effects on the progression of diabetic retinopathy (66). The mechanisms by which fibrates decrease diabetic retinopathy are unknown, and whether decreases in serum triglyceride levels plays an important role is uncertain. Fibrates activate PPAR alpha, which is expressed in the retina (67). Diabetic PPARα KO mice developed more severe DR while overexpression of PPARα in the retina of diabetic rats significantly alleviated diabetes-induced retinal vascular leakage and retinal inflammation, suggesting that fibrates could have direct effects on the retina to reduce DR (67).

STATINS

Several large database studies have suggested that statin use reduces the development of DR (68-71). Unfortunately, the number of randomized clinical trials testing the hypothesis that statin therapy reduces DR development or progression is very limited.

In a study by Sen and colleagues, 50 patients with diabetes mellitus (Type 1 and 2) with good glycemic control and hypercholesterolemia and having DR were randomized to simvastatin vs. placebo (72). Visual acuity improved in four patients using simvastatin and decreased in seven patients in the placebo group and none in the simvastatin group (P = 0.009). Fundus fluorescein angiography and color fundus photography showed improvement in one patient in the simvastatin group, while seven patients showed worsening in the placebo group (P = 0.009).

In a study by Gupta and colleagues, 30 patients with type 2 diabetes with clinically significant macular edema, dyslipidemia, and grade 4 hard exudates were randomized to receive atorvastatin or no lipid lowering drugs (73). All patients received laser therapy. Ten (66.6%) of 15 patients treated with atorvastatin and two (13.3%) of 15 patients in the control group showed a reduction in hard exudates (P =.007). None of the patients treated with atorvastatin and five (33.3%) of 15 in the control group showed subfoveal lipid migration after laser photocoagulation (P =.04). Regression of macular edema was seen in nine eyes in the atorvastatin group and five in the control group (P =.27).

In a study by Narang and colleagues, 30 patients with clinically significant macular edema with a normal lipid profile were randomly treated with atorvastatin or with no lipid lowering drugs. All patients received laser therapy. After a 6-month follow-up visual acuity, macular edema and hard exudates resolution was not significantly different in the two groups.

The data on the benefit of statin therapy on DR are not very strong. Given the current recommendations to prevent cardiovascular disease, most patients with diabetes are treated with statins, and therefore it is unlikely that large randomized trials of the effect of statin therapy on DR are feasible.

OMEGA-3-FATTY ACIDS

A Study of Cardiovascular Events in Diabetes (ASCEND) was a randomized, placebo controlled, double blind, cardiovascular outcome trial of 1-gram omega-3-fatty acids (400 mg EPA and 300 mg DHA ethyl esters) vs. olive oil placebo in 15,480 patients with diabetes without a history of cardiovascular disease (primary prevention trial) (74). Total cholesterol, HDL-C, and non-HDL-C levels were not significantly altered by omega-3-fatty acid treatment (changes in TG levels were not reported). After a mean follow-up of 7.4 years the development of retinopathy and the need for laser therapy based on self-report was similar in the omega-3-fatty acid and placebo group. Thus, at this time there is no evidence that omega-3-fatty acids influence DR.

NIACIN

It has been estimated that 0.67% of patients treated with niacin develop macular edema (75). 

Pregnancy

Diabetic retinopathy may progress during pregnancy and up to one year postpartum. For additional information on retinopathy during pregnancy see the chapter in Endotext on “Diabetes in Pregnancy” (76).

Genetics

Some individuals develop DR despite good glycemic control and short duration of disease, while others do not develop DR, even with poor glycemic control and longer duration of diabetes (77). Additionally, the strongest environmental factors (duration of diabetes and HbA1c) only explained about 11% of the variation in DR risk in the DCCT trial and 10% in the WESDR study (12,78). Thus, factors other than glycemic control play an important role.  There is a familial relationship in the development of DR, as twin and family studies indicate a genetic basis (79,80). The differences in the prevalence of DR in different ethnic groups may be related to genetic factors (79). Unfortunately, the identification of genetic susceptibility loci for DR through candidate gene approaches, linkage studies, and GWAS has not provided conclusive results (79-81). From a clinician’s point of view, if there is a family history of DR, one should aggressively control risk factors for DR and ensure close eye follow-up.  

SCREENING

The American Academy of Ophthalmology has recommended screening for diabetic retinopathy 5 years after diagnosis in patients with type 1 diabetes, and at the time of diagnosis in patients with type 2 diabetes. Patients without retinopathy should undergo dilated fundus examination annually. If mild non-proliferative diabetic retinopathy (NPDR) is present, exams should be repeated every 9 months. Patients with moderate NPDR should be examined every 6 months. In severe NPDR, exams should be conducted every 3 months. Patients with a new diagnosis of proliferative diabetic retinopathy should be examined every 2 to 3 months, until they are deemed stable, at which point examinations can be performed less frequently. During pregnancy, patients should be examined every 3 months, since retinopathy can progress rapidly in this setting (2019 AAO preferred practice pattern document for monitoring diabetic retinopathy:  https://www.aao.org/preferred-practice-pattern/diabetic-retinopathy-ppp).

The American Diabetes Association 2020 guidelines (5) recommends the following:

  • Adults with type 1 diabetes should have an initial dilated and comprehensive eye examination by an ophthalmologist or optometrist within 5 years after the onset of diabetes.
  • Patients with type 2 diabetes should have an initial dilated and comprehensive eye examination by an ophthalmologist or optometrist at the time of the diabetes diagnosis.
  • If there is no evidence of retinopathy for one or more annual eye exams and glycemia is well controlled, then screening every 1–2 years may be considered. If any level of diabetic retinopathy is present, subsequent dilated retinal examinations should be repeated at least annually by an ophthalmologist or optometrist. If retinopathy is progressing or sight-threatening, then examinations will be required more frequently.
  • Programs that use retinal photography (with remote reading or use of a validated assessment tool) to improve access to diabetic retinopathy screening can be appropriate screening strategies for diabetic retinopathy. Such programs need to provide pathways for timely referral for a comprehensive eye examination when indicated.
  • Women with preexisting type 1 or type 2 diabetes who are planning pregnancy or who are pregnant should be counseled on the risk of development and/or progression of diabetic retinopathy.
  • Eye examinations should occur before pregnancy or in the first trimester in patients with preexisting type 1 or type 2 diabetes, and then patients should be monitored every trimester and for 1 year postpartum as indicated by the degree of retinopathy.

PATHOGENESIS

Various mechanisms account for the features of diabetic retinopathy. Histopathologic analysis shows thickening of capillary basement membranes, microaneurysm formation, loss of pericytes, capillary acellularity, and neovascularization. Microaneurysms, outpouchings of the capillary wall, serve as sites of fluid and lipid leakage, which can lead to the development of diabetic macular edema. Theories on the biochemistry of these end-organ changes include toxic effects from sorbitol accumulation, vascular damage by excessive glycosylation with crosslinking of basement membrane proteins, and activation of protein kinase C-ß2 by vascular endothelial growth factor (VEGF), leading to increased vascular permeability and endothelial cell proliferation. VEGF, produced by the retina in response to hypoxia, is believed to play a central role in the development of neovascularization (1,82). 

CLINICAL FEATURES 

Nonproliferative Diabetic Retinopathy (NPDR)

Studies have found that retinopathy in both insulin-dependent and non-insulin-dependent diabetes occurs 3 to 5 years or more after the onset of diabetes. In the WESDR, the prevalence of at least minimal retinopathy was almost 100% after 20 years (83). A more recent study has confirmed that at least 39% of young persons with diabetes developed retinopathy within the first 10 years (84). The earliest clinical sign of diabetic retinopathy is the microaneurysm, a red dot seen on ophthalmoscopy that varies from 15 to 60 microns in diameter (Figure 1).

Figure 1. Microaneurysms and intraretinal hemorrhages in nonproliferative retinopathy. (UCSF Department of Ophthalmology)

The lesions can be difficult to distinguish from intraretinal hemorrhages on examination, but with fluorescein angiography microaneurysms can be identified easily as punctate spots of hyperfluorescence (Figure 2, 3). By contrast, hemorrhages block the background fluorescence and therefore appear dark.

Figure 2. Microaneurysms: hyperfluorescent dots in early phase of fluorescein angiogram (arrows). (Zuckerberg San Francisco General Hospital, Dept. of Ophthalmology)


Figure 3. Two minutes later, fluorescein leakage from the microaneurysms gives them a hazy appearance. (Zuckerberg San Francisco General Hospital, Dept. of Ophthalmology)

The severity of NPDR can be graded as mild, moderate, severe, or very severe. In mild disease, microaneurysms are present with hemorrhage or hard exudates (lipid transudates). In moderate NPDR, these findings are associated with cotton-wool spots (focal infarcts of the retinal nerve fiber layer or areas of axoplasmic stasis) or intraretinal microvascular abnormalities (vessels that may be either abnormally dilated and tortuous retinal vessels, or intraretinal neovascularization). The “4-2-1 rule” is used to diagnose severe NPDR: criteria are met if hemorrhages and microaneurysms are present in 4 quadrants, or venous beading (Figure 4) is present in 2 quadrants, or moderate intraretinal microvascular abnormalities are present in 1 quadrant. In very severe NPDR, two of these features are present.

The correct evaluation and staging of NPDR is important as a means of assessing the risk of progression. In the ETDRS, eyes with very severe NPDR had a 60-fold increased risk of developing high-risk proliferative retinopathy after 1 year compared with eyes with mild NPDR (85). For eyes with mild or moderate NPDR, early treatment with laser was not warranted, as the benefits in preventing vision loss did not outweigh the side effects (1). By contrast, in very severe NPDR, early laser treatment was often helpful.

Figure 4. Venous beading (arrows) in a case of proliferative diabetic retinopathy. (UCSF Department of Ophthalmology)

Capillary closure can also result in macular ischemia, another cause of vision loss in NPDR. This can be identified clinically as an enlargement of the normal foveal avascular zone on fluorescein angiography (Figure 5).

Figure 5. Capillary dropout around the fovea (white arrow) and in the temporal macula (black arrow). (Zuckerberg San Francisco General Hospital, Dept. of Ophthalmology)

Diabetic Macular Edema (DME) 

Macular edema may be present at all the stages of diabetic retinopathy and is the most common cause of vision loss in nonproliferative diabetic retinopathy. Because of the increased vascular permeability and breakdown of the blood-retinal barrier, fluid and lipids leak into the retina and cause it to swell. This causes photoreceptor dysfunction, leading to vision loss when the center of the macula, the fovea, is affected. In the ETDRS, diabetic macular edema (DME) was characterized as "clinically significant" if any of the following were noted (Figure 6): retinal thickening within 500 microns of the fovea, hard exudates within 500 microns of the fovea if associated with adjacent retinal thickening, or an area of retinal thickening 1 disc diameter or larger if any part of it is located within 1 disc diameter of the fovea (86).

Figure 6. Clinically significant macular edema with hard exudates in the fovea. Cotton-wool spots are present near the major vessels. (UCSF Department of Ophthalmology)

Although the cause of the microvascular changes in diabetes is not fully understood, the deficient oxygenation of the retina may induce an overexpression of vascular endothelial growth factor (VEGF), with a consequent increase in vascular leakage and retinal edema (87). Besides ischemia, inflammation may also play a role in the development of macular edema in diabetic retinopathy. In fact, elevated levels of extracellular carbonic anhydrase have been discovered in the vitreous of patients with diabetic retinopathy (88). Carbonic anhydrase may originate from retinal hemorrhages and erythrocyte lysis and may activate the kallikrein-mediated inflammatory cascade, contributing to the development of DME.

Optical Coherence Tomography (OCT) is a widely used imaging technique that provides high-resolution imaging of the retina (Figure 7) (89). Working as an “optical ultrasound,” OCT projects a light beam and then acquires the light reflected from the retina to provide a cross-sectional image. Most patients with DME have diffuse retinal thickening or cystoid macular edema (presence of intraretinal cystoid-like spaces). In some patients, DME may be associated with posterior hyaloidal traction, serous retinal detachment or traction retinal detachment (90). Cystoid macular edema and posterior hyaloid traction are significantly associated with worse visual acuity (90).

Figure 7. OCT image showing diabetic macular edema (UCSF Department of Ophthalmology).

Proliferative Diabetic Retinopathy (PDR)

In proliferative diabetic retinopathy, many of the changes seen in NPDR are present in addition to neovascularization that extends along the surface of the retina or into the vitreous cavity (Figure 8). These vessels are in loops that may form a network of radiating spokes or may appear disorganized. In many cases the vessels are first noted on the surface of the optic disc, although they can be easily missed due to their fine caliber. Close inspection often reveals that these new vessels cross over both the normal arteries and the normal veins of the retina, a sign of their unregulated growth.

Figure 8. Active neovascularization in PDR. Fibrovascular proliferation overlies the optic disc (white arrow). Loops of new vessels are especially prominent superior to the disc and extending into the macula, where leakage of fluid has led to deposition of a ring of hard exudate around the neovascular net (black arrow). (UCSF Department of Ophthalmology)

New vessels can also appear on the iris, a condition known as rubeosis iridis (Figure 9). When this occurs, careful inspection of the anterior chamber angle is essential, as growth of neovascularization in this location can obstruct aqueous fluid outflow and cause neovascular glaucoma.

Figure 9. Rubeosis iridis in a case of PDR. Abnormal new vessels are growing along the surface of the iris (arrows). (UCSF Dept. of Ophthalmology)

Neovascularization can remain relatively stable or it can grow rapidly; progression can be noted ophthalmoscopically over a period of weeks. Preretinal new vessels often develop an associated white, fibrous tissue component that can increase in size as the vessels regress. The resulting fibrovascular membrane may then develop new vessels at its edges. This cycle of growth and fibrous transformation of diabetic neovascularization is typical. The proliferation occurs on the anterior surface of the retina, and the vessels extend along the posterior surface of the vitreous body. Fibrous proliferation takes place on the posterior vitreous surface; when the vitreous detaches, the vessels can be pulled forward and the thickened posterior vitreous surface can be seen ophthalmoscopically, highlighted by areas of fibrovascular proliferation.

The severity of PDR can be classified as to the presence or absence of high-risk characteristics. As determined in the Diabetic Retinopathy Study, eyes are classified as high-risk if they have 3 of the following 4 characteristics: the presence of any neovascularization; neovascularization on or within 1-disc diameter of the optic disc; a moderate to severe amount of neovascularization (greater than 1/3 disc area neovascularization of the disc, or greater than 1/2 disc area if elsewhere), or vitreous hemorrhage.

Vision loss in proliferative diabetic retinopathy results from three main causes. First, vitreous hemorrhage occurs because the neovascular tissue is subject to vitreous traction. Coughing or vomiting may also trigger a hemorrhage. Hemorrhage may remain in the preretinal space between the retina and the posterior vitreous surface, in which case it may not cause much vision loss if located away from the macula (Figure 10). In other cases, though, hemorrhage can spread throughout the entire vitreous cavity, causing a diffuse opacification of the visual media with marked vision loss (Figure 11, 12).

Figure 10. Preretinal hemorrhage: blood trapped between the retina and the vitreous in a case of incomplete vitreous detachment. Visual acuity is unaffected. (UCSF Department of Ophthalmology)

Figure 11. Left: moderate vitreous hemorrhage; vision = 20/150. Right: 1 year later after spontaneous clearing of the hemorrhage; vision = 20/30. (Zuckerberg San Francisco General Hospital, Dept. of Ophthalmology)

Figure 12. Dense vitreous hemorrhage almost completely obscuring the view of the fundus. (Zuckerberg San Francisco General Hospital, Dept. of Ophthalmology)

Another cause of severe vision loss in PDR is retinal detachment. As the fibrovascular membranes and vitreous contract, their attachments to the retina can cause focal elevations of the retina, resulting in a traction retinal detachment (Figure 13). In other cases the retinal vessels can be avulsed or retinal holes may be created by this traction, leading to a combined traction-rhegmatogenous retinal detachment (Figure 14).

Figure 13. Marked fibrosis with traction exerted on the retina outside the central macula (arrows). The macula does not appear to be elevated centrally. (UCSF Dept. of Ophthalmology)

Figure 14. Traction retinal detachment outside the macula. Note elevation of retinal vessel out of the plane of focus (white arrow). Scatter photocoagulation scars are seen peripherally (black arrow). (UCSF Dept. of Ophthalmology)

Finally, patients with PDR may have macular nonperfusion or coexisting diabetic macular edema that causes vision loss through photoreceptor dysfunction.

TREATMENT

Tight glucose and blood pressure control are critical systemic factors in controlling the progression of diabetic retinopathy. Ocular complications of diabetes are addressed directly through treatment with laser photocoagulation, intravitreal injections, or surgery. Laser treatment has been the primary approach to vision-threatening diabetic retinopathy for decades. Recent randomized clinical trials have demonstrated that intravitreal anti-VEGF agents are more effective than laser under certain conditions.

Laser Photocoagulation for NPDR

Diabetic macular edema is believed to result from fluid and lipid transudation from microaneurysms and telangiectatic capillaries. Focal laser photocoagulation is used to heat and close the microaneurysms, causing them to stop leaking (Figure 15). Macular edema often improves following this form of treatment. Some clinicians apply laser burns in a grid pattern overlying areas of retinal edema without directing treatment to specific microaneurysms; this method can also be effective in reducing retinal thickening. The mechanism by which grid laser treatment achieves these results is not known.

The ETDRS found that the risk of moderate visual loss in eyes with diabetic macular edema was reduced by 50% by photocoagulation (91,92). At 3 years, 24% of untreated eyes experienced a 3-line decrease in vision compared with 12% of treated eyes. Eyes meeting the criteria for clinically significant macular edema in which the edema was closest to the center were most likely to benefit from treatment. Side effects of laser treatment can include scotomata, noticeable immediately after the procedure, if treatment is performed too close to the fovea. Late enlargement of laser scars can also occur, causing delayed visual loss. Inadvertent photocoagulation of the fovea is a risk of the procedure. Since the amount of energy used is minimal, the treatment is performed under topical anesthesia.

In the ETDRS study, only a very small percentage of eyes improved with focal laser treatment, highlighting the fact that the goal of laser treatment is not to improve vision, but rather to stabilize it and prevent worsening. It is also true that inclusion criteria for that study were based on the presence of “clinically significant” macular edema threatening the macula, even if the visual acuity was not yet reduced. For this reason, it has been argued that the study enrolled patients with excellent visual acuity, making it difficult to demonstrate small improvements in vision after laser treatment.

Due to the recent evidence on the efficacy and safety of anti-VEGF therapy for diabetic macular edema, different modalities of laser therapy have been proposed. Laser may be able to stabilize macular edema and reduce the need for multiple anti-VEGF injections. Modified ETDRS laser techniques include lower intensity laser burns, and they take particular care in maintaining a greater space from the center of the fovea (93). Subthreshold laser therapy and minimalistic FA-guided treatment of microaneurysms may also induce less damage to the macula than the classic ETDRS approach (94).

Figure 15. Focal laser scars in the macula following treatment for macular edema (arrow). Edema has resolved. (Zuckerberg San Francisco General Hospital, Dept. of Ophthalmology) 

Laser Photocoagulation for PDR

Scatter laser photocoagulation, also known as panretinal photocoagulation (PRP), is an important treatment modality for PDR and severe NPDR (92). Laser spots are placed from outside the major vascular arcades to the equator of the eye, with burns spaced approximately 1/2 to 1 burn width apart (Figure 16, 17). Although the treatment destroys normal retina, the central vision is unaffected since all spots are placed outside the macula. The theory underlying this treatment is that photocoagulation of the ischemic peripheral retina decreases the elaboration of vasoproliferative factors contributing to PDR. Indeed, VEGF levels in the vitreous are increased in eyes with neovascularization, and they are lower after scatter photocoagulation (95). Other factors such as insulin-like growth factor-1 are similarly elevated in the vitreous of eyes with PDR (96).

Side effects of scatter photocoagulation can include decreased night vision and dark adaptation, and visual field loss. The procedure can be painful, so treatment may be divided into several sessions, and either topical or retrobulbar anesthesia may be used.

Figure 16. Scatter photocoagulation scars in an eye with active PDR. Note that all scatter laser scars are located outside the macula. (UCSF Department of Ophthalmology)

Figure 17. View of laser scars superior to the macula in the same eye. Spots are approximately one-half burn width apart. In the treated area, the retinal vessels are sclerotic (arrows). (UCSF Department of Ophthalmology)

The Diabetic Retinopathy Study evaluated the effects of scatter photocoagulation in over 1700 patients with PDR or severe NPDR. Patients had one eye randomized to treatment and one eye to observation. Treatment was shown to reduce severe visual loss by 50% (97). The ETDRS also found a positive risk-benefit ratio for early scatter treatment in patients with severe NPDR or early PDR. Interestingly, a subsequent study demonstrated that scatter laser performed at a single sitting was not worse than treatment divided over four sessions in terms of inducing macular edema or decreasing visual acuity (98).

Panretinal photocoagulation may induce or aggravate diabetic macular edema, reduce contrast sensitivity and affect the peripheral visual field (85). Macular edema can be approached by focal laser or intravitreal injections before or at the time of panretinal photocoagulation. However, it is not recommended to delay panretinal photocoagulation in high-risk PDR.

The DRCR.net study protocol S has shown that intravitreal anti-VEGF agents may be a substitute for panretinal laser treatment (99). This multicenter randomized clinical trial compared ranibizumab to PRP in patients with PDR. Mean visual acuity letter improvement at 2 years was +2.8 in the ranibizumab group vs +0.2 in the PRP group (P < 0.001). Mean peripheral visual field sensitivity loss was worse, vitrectomy was more frequent, and DME development was more common in the PRP group. Further studies are needed in order to evaluate the long-term implications of using anti-VEGF agents alone. Ranibizumab may be a reasonable treatment alternative to consider for patients with severe NPDR or non-high-risk PDR who can follow-up regularly.

Corticosteroids for DME

It has been demonstrated that corticosteroids stabilize the blood-retinal barrier, inhibiting leukostasis and modulating the expression of VEGF receptor (100). On this basis, periocular and intraocular injections and sustained-release steroid implants have been utilized for the treatment of diabetic macular edema. It should be remembered that any of these different methods to deliver corticosteroids to the macula carry a potential risk of increasing the intraocular pressure (glaucoma) and inducing cataract.

The use of intravitreal triamcinolone acetonide has become accepted as a treatment option for diabetic macular edema. Several formulations are available: Kenalog-40, which has a black box warning against intraocular use, and the preservative-free Triesence. Preliminary data from a randomized clinical trial showed that intravitreal corticosteroids induced a noticeable improvement of visual acuity and foveal thickness in patients with severe, refractory DME (101). However, intravitreal steroids do not appear to be more efficacious than laser treatment in giving a stable, sustained improvement in vision in the long run, as demonstrated by a recent large study (102).

A peribulbar corticosteroid injection is of particular interest for eyes with DME that have good visual acuity where the risks of an intravitreal injection may not be justified. Any intravitreal injection through the pars plana, in fact, may directly damage the crystalline lens or cause a severe, sight-threatening infection of the eye (bacterial endophthalmitis). Unfortunately, in 2007 a randomized clinical trial showed that peribulbar triamcinolone, with or without focal photocoagulation, is not effective in cases of mild DME with good visual acuity (103).

The fact that triamcinolone maintains measurable concentrations in the vitreous cavity for approximately 3 months stimulated further studies on sustained-release or biodegradable intraocular implants that can deliver steroids for a longer period of time.

A fluocinolone acetonide implant (Retisert) was investigated in a multicenter, randomized clinical trial for the treatment of diabetic macular edema. Although the efficacy of this surgically implanted material was demonstrated, it induced cataract in virtually all phakic patients and severe glaucoma needing surgery in 28% of eyes (104,105).

A biodegradable dexamethasone implant (Ozurdex), now approved for the treatment of DME, has demonstrated similar efficacy with more acceptable side effects. At day 90, a visual acuity improvement of 10 letters or more was seen in more eyes in the Ozurdex group (33.3%) than the observation group (12.3%; P = .007), but the statistical significance was lost at day 180 (106). The implant was generally well tolerated.

A smaller device releasing fluocinolone acetonide, implantable suturelessly with an office procedure thorough a 25-gauge needle, has been recently approved for DME in the USA (Iluvien). This implant has been evaluated in the FAME (Fluocinolone Acetonide in Diabetic Macular Edema) study where 956 patients were randomized worldwide (107). At month 36, the percentage of patients who gained ≥15 in letter score was 28% compared with 19% (P = 0.018) in the sham group. In patients who reported duration of DME ≥3 years at baseline; the percentage who gained ≥15 in letter score at month 36 was 34.0% compared with 13.4%. Almost all phakic patients in the insert group developed cataract, but their visual benefit after cataract surgery was similar to that in pseudophakic patients. The rate of glaucoma surgery at month 36 was 5% (108).

Anti-VEGF Drugs for DME 

Vascular endothelial growth factor (VEGF) is an angiogenic factor that plays a key role in the breakdown of the blood–retina barrier and is significantly elevated in eyes with diabetic macular edema (109). Antibody fragments that bind VEGF and inhibit angiogenesis were originally developed as intraocular injection for the treatment of exudative age-related macular degeneration. These anti-VEGF drugs have been tested for the treatment of DME with interesting results.

The first agent that became available was Pegaptanib 0.3 mg (Macugen) (110). A randomized trial demonstrated after 2 years of therapy a gain of 6.1 letters in the pegaptanib arm versus 1.3 letters for sham (P<0.01) (111). Since it is targeted to the isoform VEGF-165 only, it is generally considered very safe but possibly less effective than newer anti-VEGF drugs.

Bevacizumab (Avastin), directed to all the isoforms of VEGF, has been used off-label for the treatment of DME worldwide. The first evidence came from a study on 121 patients with DME followed over 3 months in a phase II randomized clinical trial (112). Recently, the BOLT study demonstrated a mean gain of 8.6 letters for bevacizumab versus a mean loss of 0.5 letters when compared to classic macular laser. The patients received a mean of 13 injections over two years, and the treatment was well tolerated with no progression of macular ischemia (113).

Ranibizumab (Lucentis) binds all isoforms of VEGF and is FDA approved for the treatment of diabetic macular edema. In the Ranibizumab for Edema of the Macula in Diabetes (READ-2) study, ranibizumab-only was superior to laser and to combined therapy (114). The RESTORE study confirmed that ranibizumab monotherapy and combined with laser was superior to standard laser. At 1 year, no differences were detected between the ranibizumab and ranibizumab plus laser arms (115). A larger DRCR study supported ranibizumab plus prompt or deferred photocoagulation as a mainstay of current therapy for patients with DME (116). In the RESOLVE study, at month 12, mean visual acuity improved from baseline by 10.3±9.1 letters with ranibizumab and declined by 1.4±14.2 letters with sham (P<0.0001) (117). The RISE and RIDE studies confirmed the efficacy and the safety of intravitreal monthly injections of ranibizumab with similar results (118).

Aflibercept (Eylea), active against all VEGF-A isoforms, is also FDA-approved for the treatment of DME. In the DA-VINCI study, the different dose regimens of aflibercept demonstrated a mean improvement in visual acuity of 10 to 13 letters versus -1.3 letters for the laser group with a large proportion of eyes (about 40%) gaining 15 or more ETDRS letters at week 52 (119).

More recently, The Diabetic Retinopathy Clinical Research Network Protocol T compared bevacizumab, ranibizumab, and aflibercept in the treatment of center-involving CSME (120). When the initial visual-acuity loss was mild, there were no significant differences among study groups. However, at worse levels of initial visual acuity (20/50 or worse), aflibercept was more effective than bevacizumab. The differences between bevacizumab and ranibizumab and between ranibizumab and aflibercept were not statistically significant.

Currently, on the basis of the above evidence, anti-VEGF therapy is first-line therapy for center-involving macular edema, with possible deferred focal laser treatment. It should be mentioned that adverse side effects associated with intravitreal injections are uncommon but severe and include infectious endophthalmitis, cataract formation, retinal detachment, and elevated IOP. 

Vitreous Surgery for PDR

Surgery may be necessary for eyes in advanced PDR with either vitreous hemorrhage or retinal detachment. In the case of vitreous hemorrhage, many cases will clear spontaneously. For this reason, clinicians often wait 3 to 6 months or more before performing vitrectomy surgery. If surgery is indicated because of persistent non-clearing hemorrhage, retinal detachment involving the macula, or vitreous hemorrhage with neovascularization of the anterior chamber angle (a precursor of neovascular glaucoma), then vitrectomy is performed via a pars plana approach. The vitreous is removed, fibrovascular membranes are dissected away from the retina, retinal detachment is repaired, and scatter laser treatment is applied at the time of surgery via direct intraocular application.

The Diabetic Retinopathy Vitrectomy Study assessed the value of early vitrectomy in patients with severe PDR. The study found that early intervention increased the likelihood of obtaining 20/40 vision or better in eyes with recent severe vitreous hemorrhage or severe PDR. Compared with 15% of control eyes, 25% of treated eyes achieved this level of vision at 2 years (109). In type 1 diabetes, the benefit of early surgery was even more pronounced, with 36% of treated eyes achieving 20/40 vision compared to 12% of control eyes. The importance of this study, performed between 1976 and 1983 when vitrectomy techniques were much less advanced than they are today, was that it showed conventional “watch and wait” management will not necessarily lead to the best visual outcomes in cases of severe PDR. In practice, clinicians evaluate the risks and benefits of each option before proceeding with scatter photocoagulation, vitrectomy, or observation in such cases.

Recently, the DRCR Protocol D evaluated the effects of pars plana vitrectomy in eyes with moderate vision loss from DME and vitreomacular traction. Although retinal thickness was generally reduced, visual acuity results were less consistent (121). Vitrectomy for refractory, chronic diabetic macular edema in the absence of vitreomacular traction should be reserved to selected cases.

Intravitreal ocriplasmin (Jetrea) is able to induce enzymatic vitreolysis and posterior vitreous detachment and could have a role, eventually associated with vitrectomy, in the treatment of vitreomacular traction and macular edema in diabetic retinopathy (122). 

NOVEL THERAPIES FOR DIABETIC RETINOPATHY

Current therapies are limited in their ability to reverse vision loss in diabetic retinopathy. For example, although focal laser photocoagulation can help stabilize vision by reducing macular edema, it rarely improves vision. Corticosteroids induce cataract progression and intraocular pressure elevation. Anti-VEGF agents do not increase cataract formation rates but they generally need more frequent intravitreal injections, carrying the risk of endophthalmitis; they can temporary increase IOP; they might have systemic adverse effects. For addressing these issues, new sustained-release devices are being designed, and studies are ongoing to test new intravitreal medications.

The development of new treatment modalities is being guided by an understanding of the mechanisms of the disease. From this perspective, researchers are now focusing on the role of inflammation on DME. NSAIDs, anti-TNF agents (Etanercept and Remicade), mecamylamine (an antagonist of nACh receptors), and intravitreal erythropoietin are currently under investigation for the treatment of refractory diabetic macular edema (123).

In order to create a national taskforce to study and treat diabetic retinopathy, in 2002 the National Eye Institute instituted the Diabetic Retinopathy Clinical Research Network (www.drcr.net). DRCR is a collaborative network dedicated to design and carry out multicenter clinical trials on diabetic retinopathy and diabetic macular edema. The DRCR network currently includes over 150 participating sites with over 500 physicians throughout the United States.

The DRCR Network has an ongoing project to study genes involved in diabetic retinopathy.

CONCLUSION

Retinopathy remains a challenging complication of diabetes that can adversely affect a patient’s quality of life. Although ophthalmologists can often stabilize the condition or reduce vision loss, prevention and early detection remain the most effective ways to preserve good vision in patients with diabetes. Ensuring tight glucose and blood pressure control and referring patients for ophthalmologic examination are important ways in which internists and other clinicians can help to maximize their patients’ vision and therefore their quality of life. New treatments may offer greater hope for sustained visual improvement in patients with diabetic retinopathy.

REFERENCES

  1. Amoaku WM, Ghanchi F, Bailey C, Banerjee S, Banerjee S, Downey L, Gale R, Hamilton R, Khunti K, Posner E, Quhill F, Robinson S, Setty R, Sim D, Varma D, Mehta H. Diabetic retinopathy and diabetic macular oedema pathways and management: UK Consensus Working Group. Eye (Lond) 2020; 34:1-51
  2. Sabanayagam C, Yip W, Ting DS, Tan G, Wong TY. Ten Emerging Trends in the Epidemiology of Diabetic Retinopathy. Ophthalmic Epidemiol 2016; 23:209-222
  3. Ting DS, Cheung GC, Wong TY. Diabetic retinopathy: global prevalence, major risk factors, screening practices and public health challenges: a review. Clin Exp Ophthalmol 2016; 44:260-277
  4. Wong TY, Cheung CM, Larsen M, Sharma S, Simo R. Diabetic retinopathy. Nat Rev Dis Primers 2016; 2:16012
  5. American Diabetes A. 11. Microvascular Complications and Foot Care: Standards of Medical Care in Diabetes-2020. Diabetes Care 2020; 43:S135-S151
  6. Barrett EJ, Liu Z, Khamaisi M, King GL, Klein R, Klein BEK, Hughes TM, Craft S, Freedman BI, Bowden DW, Vinik AI, Casellini CM. Diabetic Microvascular Disease: An Endocrine Society Scientific Statement. J Clin Endocrinol Metab 2017; 102:4343-4410
  7. Klein R, Knudtson MD, Lee KE, Gangnon R, Klein BE. The Wisconsin Epidemiologic Study of Diabetic Retinopathy: XXII the twenty-five-year progression of retinopathy in persons with type 1 diabetes. Ophthalmology 2008; 115:1859-1868
  8. Fong DS, Aiello L, Gardner TW, King GL, Blankenship G, Cavallerano JD, Ferris FL, 3rd, Klein R, American Diabetes A. Diabetic retinopathy. Diabetes Care 2003; 26:226-229
  9. Zhang X, Saaddine JB, Chou CF, Cotch MF, Cheng YJ, Geiss LS, Gregg EW, Albright AL, Klein BE, Klein R. Prevalence of diabetic retinopathy in the United States, 2005-2008. JAMA 2010; 304:649-656
  10. Wong TY, Klein R, Islam FM, Cotch MF, Folsom AR, Klein BE, Sharrett AR, Shea S. Diabetic retinopathy in a multi-ethnic cohort in the United States. Am J Ophthalmol 2006; 141:446-455
  11. Yau JW, Rogers SL, Kawasaki R, Lamoureux EL, Kowalski JW, Bek T, Chen SJ, Dekker JM, Fletcher A, Grauslund J, Haffner S, Hamman RF, Ikram MK, Kayama T, Klein BE, Klein R, Krishnaiah S, Mayurasakorn K, O'Hare JP, Orchard TJ, Porta M, Rema M, Roy MS, Sharma T, Shaw J, Taylor H, Tielsch JM, Varma R, Wang JJ, Wang N, West S, Xu L, Yasuda M, Zhang X, Mitchell P, Wong TY, Meta-Analysis for Eye Disease Study Group. Global prevalence and major risk factors of diabetic retinopathy. Diabetes Care 2012; 35:556-564
  12. Antonetti DA, Klein R, Gardner TW. Diabetic retinopathy. N Engl J Med 2012; 366:1227-1239
  13. Wong TY, Mwamburi M, Klein R, Larsen M, Flynn H, Hernandez-Medina M, Ranganathan G, Wirostko B, Pleil A, Mitchell P. Rates of progression in diabetic retinopathy during different time periods: a systematic review and meta-analysis. Diabetes Care 2009; 32:2307-2313
  14. Tam VH, Lam EP, Chu BC, Tse KK, Fung LM. Incidence and progression of diabetic retinopathy in Hong Kong Chinese with type 2 diabetes mellitus. J Diabetes Complications 2009; 23:185-193
  15. Chase HP, Jackson WE, Hoops SL, Cockerham RS, Archer PG, O'Brien D. Glucose control and the renal and retinal complications of insulin-dependent diabetes. JAMA 1989; 261:1155-1160
  16. Stratton IM, Kohner EM, Aldington SJ, Turner RC, Holman RR, Manley SE, Matthews DR. UKPDS 50: risk factors for incidence and progression of retinopathy in Type II diabetes over 6 years from diagnosis. Diabetologia 2001; 44:156-163
  17. Wang PH, Lau J, Chalmers TC. Meta-analysis of effects of intensive blood-glucose control on late complications of type I diabetes. Lancet 1993; 341:1306-1309
  18. Diabetes Control Complications Trial Research Group, Nathan DM, Genuth S, Lachin J, Cleary P, Crofford O, Davis M, Rand L, Siebert C. The effect of intensive treatment of diabetes on the development and progression of long-term complications in insulin-dependent diabetes mellitus. N Engl J Med 1993; 329:977-986
  19. Nathan DM, Bayless M, Cleary P, Genuth S, Gubitosi-Klug R, Lachin JM, Lorenzi G, Zinman B, Dcct Edic Research Group. Diabetes control and complications trial/epidemiology of diabetes interventions and complications study at 30 years: advances and contributions. Diabetes 2013; 62:3976-3986
  20. Ohkubo Y, Kishikawa H, Araki E, Miyata T, Isami S, Motoyoshi S, Kojima Y, Furuyoshi N, Shichiri M. Intensive insulin therapy prevents the progression of diabetic microvascular complications in Japanese patients with non-insulin-dependent diabetes mellitus: a randomized prospective 6-year study. Diabetes Res Clin Pract 1995; 28:103-117
  21. Shichiri M, Kishikawa H, Ohkubo Y, Wake N. Long-term results of the Kumamoto Study on optimal diabetes control in type 2 diabetic patients. Diabetes Care 2000; 23 Suppl 2:B21-29
  22. Intensive blood-glucose control with sulphonylureas or insulin compared with conventional treatment and risk of complications in patients with type 2 diabetes (UKPDS 33). UK Prospective Diabetes Study (UKPDS) Group. Lancet 1998; 352:837-853
  23. Holman RR, Paul SK, Bethel MA, Matthews DR, Neil HA. 10-year follow-up of intensive glucose control in type 2 diabetes. N Engl J Med 2008; 359:1577-1589
  24. ACCORD Study Group, ACCORD Eye Study Group, Chew EY, Ambrosius WT, Davis MD, Danis RP, Gangaputra S, Greven CM, Hubbard L, Esser BA, Lovato JF, Perdue LH, Goff DC, Jr., Cushman WC, Ginsberg HN, Elam MB, Genuth S, Gerstein HC, Schubart U, Fine LJ. Effects of medical therapies on retinopathy progression in type 2 diabetes. N Engl J Med 2010; 363:233-244
  25. Ismail-Beigi F, Craven T, Banerji MA, Basile J, Calles J, Cohen RM, Cuddihy R, Cushman WC, Genuth S, Grimm RH, Jr., Hamilton BP, Hoogwerf B, Karl D, Katz L, Krikorian A, O'Connor P, Pop-Busui R, Schubart U, Simmons D, Taylor H, Thomas A, Weiss D, Hramiak I, ACCORD Trial group. Effect of intensive treatment of hyperglycaemia on microvascular outcomes in type 2 diabetes: an analysis of the ACCORD randomised trial. Lancet 2010; 376:419-430
  26. Action to Control Cardiovascular Risk in Diabetes Follow-On Eye Study Group, the Action to Control Cardiovascular Risk in Diabetes Follow-On Study Group. Persistent Effects of Intensive Glycemic Control on Retinopathy in Type 2 Diabetes in the Action to Control Cardiovascular Risk in Diabetes (ACCORD) Follow-On Study. Diabetes Care 2016; 39:1089-1100
  27. Advance Collaborative Group, Patel A, MacMahon S, Chalmers J, Neal B, Billot L, Woodward M, Marre M, Cooper M, Glasziou P, Grobbee D, Hamet P, Harrap S, Heller S, Liu L, Mancia G, Mogensen CE, Pan C, Poulter N, Rodgers A, Williams B, Bompoint S, de Galan BE, Joshi R, Travert F. Intensive blood glucose control and vascular outcomes in patients with type 2 diabetes. N Engl J Med 2008; 358:2560-2572
  28. Duckworth W, Abraira C, Moritz T, Reda D, Emanuele N, Reaven PD, Zieve FJ, Marks J, Davis SN, Hayward R, Warren SR, Goldman S, McCarren M, Vitek ME, Henderson WG, Huang GD, VADT Investigators. Glucose control and vascular complications in veterans with type 2 diabetes. N Engl J Med 2009; 360:129-139
  29. Zoungas S, Arima H, Gerstein HC, Holman RR, Woodward M, Reaven P, Hayward RA, Craven T, Coleman RL, Chalmers J, Collaborators on Trials of Lowering Glucose Group. Effects of intensive glucose control on microvascular outcomes in patients with type 2 diabetes: a meta-analysis of individual participant data from randomised controlled trials. Lancet Diabetes Endocrinol 2017; 5:431-437
  30. Hemmingsen B, Lund SS, Gluud C, Vaag A, Almdal T, Hemmingsen C, Wetterslev J. Intensive glycaemic control for patients with type 2 diabetes: systematic review with meta-analysis and trial sequential analysis of randomised clinical trials. BMJ 2011; 343:d6898
  31. Hooymans JM, Ballegooie EV, Schweitzer NM, Doorebos H, Reitsma WD, Slutter WJ. Worsening of diabetic retinopathy with strict control of blood sugar. Lancet 1982; 2:438
  32. Lauritzen T, Frost-Larsen K, Larsen HW, Deckert T. Two-year experience with continuous subcutaneous insulin infusion in relation to retinopathy and neuropathy. Diabetes 1985; 34 Suppl 3:74-79
  33. Kroc Collaborative Study Group. Blood glucose control and the evolution of diabetic retinopathy and albuminuria. A preliminary multicenter trial. N Engl J Med 1984; 311:365-372
  34. Lauritzen T, Frost-Larsen K, Larsen HW, Deckert T. Effect of 1 year of near-normal blood glucose levels on retinopathy in insulin-dependent diabetics. Lancet 1983; 1:200-204
  35. Early worsening of diabetic retinopathy in the Diabetes Control and Complications Trial. Arch Ophthalmol 1998; 116:874-886
  36. Bain SC, Klufas MA, Ho A, Matthews DR. Worsening of diabetic retinopathy with rapid improvement in systemic glucose control: A review. Diabetes Obes Metab 2019; 21:454-466
  37. Klein R, Klein BE, Moss SE, Davis MD, DeMets DL. Is blood pressure a predictor of the incidence or progression of diabetic retinopathy? Arch Intern Med 1989; 149:2427-2432
  38. Tapp RJ, Shaw JE, Harper CA, de Courten MP, Balkau B, McCarty DJ, Taylor HR, Welborn TA, Zimmet PZ, AusDiab Study Group. The prevalence of and factors associated with diabetic retinopathy in the Australian population. Diabetes Care 2003; 26:1731-1737
  39. Leske MC, Wu SY, Hennis A, Hyman L, Nemesure B, Yang L, Schachat AP, Barbados Eye Study Group. Hyperglycemia, blood pressure, and the 9-year incidence of diabetic retinopathy: the Barbados Eye Studies. Ophthalmology 2005; 112:799-805
  40. Tight blood pressure control and risk of macrovascular and microvascular complications in type 2 diabetes: UKPDS 38. UK Prospective Diabetes Study Group. BMJ 1998; 317:703-713
  41. Matthews DR, Stratton IM, Aldington SJ, Holman RR, Kohner EM, U. K. Prospective Diabetes Study Group. Risks of progression of retinopathy and vision loss related to tight blood pressure control in type 2 diabetes mellitus: UKPDS 69. Arch Ophthalmol 2004; 122:1631-1640
  42. Holman RR, Paul SK, Bethel MA, Neil HA, Matthews DR. Long-term follow-up after tight control of blood pressure in type 2 diabetes. N Engl J Med 2008; 359:1565-1576
  43. Effects of ramipril on cardiovascular and microvascular outcomes in people with diabetes mellitus: results of the HOPE study and MICRO-HOPE substudy. Heart Outcomes Prevention Evaluation Study Investigators. Lancet 2000; 355:253-259
  44. Beulens JW, Patel A, Vingerling JR, Cruickshank JK, Hughes AD, Stanton A, Lu J, Mc GTSA, Grobbee DE, Stolk RP. Effects of blood pressure lowering and intensive glucose control on the incidence and progression of retinopathy in patients with type 2 diabetes mellitus: a randomised controlled trial. Diabetologia 2009; 52:2027-2036
  45. Estacio RO, Jeffers BW, Gifford N, Schrier RW. Effect of blood pressure control on diabetic microvascular complications in patients with hypertension and type 2 diabetes. Diabetes Care 2000; 23 Suppl 2:B54-64
  46. Chaturvedi N, Sjolie AK, Stephenson JM, Abrahamian H, Keipes M, Castellarin A, Rogulja-Pepeonik Z, Fuller JH. Effect of lisinopril on progression of retinopathy in normotensive people with type 1 diabetes. The EUCLID Study Group. EURODIAB Controlled Trial of Lisinopril in Insulin-Dependent Diabetes Mellitus. Lancet 1998; 351:28-31
  47. Schrier RW, Estacio RO, Esler A, Mehler P. Effects of aggressive blood pressure control in normotensive type 2 diabetic patients on albuminuria, retinopathy and strokes. Kidney Int 2002; 61:1086-1097
  48. Chaturvedi N, Porta M, Klein R, Orchard T, Fuller J, Parving HH, Bilous R, Sjolie AK, Direct Programme Study Group. Effect of candesartan on prevention (DIRECT-Prevent 1) and progression (DIRECT-Protect 1) of retinopathy in type 1 diabetes: randomised, placebo-controlled trials. Lancet 2008; 372:1394-1402
  49. Sjolie AK, Klein R, Porta M, Orchard T, Fuller J, Parving HH, Bilous R, Chaturvedi N, Direct Programme Study Group. Effect of candesartan on progression and regression of retinopathy in type 2 diabetes (DIRECT-Protect 2): a randomised placebo-controlled trial. Lancet 2008; 372:1385-1393
  50. Mauer M, Zinman B, Gardiner R, Suissa S, Sinaiko A, Strand T, Drummond K, Donnelly S, Goodyer P, Gubler MC, Klein R. Renal and retinal effects of enalapril and losartan in type 1 diabetes. N Engl J Med 2009; 361:40-51
  51. Wang B, Wang F, Zhang Y, Zhao SH, Zhao WJ, Yan SL, Wang YG. Effects of RAS inhibitors on diabetic retinopathy: a systematic review and meta-analysis. Lancet Diabetes Endocrinol 2015; 3:263-274
  52. Lim LS, Wong TY. Lipids and diabetic retinopathy. Expert Opin Biol Ther 2012; 12:93-105
  53. Chew EY, Klein ML, Ferris FL, 3rd, Remaley NA, Murphy RP, Chantry K, Hoogwerf BJ, Miller D. Association of elevated serum lipid levels with retinal hard exudate in diabetic retinopathy. Early Treatment Diabetic Retinopathy Study (ETDRS) Report 22. Arch Ophthalmol 1996; 114:1079-1084
  54. Rema M, Srivastava BK, Anitha B, Deepa R, Mohan V. Association of serum lipids with diabetic retinopathy in urban South Indians--the Chennai Urban Rural Epidemiology Study (CURES) Eye Study--2. Diabet Med 2006; 23:1029-1036
  55. Salinero-Fort MA, San Andres-Rebollo FJ, de Burgos-Lunar C, Arrieta-Blanco FJ, Gomez-Campelo P, Madiabetes Group. Four-year incidence of diabetic retinopathy in a Spanish cohort: the MADIABETES study. PLoS One 2013; 8:e76417
  56. Sinav S, Onelge MA, Onelge S, Sinav B. Plasma lipids and lipoproteins in retinopathy of type I (insulin-dependent) diabetic patients. Ann Ophthalmol 1993; 25:64-66
  57. Lyons TJ, Jenkins AJ, Zheng D, Lackland DT, McGee D, Garvey WT, Klein RL. Diabetic retinopathy and serum lipoprotein subclasses in the DCCT/EDIC cohort. Invest Ophthalmol Vis Sci 2004; 45:910-918
  58. Zhou Y, Wang C, Shi K, Yin X. Relationship between dyslipidemia and diabetic retinopathy: A systematic review and meta-analysis. Medicine (Baltimore) 2018; 97:e12283
  59. Klein BE, Moss SE, Klein R, Surawicz TS. The Wisconsin Epidemiologic Study of Diabetic Retinopathy. XIII. Relationship of serum cholesterol to retinopathy and hard exudate. Ophthalmology 1991; 98:1261-1265
  60. Klein R, Sharrett AR, Klein BE, Moss SE, Folsom AR, Wong TY, Brancati FL, Hubbard LD, Couper D, Aric Group. The association of atherosclerosis, vascular risk factors, and retinopathy in adults with diabetes : the atherosclerosis risk in communities study. Ophthalmology 2002; 109:1225-1234
  61. Sobrin L, Chong YH, Fan Q, Gan A, Stanwyck LK, Kaidonis G, Craig JE, Kim J, Liao WL, Huang YC, Lee WJ, Hung YJ, Guo X, Hai Y, Ipp E, Pollack S, Hancock H, Price A, Penman A, Mitchell P, Liew G, Smith AV, Gudnason V, Tan G, Klein BEK, Kuo J, Li X, Christiansen MW, Psaty BM, Sandow K, Asian Genetic Epidemiology Network C, Jensen RA, Klein R, Cotch MF, Wang JJ, Jia Y, Chen CJ, Chen YI, Rotter JI, Tsai FJ, Hanis CL, Burdon KP, Wong TY, Cheng CY. Genetically Determined Plasma Lipid Levels and Risk of Diabetic Retinopathy: A Mendelian Randomization Study. Diabetes 2017; 66:3130-3141
  62. Harrold BP, Marmion VJ, Gough KR. A double-blind controlled trial of clofibrate in the treatment of diabetic retinopathy. Diabetes 1969; 18:285-291
  63. Duncan LJ, Cullen JF, Ireland JT, Nolan J, Clarke BF, Oliver MF. A three-year trial of atromid therapy in exudative diabetic retinopathy. Diabetes 1968; 17:458-467
  64. Keech AC, Mitchell P, Summanen PA, O'Day J, Davis TM, Moffitt MS, Taskinen MR, Simes RJ, Tse D, Williamson E, Merrifield A, Laatikainen LT, d'Emden MC, Crimet DC, O'Connell RL, Colman PG, FIELD Study Investigators. Effect of fenofibrate on the need for laser treatment for diabetic retinopathy (FIELD study): a randomised controlled trial. Lancet 2007; 370:1687-1697
  65. Emmerich KH, Poritis N, Stelmane I, Klindzane M, Erbler H, Goldsteine J, Gortelmeyer R. [Efficacy and safety of etofibrate in patients with non-proliferative diabetic retinopathy]. Klin Monbl Augenheilkd 2009; 226:561-567
  66. Knickelbein JE, Abbott AB, Chew EY. Fenofibrate and Diabetic Retinopathy. Curr Diab Rep 2016; 16:90
  67. Hu Y, Chen Y, Ding L, He X, Takahashi Y, Gao Y, Shen W, Cheng R, Chen Q, Qi X, Boulton ME, Ma JX. Pathogenic role of diabetes-induced PPAR-alpha down-regulation in microvascular dysfunction. Proc Natl Acad Sci U S A 2013; 110:15401-15406
  68. Nielsen SF, Nordestgaard BG. Statin use before diabetes diagnosis and risk of microvascular disease: a nationwide nested matched study. Lancet Diabetes Endocrinol 2014; 2:894-900
  69. Kang EY, Chen TH, Garg SJ, Sun CC, Kang JH, Wu WC, Hung MJ, Lai CC, Cherng WJ, Hwang YS. Association of Statin Therapy With Prevention of Vision-Threatening Diabetic Retinopathy. JAMA Ophthalmol 2019; 137:363-371
  70. Vail D, Callaway NF, Ludwig CA, Saroj N, Moshfeghi DM. Lipid-Lowering Medications Are Associated with Lower Risk of Retinopathy and Ophthalmic Interventions among United States Patients with Diabetes. Am J Ophthalmol 2019; 207:378-384
  71. Kawasaki R, Kitano S, Sato Y, Yamashita H, Nishimura R, Tajima N. Factors associated with non-proliferative diabetic retinopathy in patients with type 1 and type 2 diabetes: the Japan Diabetes Complication and its Prevention prospective study (JDCP study 4). Diabetol Int 2019; 10:3-11
  72. Sen K, Misra A, Kumar A, Pandey RM. Simvastatin retards progression of retinopathy in diabetic patients with hypercholesterolemia. Diabetes Res Clin Pract 2002; 56:1-11
  73. Gupta A, Gupta V, Thapar S, Bhansali A. Lipid-lowering drug atorvastatin as an adjunct in the management of diabetic macular edema. Am J Ophthalmol 2004; 137:675-682
  74. Group ASC, Bowman L, Mafham M, Wallendszus K, Stevens W, Buck G, Barton J, Murphy K, Aung T, Haynes R, Cox J, Murawska A, Young A, Lay M, Chen F, Sammons E, Waters E, Adler A, Bodansky J, Farmer A, McPherson R, Neil A, Simpson D, Peto R, Baigent C, Collins R, Parish S, Armitage J. Effects of n-3 Fatty Acid Supplements in Diabetes Mellitus. N Engl J Med 2018; 379:1540-1550
  75. Domanico D, Verboschi F, Altimari S, Zompatori L, Vingolo EM. Ocular Effects of Niacin: A Review of the Literature. Med Hypothesis Discov Innov Ophthalmol 2015; 4:64-71
  76. Buschur E, Stetson B, Barbour LA. Diabetes In Pregnancy. In: Feingold KR, Anawalt B, Boyce A, Chrousos G, de Herder WW, Dungan K, Grossman A, Hershman JM, Hofland HJ, Kaltsas G, Koch C, Kopp P, Korbonits M, McLachlan R, Morley JE, New M, Purnell J, Singer F, Stratakis CA, Trence DL, Wilson DP, eds. Endotext. South Dartmouth (MA)2018.
  77. Sun JK, Keenan HA, Cavallerano JD, Asztalos BF, Schaefer EJ, Sell DR, Strauch CM, Monnier VM, Doria A, Aiello LP, King GL. Protection from retinopathy and other complications in patients with type 1 diabetes of extreme duration: the joslin 50-year medalist study. Diabetes Care 2011; 34:968-974
  78. Lachin JM, Genuth S, Nathan DM, Zinman B, Rutledge BN, Dcct Edic Research Group. Effect of glycemic exposure on the risk of microvascular complications in the diabetes control and complications trial--revisited. Diabetes 2008; 57:995-1001
  79. Kuo JZ, Wong TY, Rotter JI. Challenges in elucidating the genetics of diabetic retinopathy. JAMA Ophthalmol 2014; 132:96-107
  80. Cho H, Sobrin L. Genetics of diabetic retinopathy. Curr Diab Rep 2014; 14:515
  81. Cole JB, Florez JC. Genetics of diabetes mellitus and diabetes complications. Nat Rev Nephrol 2020; 16:377-390
  82. Behl T, Kotwani A. Exploring the various aspects of the pathological role of vascular endothelial growth factor (VEGF) in diabetic retinopathy. Pharmacol Res 2015; 99:137-148
  83. Fong DS, Aiello L, Gardner TW, King GL, Blankenship G, Cavallerano JD, Ferris FL, 3rd, Klein R, American Diabetes Association. Retinopathy in diabetes. Diabetes Care 2004; 27 Suppl 1:S84-87
  84. Henricsson M, Nystrom L, Blohme G, Ostman J, Kullberg C, Svensson M, Scholin A, Arnqvist HJ, Bjork E, Bolinder J, Eriksson JW, Sundkvist G. The incidence of retinopathy 10 years after diagnosis in young adult people with diabetes: results from the nationwide population-based Diabetes Incidence Study in Sweden (DISS). Diabetes Care 2003; 26:349-354
  85. Early photocoagulation for diabetic retinopathy. ETDRS report number 9. Early Treatment Diabetic Retinopathy Study Research Group. Ophthalmology 1991; 98:766-785
  86. Photocoagulation for diabetic macular edema. Early Treatment Diabetic Retinopathy Study report number 1. Early Treatment Diabetic Retinopathy Study research group. Arch Ophthalmol 1985; 103:1796-1806
  87. Caldwell RB, Bartoli M, Behzadian MA, El-Remessy AE, Al-Shabrawey M, Platt DH, Liou GI, Caldwell RW. Vascular endothelial growth factor and diabetic retinopathy: role of oxidative stress. Curr Drug Targets 2005; 6:511-524
  88. Gao BB, Clermont A, Rook S, Fonda SJ, Srinivasan VJ, Wojtkowski M, Fujimoto JG, Avery RL, Arrigg PG, Bursell SE, Aiello LP, Feener EP. Extracellular carbonic anhydrase mediates hemorrhagic retinal and cerebral vascular permeability through prekallikrein activation. Nat Med 2007; 13:181-188
  89. Puliafito CA, Hee MR, Lin CP, Reichel E, Schuman JS, Duker JS, Izatt JA, Swanson EA, Fujimoto JG. Imaging of macular diseases with optical coherence tomography. Ophthalmology 1995; 102:217-229
  90. Kim BY, Smith SD, Kaiser PK. Optical coherence tomographic patterns of diabetic macular edema. Am J Ophthalmol 2006; 142:405-412
  91. Relhan N, Flynn HW, Jr. The Early Treatment Diabetic Retinopathy Study historical review and relevance to today's management of diabetic macular edema. Curr Opin Ophthalmol 2017; 28:205-212
  92. Neubauer AS, Ulbig MW. Laser treatment in diabetic retinopathy. Ophthalmologica 2007; 221:95-102
  93. Writing Committee for the Diabetic Retinopathy Clinical Research N, Fong DS, Strauber SF, Aiello LP, Beck RW, Callanan DG, Danis RP, Davis MD, Feman SS, Ferris F, Friedman SM, Garcia CA, Glassman AR, Han DP, Le D, Kollman C, Lauer AK, Recchia FM, Solomon SD. Comparison of the modified Early Treatment Diabetic Retinopathy Study and mild macular grid laser photocoagulation strategies for diabetic macular edema. Arch Ophthalmol 2007; 125:469-480
  94. Luttrull JK, Dorin G. Subthreshold diode micropulse laser photocoagulation (SDM) as invisible retinal phototherapy for diabetic macular edema: a review. Curr Diabetes Rev 2012; 8:274-284
  95. Aiello LP, Avery RL, Arrigg PG, Keyt BA, Jampel HD, Shah ST, Pasquale LR, Thieme H, Iwamoto MA, Park JE, et al. Vascular endothelial growth factor in ocular fluid of patients with diabetic retinopathy and other retinal disorders. N Engl J Med 1994; 331:1480-1487
  96. Simo R, Lecube A, Segura RM, Garcia Arumi J, Hernandez C. Free insulin growth factor-I and vascular endothelial growth factor in the vitreous fluid of patients with proliferative diabetic retinopathy. Am J Ophthalmol 2002; 134:376-382
  97. Preliminary report on effects of photocoagulation therapy. The Diabetic Retinopathy Study Research Group. Am J Ophthalmol 1976; 81:383-396
  98. Diabetic Retinopathy Clinical Research N, Brucker AJ, Qin H, Antoszyk AN, Beck RW, Bressler NM, Browning DJ, Elman MJ, Glassman AR, Gross JG, Kollman C, Wells JA, 3rd. Observational study of the development of diabetic macular edema following panretinal (scatter) photocoagulation given in 1 or 4 sittings. Arch Ophthalmol 2009; 127:132-140
  99. Writing Committee for the Diabetic Retinopathy Clinical Research Network, Gross JG, Glassman AR, Jampol LM, Inusah S, Aiello LP, Antoszyk AN, Baker CW, Berger BB, Bressler NM, Browning D, Elman MJ, Ferris FL, 3rd, Friedman SM, Marcus DM, Melia M, Stockdale CR, Sun JK, Beck RW. Panretinal Photocoagulation vs Intravitreous Ranibizumab for Proliferative Diabetic Retinopathy: A Randomized Clinical Trial. JAMA 2015; 314:2137-2146
  100. Cunningham MA, Edelman JL, Kaushal S. Intravitreal steroids for macular edema: the past, the present, and the future. Surv Ophthalmol 2008; 53:139-149
  101. Gillies MC, Sutter FK, Simpson JM, Larsson J, Ali H, Zhu M. Intravitreal triamcinolone for refractory diabetic macular edema: two-year results of a double-masked, placebo-controlled, randomized clinical trial. Ophthalmology 2006; 113:1533-1538
  102. Diabetic Retinopathy Clinical Research N, Beck RW, Edwards AR, Aiello LP, Bressler NM, Ferris F, Glassman AR, Hartnett E, Ip MS, Kim JE, Kollman C. Three-year follow-up of a randomized trial comparing focal/grid photocoagulation and intravitreal triamcinolone for diabetic macular edema. Arch Ophthalmol 2009; 127:245-251
  103. Diabetic Retinopathy Clinical Research Network, Chew E, Strauber S, Beck R, Aiello LP, Antoszyk A, Bressler N, Browning D, Danis R, Fan J, Flaxel C, Friedman S, Glassman A, Kollman C, Lazarus H. Randomized trial of peribulbar triamcinolone acetonide with and without focal photocoagulation for mild diabetic macular edema: a pilot study. Ophthalmology 2007; 114:1190-1196
  104. Pearson PA, Comstock TL, Ip M, Callanan D, Morse LS, Ashton P, Levy B, Mann ES, Eliott D. Fluocinolone acetonide intravitreal implant for diabetic macular edema: a 3-year multicenter, randomized, controlled clinical trial. Ophthalmology 2011; 118:1580-1587
  105. Schwartz SG, Flynn HW, Jr. Fluocinolone acetonide implantable device for diabetic retinopathy. Curr Pharm Biotechnol 2011; 12:347-351
  106. Haller JA, Kuppermann BD, Blumenkranz MS, Williams GA, Weinberg DV, Chou C, Whitcup SM. Randomized controlled trial of an intravitreous dexamethasone drug delivery system in patients with diabetic macular edema. Arch Ophthalmol 2010; 128:289-296
  107. Campochiaro PA, Brown DM, Pearson A, Ciulla T, Boyer D, Holz FG, Tolentino M, Gupta A, Duarte L, Madreperla S, Gonder J, Kapik B, Billman K, Kane FE, FAME Study Group . Long-term benefit of sustained-delivery fluocinolone acetonide vitreous inserts for diabetic macular edema. Ophthalmology 2011; 118:626-635 e622
  108. Campochiaro PA, Brown DM, Pearson A, Chen S, Boyer D, Ruiz-Moreno J, Garretson B, Gupta A, Hariprasad SM, Bailey C, Reichel E, Soubrane G, Kapik B, Billman K, Kane FE, Green K, FAME Study Group. Sustained delivery fluocinolone acetonide vitreous inserts provide benefit for at least 3 years in patients with diabetic macular edema. Ophthalmology 2012; 119:2125-2132
  109. Nguyen QD, Tatlipinar S, Shah SM, Haller JA, Quinlan E, Sung J, Zimmer-Galler I, Do DV, Campochiaro PA. Vascular endothelial growth factor is a critical stimulus for diabetic macular edema. Am J Ophthalmol 2006; 142:961-969
  110. Cunningham ET, Jr., Adamis AP, Altaweel M, Aiello LP, Bressler NM, D'Amico DJ, Goldbaum M, Guyer DR, Katz B, Patel M, Schwartz SD, Macugen Diabetic Retinopathy Study G. A phase II randomized double-masked trial of pegaptanib, an anti-vascular endothelial growth factor aptamer, for diabetic macular edema. Ophthalmology 2005; 112:1747-1757
  111. Sultan MB, Zhou D, Loftus J, Dombi T, Ice KS, Macugen Study Group. A phase 2/3, multicenter, randomized, double-masked, 2-year trial of pegaptanib sodium for the treatment of diabetic macular edema. Ophthalmology 2011; 118:1107-1118
  112. Diabetic Retinopathy Clinical Research Network, Scott IU, Edwards AR, Beck RW, Bressler NM, Chan CK, Elman MJ, Friedman SM, Greven CM, Maturi RK, Pieramici DJ, Shami M, Singerman LJ, Stockdale CR. A phase II randomized clinical trial of intravitreal bevacizumab for diabetic macular edema. Ophthalmology 2007; 114:1860-1867
  113. Rajendram R, Fraser-Bell S, Kaines A, Michaelides M, Hamilton RD, Esposti SD, Peto T, Egan C, Bunce C, Leslie RD, Hykin PG. A 2-year prospective randomized controlled trial of intravitreal bevacizumab or laser therapy (BOLT) in the management of diabetic macular edema: 24-month data: report 3. Arch Ophthalmol 2012; 130:972-979
  114. Nguyen QD, Shah SM, Khwaja AA, Channa R, Hatef E, Do DV, Boyer D, Heier JS, Abraham P, Thach AB, Lit ES, Foster BS, Kruger E, Dugel P, Chang T, Das A, Ciulla TA, Pollack JS, Lim JI, Eliott D, Campochiaro PA, READ Study Group. Two-year outcomes of the ranibizumab for edema of the mAcula in diabetes (READ-2) study. Ophthalmology 2010; 117:2146-2151
  115. Mitchell P, Bandello F, Schmidt-Erfurth U, Lang GE, Massin P, Schlingemann RO, Sutter F, Simader C, Burian G, Gerstner O, Weichselberger A, RESTORE Study Group. The RESTORE study: ranibizumab monotherapy or combined with laser versus laser monotherapy for diabetic macular edema. Ophthalmology 2011; 118:615-625
  116. Elman MJ, Bressler NM, Qin H, Beck RW, Ferris FL, 3rd, Friedman SM, Glassman AR, Scott IU, Stockdale CR, Sun JK, Diabetic Retinopathy Clinical Research Network. Expanded 2-year follow-up of ranibizumab plus prompt or deferred laser or triamcinolone plus prompt laser for diabetic macular edema. Ophthalmology 2011; 118:609-614
  117. Massin P, Bandello F, Garweg JG, Hansen LL, Harding SP, Larsen M, Mitchell P, Sharp D, Wolf-Schnurrbusch UE, Gekkieva M, Weichselberger A, Wolf S. Safety and efficacy of ranibizumab in diabetic macular edema (RESOLVE Study): a 12-month, randomized, controlled, double-masked, multicenter phase II study. Diabetes Care 2010; 33:2399-2405
  118. Nguyen QD, Brown DM, Marcus DM, Boyer DS, Patel S, Feiner L, Gibson A, Sy J, Rundle AC, Hopkins JJ, Rubio RG, Ehrlich JS, Rise, RIDE and RISE Group. Ranibizumab for diabetic macular edema: results from 2 phase III randomized trials: RISE and RIDE. Ophthalmology 2012; 119:789-801
  119. Do DV, Nguyen QD, Boyer D, Schmidt-Erfurth U, Brown DM, Vitti R, Berliner AJ, Gao B, Zeitz O, Ruckert R, Schmelter T, Sandbrink R, Heier JS, da Vinci Study Group. One-year outcomes of the da Vinci Study of VEGF Trap-Eye in eyes with diabetic macular edema. Ophthalmology 2012; 119:1658-1665
  120. Wells JA, Glassman AR, Ayala AR, Jampol LM, Bressler NM, Bressler SB, Brucker AJ, Ferris FL, Hampton GR, Jhaveri C, Melia M, Beck RW, Diabetic Retinopathy Clinical Research Network. Aflibercept, Bevacizumab, or Ranibizumab for Diabetic Macular Edema: Two-Year Results from a Comparative Effectiveness Randomized Clinical Trial. Ophthalmology 2016; 123:1351-1359
  121. Diabetic Retinopathy Clinical Research Network Writing Committee, Haller JA, Qin H, Apte RS, Beck RR, Bressler NM, Browning DJ, Danis RP, Glassman AR, Googe JM, Kollman C, Lauer AK, Peters MA, Stockman ME. Vitrectomy outcomes in eyes with diabetic macular edema and vitreomacular traction. Ophthalmology 2010; 117:1087-1093 e1083
  122. Gandorfer A. Enzymatic vitreous disruption. Eye (Lond) 2008; 22:1273-1277
  123. Javey G, Schwartz SG, Flynn HW, Jr. Emerging pharmacotherapies for diabetic macular edema. Exp Diabetes Res 2012; 2012:548732


Management of Diabetes and Hyperglycemia in Hospitalized Patients

ABSTRACT

Diabetes is the most prevalent metabolic disorder and it is estimated to affect more than 460 million people globally. In the United States, 34.2 million Americans, or 10.5% of the population, have diabetes. Patients with diabetes have a 3-fold greater chance of hospitalization compared to those without diabetes. In 2016 in the U.S., there were over 7.8 million hospital stays for patients with diabetes. Hyperglycemia, defined as a blood glucose greater than 140 mg/dl (7.8 mmol/l), is reported in 22-46% of non- critically ill hospitalized patients. Extensive data indicates that inpatient hyperglycemia, in patients with or without prior diagnosis of diabetes, is associated with an increased risk of complications and mortality. Recently the American Diabetes Association recommended a target glucose between 140 mg/dl (7.8 mmol/l) and 180 mg/dl (10.0 mmol/l) for critically ill patients in the ICU as well as for most patients admitted to general medicine and surgery in the non-ICU setting. Insulin remains the best way to control hyperglycemia in the inpatient setting especially in the critically ill patient. Intravenously administered insulin is the preferred method to achieve the recommended glycemic target in the ICU. The use of oral antidiabetic agents was not recommended in previous guidelines because the lack of safety and efficacy studies in the inpatient setting. However, increasing evidence indicates that treatment with oral agents such as DPP4 inhibitors, alone or in combination with basal insulin, is safe and effective in general medicine and surgery patients with mild to moderate hyperglycemia.

INTRODUCTION

Diabetes is a prevalent metabolic disorder that affects more than 460 million people globally, and is projected to rise to 700 million (10.9% of the adult population) by 2045 (1). In the United States, data from the National Diabetes Statistics Report in 2020 estimated that a total of 34.2 million Americans, or 10.5% of the population, had diabetes (2). The percentage of the population with diagnosed diabetes is expected to rise, with one study projecting that as many as one in three U.S. adults will have diabetes by 2050 (3). People with diabetes have a 35% greater chance of referral for elective operations and an up to 4-fold greater chance of hospitalization compared to those without diabetes (4-7). Data from the US and Scotland estimate that of those individuals with a discharge diagnosis of diabetes, 30% will require 2 or more hospitalizations in any given year (5,6,8). In 2016 in the U.S., there were over 7.8 million hospital stays for people with diabetes (i.e., diabetes as either a principal diagnosis for hospitalization or as a secondary diagnosis, coexisting condition) (2), and in the UK the annual National Diabetes Inpatient Audit suggested that the prevalence of diabetes amongst inpatients had risen from 15% in 2010 to almost 20% in 2019 (9). In addition, those hospitalized with a diagnosis of diabetes stay in the hospital for longer than those without a diagnosis of diabetes admitted for the same condition (10,11).

Diabetes was the 7th leading cause of death in the United States in 2017, with 83,564 death certificates listing diabetes as the underlying cause of death, accounting for 25.7 deaths per 100,000 of the population (12). The care of people with diabetes imposes a substantial burden on the economy, with a total estimated cost of treating people diagnosed with diabetes in the United States in 2017 was $414 billion – or 24% or all health care spending in the US (11). This included $237 billion in direct medical costs. It is estimated that a further cost of $690 billion is incurred due to reduced productivity (11). Globally, diabetes care costs have been estimated at $1.3 trillion, rising to an estimated $2.1-2.5 trillion by 2030 (13,14). This represents a rise in spending on diabetes as a proportion of  global gross domestic product from 1.8% in 2015 to 2.2% in 2030 (14). Other than the costs of diabetes medications, the largest component of this medical expenditure is hospital inpatient care, accounting for $69.7 billion of the total medical cost (11).

Hyperglycemia is defined as a blood glucose concentration of greater than 140 mg/dl (7.8 mmol/l) (15,16). It is reported in 22% to 46% of non-critically ill hospitalized patients (8,15). Extensive observational and trial data indicate that inpatient hyperglycemia, in patients with or without a prior diagnosis of diabetes, is associated with an increased risk of complications and mortality, a longer hospital stay, a higher admission rate to the intensive care unit (ICU), and a higher need for transitional or nursing home care after hospital discharge (8,17,18).

Several studies and meta-analyses have shown that attempting ‘tight’ glycemic control using intensive insulin therapy is associated with increased risk of hypoglycemia (19-23). This has been associated with increased morbidity and mortality in hospitalized patients (15,24-28). Thus, while insulin therapy is recommended for the management of hyperglycemia in hospitalized patients, the concern about hypoglycemia have led to revised glucose target recommendations from leading professional organizations around the world (16,22,29-32).

This chapter reviews the pathophysiology of hyperglycemia during illness, the mechanisms for increased complications and mortality due to hyperglycemia and hypoglycemia, and reviews the evidence supporting different therapies and approaches for the management of inpatient diabetes and hyperglycemia in the critical care and in the general medicine and surgical settings.

PREVALENCE OF DIABETES AND HYPERGLYCEMIA IN THE HOSPITALIZED PATIENT

Observational studies have reported a prevalence of hyperglycemia and diabetes ranging from 38% to 40% in hospitalized patients (8), and in 70-80% of those with diabetes who have a critical illnesses or cardiac surgery (33-35). A 2017 report using point-of-care bedside glucose tests data in almost 3.5 million people (653,359 ICU and 2,831,436 non-ICU) from 575 hospitals in the United States reported a prevalence of hyperglycemia, (defined as a glucose level >180 mg/dl [10.0 mmol/l]) of 32.2% in ICU patients and in 32.0% of non-ICU patients (33). These numbers included those with newly identified or stress hyperglycemia as well as those with a prior diagnosis of diabetes. The American Diabetes Association (ADA) and American Association of Clinical Endocrinologists (AACE) consensus on inpatient hyperglycemia defined stress hyperglycemia or hospital-related hyperglycemia as any blood glucose concentration >140 mg/dl (>7.8 mmol/l) in patients without a prior history of diabetes (15,16). Although stress hyperglycemia typically resolves as the acute illness or surgical stress abates, a significant proportion (up to 60% in some reports) had confirmed diabetes at 6-12 months after discharge (36,37). A guide from the UK on the management of ‘diabetes at the front door’, also recommends that any individual with diabetes who presents acutely unwell should have a capillary glucose measurement and blood/urine ketone measurement taken, but that if it is high on admission (i.e. >140mg/dl [7.8 mmol/l]) and subsequently goes down to normal, then a diagnosis of stress hyperglycemia should be made and documented to the primary care team (38).

Measurement of HbA1c is indicated in people with hyperglycemia without a history of diabetes to differentiate between stress induced hyperglycemia and previously undiagnosed diabetes (38-41). The Endocrine Society and the UK Joint British Diabetes Societies for Inpatient Care recommendations indicate that people hospitalized with both an elevated blood glucose >140 mg/dl (7.8 mmol/l) and an HbA1c of 6.5% (48 mmol/mol) or higher can be identified as having diabetes (15,38).

PATHOPHYSIOLOGY OF HYPERGLYCEMIA DURING ILLNESS

In subjects without diabetes during the fasted state, plasma glucose is maintained between 70 – 100 mg/dl (3.9 – 5.6 mmol/l) by a finely regulated balance between hepatic glucose production and glucose utilization in peripheral tissues. Maintenance of normal glucose concentration is essential for cardiovascular functioning as well as central nervous system function because the brain can neither synthesize nor store glucose (42,43).


Systemic glucose balance is maintained by a dynamic, minute-to-minute regulation of endogenous glucose production and of glucose utilization by peripheral tissues (44). Glucose production is accomplished by gluconeogenesis or glycogenolysis primarily in the liver and to a lesser degree by the kidneys (45). Gluconeogenesis results from conversion of non-carbohydrate precursors such as lactate, alanine, and glycerol to glucose in the liver (46). Excess glucose is polymerized to glycogen, which is mainly stored in the liver and muscle. Hyperglycemia develops because of three processes: 1) increased gluconeogenesis, 2)   accelerated glycogenolysis, and 3) impaired glucose utilization by peripheral tissues (Figure 1).

Figure 1. Pathogenesis of hyperglycemia. Hyperglycemia results from increased hepatic glucose production and impaired glucose utilization in peripheral tissues. Reduced insulin and excess counter-regulatory hormones (glucagon, cortisol, catecholamines and growth hormone) increase lipolysis and protein breakdown (proteolysis), and impair glucose utilization by peripheral tissues. Hyperglycemia causes osmotic diuresis that leads to hypovolemia, decreased glomerular filtration rate, and worsening hyperglycemia. At the cellular level, increased blood glucose levels result in mitochondrial injury by generating reactive oxygen species, and endothelial dysfunction by inhibiting nitric oxide production. Hyperglycemia increases levels of pro-inflammatory cytokines such as TNF-α and IL-6 leading to immune system dysfunction. These changes can eventually lead to increased risk of infection, impaired wound healing, multiple organ failure, prolonged hospital stay and death. Adapted from ref (20).

 From the quantitative standpoint, inappropriately increased hepatic glucose production represents the major pathogenic disturbance. Increased hepatic glucose production results from the high availability of gluconeogenic precursors including the amino acids alanine and glutamine, as a result of accelerated proteolysis and decreased protein synthesis; lactate as a result of increased muscle glycogenolysis; and glycerol as a result of increased lipolysis; and from the increased activity of gluconeogenic enzymes (phosphoenol pyruvate carboxykinase, fructose-1,6-bisphosphatase, and pyruvate carboxylase) (45,46).

Glucose metabolism is maintained by an interaction of glucoregulatory hormones – insulin and counter-regulatory hormones (glucagon, cortisol, catecholamines and growth hormone). Insulin controls hepatic glucose production by suppressing hepatic gluconeogenesis and glycogenolysis. Depending on the concentration in the circulation, insulin promotes protein anabolism in insulin-sensitive tissues such as muscle, glucose uptake and glycogen synthesis, and inhibits glycogenolysis and protein breakdown (44,47,48). In addition, insulin is a powerful inhibitor of lipolysis, free fatty acid oxidation, and ketogenesis (47,48).

Counter-regulatory hormones (glucagon, cortisol, catecholamines and growth hormone) also play an important role in the regulation of glucose production and utilization. Glucagon is the most important glycogenolytic hormone, therefore, regulates hepatic glucose production during normal state and in every state of hyperglycemia (45). During stress, excess concentration of counter-regulatory hormones results in altered carbohydrate metabolism by inducing insulin resistance, increasing hepatic glucose production, and reducing peripheral glucose utilization. In addition, high epinephrine levels stimulate glucagon secretion and inhibits insulin release by pancreatic β-cells (49,50).

The development of hyperglycemia results in an inflammatory state characterized by an elevation of pro-inflammatory cytokines and increased oxidative stress markers (51-53). Circulating levels of tumor necrosis factor-α (TNF-α), interleukin [IL]-6, IL1-ß, IL-8, and C-reactive protein are significantly increased two- to fourfold on admission in people with severe hyperglycemia compared with control subjects, and levels returned to normal levels after insulin treatment and resolution of hyperglycemic crises (51). Raised concentrations of TNF-α lead to insulin resistance at the level of the insulin receptor and through altered regulation of the insulin-signaling pathway. Increasing evidence indicates that during acute stressful states, increased concentrations of these inflammatory cytokines can increase insulin resistance by interfering with insulin signaling (52,54). In addition, by preventing insulin-mediated activation of phosphatidylinositol 3- kinase TNF-α reduces insulin- stimulated glucose uptake in peripheral tissues (52,54,55).

CONSEQUENCES OF HYPERGLYCEMIA IN THE HOSPITALIZED PATIENTS

A large body of literature including observational and prospective randomized clinical trials, in people with and without diabetes, as well those who are critically or non-critically ill has shown a strong association between hyperglycemia and poor clinical outcomes, such as mortality, infections and hospital complications (5,56-64). This association correlates with severity of hyperglycemia on admission as well as during the hospital stay (62,65,66). Of interest, increasing evidence indicates an increased risk of complications and mortality in patients without a history of diabetes (stress induced) compared to patients with known diagnosis of diabetes (8,59,65,67,68). It is not clear if stress hyperglycemia is the direct cause of poor outcomes or it is a general marker of severity of illness.


The mechanisms implicated on the detrimental effects of hyperglycemia during acute illnesses are not completely understood. Current evidence indicates that severe hyperglycemia results in impaired neutrophil granulocyte function, high circulating free fatty acids, and overproduction of pro-inflammatory cytokines and reactive oxygen species (ROS) that can result in direct cellular damage, and vascular and immune dysfunction (69).

The majority of evidence linking hyperglycemia and poor outcomes comes from studies in the ICU. Falciglia et al in a retrospective study of over 250,000 veterans admitted to various ICUs reported that hyperglycemia is an independent risk factor for mortality and complications (65). In a nonrandomized, prospective study, Furnary followed 3,554 patients with diabetes that underwent coronary artery bypass graft. Patients treated with subcutaneous insulin (SCI) who had an average blood glucose of 214 mg/dl (11.9 mmol/l) and patients treated with continuous insulin infusion (CII) with an average blood glucose of 177 mg/dl (9.8 mmol/l) had significantly more deep sternal wound infections (63) and a 50% higher risk-adjusted mortality (70). In a different ICU study, patients with blood glucose levels >200 mg/dl (>11.1 mmol/l) were shown to have higher mortality compared to those with blood glucose levels <200 mg/dl (<11.1 mmol/) (5.0% vs. 1.8%, p < 0.001) (62). Importantly however, once again it has been shown that it was those people who were not previously known to have diabetes who developed hyperglycemia in the ICU who fared worst (71). This was confirmed by another ICU study with almost 350,000 people, looking at the outcomes in those with sepsis (72). These authors showed that having hyperglycemia was associated with increased stay in hospital and ICU, and greater 90-day mortality (72). However, there was no difference in outcomes for those with diabetes, unless they had experienced severe hypoglycemia, in which case mortality rose (OR 2.95 95%CI 1.19-7.32) (72). Thus, despite a large amount of work having been done, the optimal blood glucose concentration for people on ICU has yet to be determined (73).


The association of hyperglycemia and poor outcomes also applies to those not in the ICU, but admitted to general medicine and surgery services. In such individuals, hyperglycemia is associated with poor hospital outcomes including prolonged hospital stay, infections, disability after hospital discharge, and death (5,8,56,57,66,74). In a retrospective study of 1,886 patients admitted to a community hospital, mortality in the general floors was significantly higher in patients with newly (stress) diagnosed hyperglycemia and with known diabetes compared to subjects with normal glucose values (10% vs. 1.7% vs. 0.8%, respectively; p < 0.01) (8). In a prospective cohort multicenter study of 2,471 patients with community-acquired pneumonia, those with an admission glucose levels >198 mg/dl (>11.0 mmol/l) had a greater risk of mortality and complications than those with glucose levels <198 mg/dl (<11.0 mmol/l) (68). The risk of complications increased 3% for each 18 mg/dl (1.0 mmol/l) increase in admission glucose (68). In a retrospective study of 348 patients with chronic obstructive pulmonary disease and respiratory tract infection, the relative risk of death was 2.1 in those with a blood glucose of 126-160 mg/dl (7.0-8.9 mmol/l), and 3.4 for those with a blood glucose of >162 mg/dl (9.0 mmol/l) compared to patients with a blood glucose of 108 mg/dl (6.0 mmol/l) (74).

General surgery patients with hyperglycemia during the perioperative period are also at increased risk for adverse outcomes. A systematic review of diabetes and the risk of surgical site infection across a variety of surgical specialties showed that high peri-operative glucose levels were associated with an increased risk of infection (75). In a case-control study, elevated preoperative glucose levels increased the risk of postoperative mortality in patients undergoing elective non-cardiac non-vascular surgery (76). Patients with glucose levels of 110-200 mg/dl (5.6-11.1 mmol/l) and those with glucose levels of >200 mg/dl (>11.1 mmol/l) had, respectively, 1.7-fold and 2.1-fold increased mortality compared to those with glucose levels <5.6 mmol/l (<110 mg/dl) (76). In another study, patients with glucose levels >220 mg/dl (>12.2 mmol/l) on the first postoperative day had a rate of infection 2.7 times higher than those who had serum glucose levels <220 mg/dl (<12.2 mmol/l) (77). A more recent study showed an increase of postoperative infection rate by 30% for every 40mg/dl (2.2 mmol/l) rise in postoperative glucose level above 110 mg/dl (6.1 mmol/l) (78) [67]. Furthermore, a study looking at perioperative glycemic control and the effect on surgical site infections in diabetic patients undergoing foot and ankle surgery showed that 11.9% of those with a serum glucose ≥200 mg/dl (11.1 mmol/l) during the admission developed a surgical site infection versus only 5.2% of those with a serum glucose <200 mg/dl (11.1 mmol/l) (odds ratio = 2.45; 95% CI 1.09-5.52, P = 0.03) (79). Lastly, a prospective randomized study looking at the impact of glycemic control at 1-year post liver transplant showed that in those randomized to a glycemic control of blood glucose below 140 mg/dl (7.8 mmol/l) any infection within 1 year occurred in 35 of the 82 patients (42.7%) versus 54 of 82 (65.9%) in those randomized to a glycemic control of 180 mg/dl (10.0 mmol/l) (P = 0.0046) (80). There is now emerging evidence to suggest that early intervention and the use of technology allowing pro-active identification of people at risk, helps to reduce hospital acquired infection rates, episodes of hyper- and hypoglycemia, as well as, in some cases, reduced length of stay (81-84). A meta-analysis also shows that improving peri-operative glycemic control reduced postoperative infection rates (85).

GLYCEMIC TARGETS IN THE ICU AND NON-ICU SETTINGS

The American Diabetes Association (ADA) and American Association of Clinical Endocrinologist (AACE) task force on inpatient glycemic control and other groups  recommended different glycemic targets in the ICU setting (16) (Table 1). These guidelines suggest targeting a glucose level between 140 and 180 mg/dl (7.8 and 10.0 mmol/l) for the majority of ICU patients and lower glucose targets between 110 and 140 mg/dl (6.1 and 7.8 mmol/l) in selected ICU patients (i.e., centers with extensive experience and appropriate nursing support, cardiac surgical patients, patients with stable glycemic control without hypoglycemia). Glucose targets >180 mg/dl (>10.0 mmol/l) or <110 mg/dl (<6.1 mmol/l) are not recommended in ICU patients. There is an argument to say that lowering glucose thresholds for those in hospital is likely to be associated with harm (27,86) and an equally persuasive argument to suggest that the implementation of the thresholds as advocated by national and organizational guidelines have led to safer care (87).

The most recent guidelines from the Society of Critical Care Medicine (SCCM) for the management of hyperglycemia in critically ill (ICU) patients recommended that a blood glucose ≥150 mg/dl (≥8.3 mmol/l) should trigger interventions to maintain blood glucose below that level and absolutely <180 mg/dl (<10.0 mmol/l) (30). They also suggest that the insulin regimen and monitoring system be designed to avoid and detect hypoglycemia (blood glucose <70 mg/dl [<3.9 mmol/l]) and to minimize glycemic variability (30). The technology to allow this to occur is being development and may enter routine clinical use relatively soon (88-92).

Table 1. Major Guidelines for Treatment of Hyperglycemia in a Hospital Setting


ICU

Non-ICU

ADA/AACE (16)

Initiate insulin therapy for persistent hyperglycemia (glucose >180 mg/dl [>10 mmol/l]).

Treatment goal: For most people, target a glucose level between 140 – 180 mg/dl (7.8 – 10.0 mmol/l].

More stringent goals (110 – 140 mg/dl [6.1 – 7.8 mmol/l]) may be appropriate for selected individuals, if achievable without significant risk for hypoglycemia.

No specific guidelines.

If treated with insulin, pre-meal glucose targets should generally be <140 mg/dl (<7.8 mmol/l), with random glucose levels <180 mg/dl (<10.0 mmol/l).

More stringent targets may be appropriate for those with previously tight glycemic control. Less stringent targets may be appropriate in people with severe comorbidities.


ACP (22)

Recommends against intensive insulin therapy in those with or without diabetes in surgical / medical ICUs

Treatment goal: target glucose between 140 – 200 mg/dl (7.8 – 11.0 mmol/l), in people with or without diabetes, in surgical / medical ICUs


Critical Care Society (30)

Glucose >150 mg/dl (>8.3 mmol/l) should trigger insulin therapy

Treatment goal: maintain glucose <150 mg/dl (<8.3 mmol/l) for most adults in ICU.

Maintain glucose levels <180 mg/dl (10.0 mmol/l) while avoiding hypoglycemia.


Endocrine Society (15)


Pre-meal glucose target <140 mg/dl (<7.8mmol/l) and random blood glucose <180 mg/dl (<10.0 mmol/l). A lower target range may be appropriate in people able to achieve and maintain glycemic control without hypoglycemia. A glucose of <180 – 200 mg/dl (<10.0 – 11.0 mmol/l) is appropriate in those with terminal illness and/or with limited life expectancy or at high risk for hypoglycemia.

Adjust antidiabetic therapy when glucose falls <100 mg/dl (<5.6 mmol/l) to avoid hypoglycemia.

Society of Thoracic Surgeons (93) (Guidelines specific to adult cardiac surgery)

Continuous insulin infusion preferred over SC or intermittent intravenous boluses.

Treatment goal: Recommend glucose <180 mg/dl (<10.0 mmol/l) during surgery (≤110 mg/dl [≤6.1 mmol/l] in fasting and pre-meal states)


Joint British Diabetes Society for Inpatient Care (94)


Target blood glucose levels in most people of between 108 – 180 mg/dl (6.0 – 10 mmol/l) with an acceptable range of between 72 – 216 mg/dl (4.0 – 12.0 mmol/l).

AACE/ADA, American Association of Endocrinologists and American Diabetes Association joint guidelines; ACP, American College of Physicians; ADA, American Diabetes Association; ICU, intensive care unit;

In the non-ICU setting, the Endocrine Society and the ADA/AACE Practice Guidelines recommended a pre-meal glucose of <140 mg/dl (<7.8 mmol/l) and a random glucose of <180 mg/dl (<10.0 mmol/l) for the majority of non-critically ill patients treated with insulin (15,16,29). More recently the American Diabetes Association has recommended that target glucose for most general medicine and surgery patients in non-ICU settings should be between 140 – 180 mg/dl (7.8 – 10.0 mmol/l) (31). To avoid hypoglycemia <70 mg/dl (<3.9 mmol/l), the total basal and prandial insulin dose should be reduced if glucose levels fall between 70 – 100 mg/dl (3.9 – 5.6 mmol/l). In contrast, higher glucose ranges (>200 mg/dl [>11.1 mmol/l]) may be acceptable in terminally ill patients or in patients with severe comorbidities as a way of avoiding symptomatic hyperglycemia (15,95).

Guidelines from the Joint British Diabetes Society's Inpatient Care Group in the UK published over the last few years, aim for target blood glucose levels in most people between 108 – 180 mg/dl (6.0 – 10.0 mmol/l) with an acceptable range of between 72 – 216 mg/dl (4.0 – 12.0 mmol/l) (94). Table 1 summarizes the currently available guidelines for the management of hyperglycemia in the hospital setting.

EVIDENCE FOR CONTROLLING HYPERGLYCEMIA IN ICU AND NON – ICU SETTINGS

The Leuven surgical ICU study set the stage for promoting intensive glycemic control in the critical care setting (96). This study randomized 1,548 people admitted to the surgical ICU (63% cardiac cases, 13% with diabetes, most patients received early parenteral nutrition). Individuals were randomized to either conventional therapy with a target glucose between 180 – 200 mg/dl (10.0 – 11.1 mmol/l) or intensive therapy to a target glucose between 80 – 110 mg/dl (4.4 – 6.1 mmol/l). Those in the conventional arm had a mean daily glucose average of 153 mg/dl (8.5 mmol/l) and those in the intensive arm had an average glucose of 103 mg/dl (5.7 mmol/l). Those in the intensive group had significantly less bacteremia, less antibiotic requirements, lower length of ventilator dependency, lower number of ICU days, and an overall 34% reduction in mortality (96). Following a similar study design, the same group of investigators randomized people in a medical ICU (18% with diabetes) and reported that intensive insulin therapy (mean daily glucose of 111 mg/dl [6.2 mmol/l]) resulted in less ICU and total hospital complications in those with 3 days of insulin treatment (97).

A large number of well-designed randomized controlled trials and meta-analyses however, have shown that such low glucose targets are difficult to achieve, even in environments with high staff to patient ratios without increasing the risk for severe hypoglycemia (19,98-100). In addition, these and other studies failed to show improvement in clinical outcomes and have even shown increased mortality risk with intensive glycemic control (Table 2) (26,98-102). The Glucontrol trial, a seven-country multicenter trial, randomized people in medical and surgical ICUs to tight glycemic control (80 – 110 mg/dl [4.4 – 6.1 mmol/l]) versus conventional glycemic control (140 – 180 mg/dl [7.8 – 10.0 mmol/l]). The study did not find a difference in mortality between the two groups (103). The Efficacy of Volume Substitution and Insulin Therapy in Sepsis (VISEP) study was another trial that attempted to reproduce the data from the Leuven trial (98). The study was a multicenter study in Germany that randomized people with sepsis to receive intensive insulin therapy to maintain glucose levels between 180 – 200 mg/dl (10.0 – 11.1 mmol/l) versus the intensive arm of 80 – 110 mg/dl (4.4 – 6.1 mmol/l) (98). The investigators evaluated differences between the groups in 28- and 90-day mortality, sepsis-related organ failure, ICU stay and frequency of hypoglycemia (glucose < 40mg/dl [<2.2 mmol/l]). The trial was stopped prematurely after reaching only ~2/3 of the projected enrollment due to an interim analysis that showed no difference in 28- or 90-day mortality between patients treated in the conventional arm versus those in the intensive arm (21.6% vs. 21.9%; 29.5 vs. 32.8%, respectively), but those in the intensive arm experienced a significantly greater amount of severe hypoglycemia (12.1 vs. 2.1%) (98).

The Normoglycemia in Intensive Care Evaluation and Surviving Using Glucose Algorithm Regulation (NICE-SUGAR) trial randomized over 6104 subjects to receive either conventional glycemic control to a target glucose <180 mg/dl [<10.0 mmol/l]) or intensive glycemic control (target 81 – 108 mg/dl [4.5 – 6.0 mmol/l]) reported no difference in hospital mortality, but found increased mortality at 90 days of follow-up (24.9% vs. 27.5%, p=0.02) (19). In a subsequent analysis of the trial, the NICE SUGAR investigators reported a higher frequency of hypoglycemia in the intensive arm (6.8% vs. 0.5%) and those with hypoglycemia had ~2-fold increase in mortality compared to patients without hypoglycemia (24).


Table 2. Clinical Trials of Intensive Glycemic Control in ICU Populations

Study Setting Population Percentage with diabetes Clinical Outcome
Malmberg, 1994 (104) CCU People with diabetes with suspected or confirmed acute MI 100 28% decrease mortality after 1 year
Furnary, 1999 (63)* CCU People with diabetes undergoing CABG 100 65% decrease in deep sternal wound infection rate
Van den Berghe, 2001 (96) Surgical ICU Mixed, with CABG 13 34% decrease in mortality
Furnary, 2003 (70)* CCU People with diabetes undergoing CABG 100 50% decrease in adjusted mortality rate
Krinsley, 2003 (62)* Medical and surgical ICU Mixed 22.4 27% decrease in mortality
Lazar, 2004 (105) Operating room and ICU People with diabetes undergoing CABG 100 60% decrease of post - operative atrial fibrillation
Van den Berghe, 2006 (97) Medical ICU Mixed 17 18% decrease mortality
Gandhi, 2007 (106) Operating Room Mixed, undergoing cardiac surgery 19.6 No difference in mortality; increase in stroke rate in the intensive treatment arm
VISEP, 2008 (98) Medical ICU Mixed, admitted with sepsis 30 No differences in 28-day or 90-day mortality, end-organ failure, length of stay
De La Rosa, 2008 (99) Medical and surgical ICU Mixed 12 No differences in 28-day mortality or infection rate
Glucontrol, 2009 (103) Medical and surgical ICU Mixed 18 No difference in 28-day mortality
NICE-SUGAR, 2009/2012 (19,24) Medical and surgical ICU Mixed 20 No difference in 90-day mortality
Boston Children’s (SPECS), 2012 (107,108) Cardiac ICU Cardiac surgery, people without diabetes 0 No differences in 30-day mortality, length of stay, in the cardiac ICU, length of hospital, duration of mechanical ventilation and vasoactive support, or measures of organ failure
ChiP, 2014 (109) [148] Pediatric ICU Critical illness/injury/major surgery, those without diabetes. 0 No difference in 30-day mortality. Increased hypoglycemia in the intensive treated group
CGAO–REA, 2014 (110,111) Medical ICU Mixed 23 No difference in 90-day mortality. Increased hypoglycemia in the intensive treated group
Okabayashi, 2014 (112)  Surgical ICU Mixed 25.3 Decreased surgical site infection in the intensive treated group

MI, myocardial infarction, ICU – Intensive Care Unit, CABG – Coronary artery bypass graft

*These are observational studies (reference 62, 63, 70) and all the other studies were randomized studies. Mixed – study enrolled those with and without diabetes

The GLUCO-CABG trial was a randomized open-label clinical study that included those with and without diabetes undergoing CABG who experienced perioperative hyperglycemia, defined as a glucose >140 mg/dl (>7.8 mmol/l) (60). A total of 302 people between 18 and 80 years of age were randomized to the intensive glycemic control group (target glucose 100 – 140 mg/dl [5.6 – 7.8 mmol/l]) or to conservative – or conventional – control (glucose 141 – 180 mg/dl [7.9 – 10.0 mmol/l]) in the ICU. After transition from ICU to the telemetry floor, patients were managed with a single treatment protocol aimed to maintain a glucose target <140 mg/dl (<7.8 mmol/l) before meals during the hospital stay. The primary outcome included differences between intensive and conservative glucose control on a composite of perioperative complications including sternal wound infection, bacteremia, respiratory failure, pneumonia, acute kidney injury, and major adverse cardiovascular events including acute coronary syndrome, stroke, heart failure and cardiac arrhythmias (60). The mean glucose during the ICU stay was 132±47 mg/dl (7.3±2.6 mmol/l) in the intensive and 152±17 mg/dl (8.4±1.0 mmol/l) in the conservative group. Intensive glucose treatment resulted in a 20% reduction in perioperative complications compared to the conservative group (42% vs. 52%; p=0.08). Of interest, there were no differences in the rate of complications among patients with diabetes treated with intensive or conservative regimens (49.3% vs. 45.8%, p=0.68); however, in patients without diabetes intensive treatment was associated with significantly lower rate of complications compared to the conservative group (35% vs. 58%, p=0.006) (60). Hospitalization costs were lower in the intensive group (median [IQR] $36,681 [28,488 – 46,074] vs. $40,913 [31,464 – 56,629], p=0.04), with an average total cost savings of $3,654 per case compared to conservative glucose control (113).

To date, no large studies have been conducted to determine if improved control in those not in an ICU may result in reduced morbidity and mortality in general medical and surgical patients.  For most people in the hospital with diabetes while there are observational data to show that dysglycemia is harmful, there were little data to show that improving glycemic control helps (114). A randomized controlled trial and a meta-analysis reported that improved glucose control may reduce hospital complications in general surgery patients (61). Improving glucose control with a basal bolus regimen resulted in a significant reduction in the frequency of composite complications including postoperative wound infection, pneumonia, bacteremia, and acute renal and respiratory failure (61). In that study, treatment with basal bolus insulin reduced average total inpatient costs per day by 14% or $751 compared to treatment with sliding scale alone (115).

HYPOGLYCEMIA

Hypoglycemia is the commonest side effect of treatment of all types of diabetes and stress hyperglycemia in the hospital setting. It presents a major barrier to satisfactory long-term glycemic control. Hypoglycemia results from an imbalance between glucose supply, glucose utilization and current insulin levels. Hypoglycemia is defined as a lower-than-normal level of blood glucose. For the purposes of hospital inpatients, hypoglycemia is defined as any glucose level <70 mg/dl (<3.9 mmol/l) (31,116). Severe hypoglycemia has been defined by many as <40 mg/dl (<2.2 mmol/l) (117). The incidence of severe hypoglycemia among the different trials ranged between 5% and 28% depending on the intensity of glycemic control in the ICU (118). Rates from trials using subcutaneous insulin in non-critically ill patients range from less than 1% to 33% (61,119,120). In 2017, the UK National Diabetes Inpatient Audit (NaDIA) data showed 18% of people with diabetes in hospital experienced one or more hypoglycemic episodes with a blood glucose <72mg/dl (<4.0 mmol/l) – down from 26% in 2011, with 7% (1 in 14) experiencing episodes requiring third party assistance to administer rescue therapy (121). The NaDIA data also showed that those with type 1 diabetes had the highest prevalence, with 25% experiencing a severe hypoglycemic episode (121). Furthermore 1.3% (1 in 80) of those in hospital with diabetes required some form of injectable rescue treatment (i.e. IV glucose or IM glucagon), down from 2.1% in 2011 (121). The same data showed that the highest proportion of episodes took place overnight (28%) between 05:00 and 09.00am when snack availability was likely to have been lowest (121).

The key predictors of hypoglycemic events in those hospitalized include older age, greater illness severity, diabetes, and the use of oral glucose lowering medications and/or insulin (122-124). In-hospital processes of care that contribute to risk for hypoglycemia include unexpected changes in nutritional intake that are not accompanied by associated changes in the glycemic management regimen (e.g., cessation of nutrition for procedures, adjustment in the amount of nutritional support), interruption of the established routine for glucose monitoring, deviations from the established glucose control protocols, and failure to adjust therapy when glucose is trending down or steroid therapy is being tapered (124-126). A common cause of inpatient hypoglycemia is insulin prescription errors including misreading poorly written prescriptions – when ‘U’ is used for units (i.e. 4U becoming 40 units) or confusing the insulin name with the dose (e.g. Humalog Mix25 becoming Humalog 25 units) (127).


Table 3 describes the most common risk factors for developing hypoglycemia in the hospital (124,128). However, other factors may also be involved, such as concurrent use of drugs with hypoglycemic agents e.g., warfarin, quinine, salicylates, fibrates, sulfonamides (including co-trimoxazole), monoamine oxidase inhibitors, NSAIDs, probenecid, somatostatin analogues, or selective serotonin reuptake inhibitors. Secondary causes of inpatient hypoglycemia include loss of counter-regulatory hormone function, e.g., Addison’s disease, growth hormone deficiency, hypothyroidism, or hypopituitarism.

Table 3. Common Risk Factors for Developing Hypoglycemia in the Hospital

Prior episode of hypoglycemia

Older age

Chronic kidney disease

Congestive heart failure

Liver Failure

Sepsis

Malnutrition

Erratic eating patterns / Nutritional interruptions / Lack of access to carbohydrates

Malignancies

Insulin regimen

Type 1 diabetes

Mental status changes

Certain concomitant use of medications

Duration of diabetes


The development of hypoglycemia is associated with poor hospital outcomes (25,97,100,102,103,129-136). Turchin et al examined data from 4,368 admission episodes for people with diabetes of which one third were on regular insulin therapy (25). Patients experiencing inpatient hypoglycemia experienced a 66% increased risk of death within one year and spent 2.8 days longer in hospital compared to those not experiencing hypoglycemia. The odds ratio (95% confidence interval) for mortality associated with one or more episodes was 2.28 (1.41-3.70, p=0.0008) among a cohort of 5,365 patients admitted to a mixed medical-surgical ICU (122). In a larger cohort of over 6,000 patients, hypoglycemia was associated with longer ICU stay and greater hospital mortality especially for patients with more than one episode of hypoglycemia (24). A 2019 systematic review and meta-analysis of hospital acquired hypoglycemia in non-ICU patients suggested that adults exposed to glucose levels <72mg/dl (<4.0 mmol/l) experienced a mean increased length of hospital stay of 4.1 days (95% CI 2.36 – 5.79) compared to those who did not experience hypoglycemia (129). The same dataset suggested an increased relative risk of in-hospital mortality for non-ICU patients of 2.09 (95% CI 1.64 – 2.67) (129). There was a non-significant reduction in mortality for those in the ICU of 0.75 (95% CI 0.49 – 1.16) (129). These data strengthen the argument to have potentially less strict glycemic targets for those not in the ICU (27). For example, if an individual has a glucose of 75 mg/dl (4.2 mmol/l), and is on an intravenous insulin infusion, by the time their bedside capillary glucose is next measured, they may have a glucose well below 72 mg/dl (4.0 mmol/l); thus, they may have potential harm. Indeed, data published from previous NaDIA surveys using data from over 100 hospitals across the UK showed several serious adverse events including seizures; permanent cerebral damage; cardiac arrests; and deaths. Insulin therapy was implicated in several of these events (28,137). The counter argument is that there are initiatives to reduce the risk of developing inpatient hypoglycemia and having national guidance has led to improved patient care overall (87,138).

Bedside point-of-care (POC) capillary glucose monitoring is recommended to assess glycemic control in hospitalized patients. Clinical guidelines recommend bedside capillary POC testing before meals and at bedtime to assess glycemic control and to adjust insulin therapy in the hospital (15). This approach; however, has been shown to fail to detect hypoglycemia, in particular nocturnal hypoglycemia and asymptomatic hypoglycemia, a common scenario in the hospital setting (139,140). Hence, the reported rates of inpatient hypoglycemia are significant and improved methods to monitor glycemic control in the hospital setting may reduce the risk of hypoglycemia. As mentioned, technological advances are currently being evaluated to allow the use of continuous glucose monitoring to help manage patients in the ICU and general wards (88-92).

Hypoglycemia has been associated with adverse cardiovascular outcomes, such as increased myocardial contractility, prolonged QT interval (possibly due to the rapid drop in potassium concentrations due to the increased circulating epinephrine and norepinephrine), ischemic electrocardiogram changes and repolarization abnormalities, angina, arrhythmias, increased inflammation, and sudden death, (43,141-143). The mechanisms for the poor outcome are not completely understood, but hypoglycemia has been associated with increases in pro-inflammatory cytokines (TNFα, IL-1β, IL-6, and IL-8), markers of lipid peroxidation, acute changes in endothelial dysfunction with associated vasoconstriction, increased blood coagulability, cellular adhesion, and oxidative stress (144-147).


Despite these observations, the direct causal effect of iatrogenic hypoglycemia on outcomes is still debatable. Kosiborod et al reported that spontaneous hypoglycemia, but not insulin – induced hypoglycemia was associated with higher in hospital mortality (133). Similarly, another study of 31,970 patients also reported that hypoglycemia is associated with increased in-hospital mortality, but the risk was limited to patients with spontaneous hypoglycemia and not to patients with drug-associated hypoglycemia (148). These studies raised the possibility that hypoglycemia, like hyperglycemia, and despite the biochemical and other changes described, is a marker of disease burden rather than a direct cause of death.

RECOMMENDATIONS FOR MANAGING HYPERGLYCEMIA IN THE HOSPITAL ENVIRONMENT

Knowledge of Diabetes Management Amongst Medical Staff

The burden on inpatient diabetes falls most frequently to junior medical staff who often have little or no specialist diabetes training. As such, it is perhaps not surprising that errors occur. In the UK, a survey of junior doctors showed that unlike other commonly encountered medical conditions, such as acute asthma or angina, their knowledge about and confidence in managing diabetes was significantly lower (149). In 2019, this was also shown in a multicenter study from the US – with the major difference being that the while most staff felt confident and comfortable managing diabetes, when challenged on how to manage certain situations, and in particular identifying glucose targets for those who were critically ill or the threshold for defining hypoglycemia, their confidence was far higher than their knowledge – a potentially devastating combination (150). Given the high prevalence of diabetes amongst hospital inpatients, basic diabetes management should be part of mandatory training.

Management of Inpatient Hyperglycemia in the ICU

Insulin is the best way to control hyperglycemia in the inpatient setting especially in the critically ill patient. A variable rate, intravenous insulin infusion is the preferred method to achieve the recommended glycemic target. The short half-life of intravenous insulin makes it ideal in this setting because of flexibility in the event of unpredicted changes in an individual’s health, medications, and nutrition.


When someone is identified as having hyperglycemia (blood glucose ≥180 mg/dl [≥10.0 mmol/l]), a variable rate intravenous insulin infusion should be started to maintain blood glucose levels <180 mg/dl (<10.0 mmol/l). A variety of intravenous infusion protocols have been shown to be effective in achieving glycemic control with a low-rate of hypoglycemic events, and in improving hospital outcomes (63,70,96,104,151-156). A proper protocol should allow flexible blood glucose targets modified based on the individuals’ clinical situation. Further, it should have clear instructions about the blood glucose threshold for initiating insulin infusion and the initial rate. The appropriate fluids should also be prescribed. It should be validated in order to avoid hyperglycemia if adjusted too slowly and hypoglycemia if adjusted too fast. Accurate insulin administration requires a reliable infusion pump that can deliver the insulin dose in increments of 0.1 unit per hour (118,154).


There is no ideal protocol for the management of hyperglycemia in the critically ill patient. In addition, there is no clear evidence demonstrating the benefit of one protocol/algorithm versus any other. The implementation of any of these algorithms requires close follow up by the nursing staff and is prone to human errors. Some institutions have developed computerized protocols that can be implemented in order to avoid errors in dosing (157-161). Essential elements that increase protocol success of continuous insulin infusion are: 1) rate adjustment that considers the current and previous glucose value and the current rate of insulin infusion, 2) rate adjustment that considers the rate of change (or lack of change) from the previous reading, and 3) frequent glucose monitoring (hourly until stable glycemia is established, and then every 2 – 3 hours) (118,152,162-164).


Several computer-based algorithms aiming to direct the nursing staff adjusting the insulin infusion rate have become commercially available (158-160,165). Retrospective cohorts have been reported, as well as controlled trials have reported a more rapid and tighter glycemic control with computer-guided algorithms than standard paper form protocols in ICU patients (157,159), as well as lower glycemic variability than patients treated with the standard insulin infusion regimens. Despite differences in glycemic control between insulin algorithms, another study showed no difference between computerized protocols versus conventional glucose control (110). Thus, most insulin algorithms appear to be appropriate alternatives for the management of hyperglycemia in critically ill patients, and the choice depends upon the physician’s preferences and cost considerations.

Managing Hyperglycemia in the Non-ICU Setting

Subcutaneous insulin is the preferred therapeutic agent for glucose control in those admitted to non-ICU settings (general medicine and surgery). Several studies have shown that the commonly used subcutaneous sliding scale insulin (SSI) is not acceptable as the single regimen in people with diabetes, because it results in undesirable levels of hypoglycemia and hyperglycemia (166-168). It has become evident in recent years that the use of scheduled subcutaneous insulin therapy with basal (e.g., glargine, detemir or degludec) once daily or with intermediate acting insulin (NPH) given twice daily alone or in combination with short (regular) or rapid acting insulin (lispro, aspart, glulisine) prior to meals is effective and safe for the management of most patients with hyperglycemia and diabetes (16,169).


The basal-bolus (prandial) insulin regimen is considered the physiologic approach as it addresses the three components of insulin requirement: basal (what is required in the fasting state), nutritional (what is required for peripheral glucose disposal following a meal), and supplemental (what is required for unexpected glucose elevations, or to dispose of glucose in hyperglycemia (169).


A prospective, randomized multi-center trial compared the efficacy and safety of a basal/bolus insulin regimen with sliding scale insulin in people with type 2 diabetes admitted to a general medicine service (119). The use of basal-bolus insulin regimen had greater improvement in blood glucose control than subcutaneous sliding scale alone. A blood glucose target <140 mg/dl (<7.8 mmol/l) was achieved in 66% of those in the glargine plus glulisine group and 38% in the sliding scale group (119). The incidence of hypoglycemia, defined as a glucose <60 mg/dl (<3.3 mmol/l), was less than 5% in those treated with basal bolus or SSI. A different study in general surgery inpatients also compared efficacy and safety of a basal bolus regimen to SSI in those with type 2 diabetes (61). The basal bolus regimen resulted in a significant improvement in glucose control and in a reduction in the frequency of the composite of postoperative complications including wound infection, pneumonia, respiratory failure, acute renal failure, and bacteremia.


The use of multi-dose human NPH and regular insulin has been compared to basal bolus treatment with insulin analogs in an open-label, controlled, multicenter trial in 130 medical admissions with type 2 diabetes (170). This study found that both treatment regimens resulted in significant improvements in inpatient glycemic control with a glucose target of <140 mg/dl (<7.8 mmol/l) before meals, as well as no difference in the rate of hypoglycemic events. Thus, it appears that similar improvement in glycemic control can be achieved with either basal bolus therapy with insulin analogs or with NPH/regular human insulin in people with type 2 diabetes.


Most people in the hospital have reduced caloric intake due to lack of appetite, medical procedures or surgical intervention. In the Basal Plus trial people with type 2 diabetes who were treated with diet, oral antidiabetic agents, or low-dose insulin (≤ 0.4 unit/kg/day) prior to admission were randomized to receive a standard basal bolus regimen with glargine once daily and glulisine before meals or a single daily dose of glargine. In addition, supplemental doses of glulisine were administered for correction of hyperglycemia (>140 mg/dl [>7.8 mmol/l]) per sliding scale (171). This study reported that the basal approach resulted in similar improvement in glycemic control and in the frequency of hypoglycemia compared to a standard basal bolus regimen (171). Thus, in insulin naive individuals or in those receiving low-dose insulin on admission, as well as those with reduced oral intake, the use of a basal plus regimen is an effective alternative to basal bolus.


The recommended total daily insulin dose for most people should start between 0.3 to 0.5 units per Kg (119,126,172,173). Starting doses greater than 0.6 – 0.8 unit/kg/day have been associated with 3-fold higher odds of hypoglycemia than doses lower than 0.2 U/kg/day. In elderly individuals or those with impaired renal function, lower initial daily doses (≤ 0.3 units/kg) may lower the risk of hypoglycemia (174).

Hospital Use of Non-Insulin Therapy in Non-Critical Care Settings

There are several other classes of non-insulin glucose lowering agents that have been tried in the hospital setting. However, most are not suitable for use. Metformin, while first line for type 2 diabetes in the outpatient setting may not be appropriate where there is any evidence of dehydration or renal impairment. Thiazolidinediones are excellent at lowering glucose, but they take several weeks to reach their maximum effect, may precipitate heart failure, and may cause peripheral oedema due to the fluid retention (175). Thus they are not suitable for the inpatient setting (176). Sulfonylureas work rapidly, and are often the drugs of choice for worsening of diabetes in an outpatient setting (177). However, they increase the risk of hypoglycemia. There are data to show that they remain one of the most frequent causes of inpatient hypoglycemia, thus extending length of hospital stay and increased risk of inpatient mortality (121,178).


Oral glucose lowering medication use is limited by the delay and unpredictability of onset of action and there is also concern regarding the cardiovascular effects with sulfonylureas and the inability to use metformin in patients with renal or liver dysfunction (15,179). Recent work using the sodium-glucose co-transporter 2 inhibitor dapagliflozin for corticosteroid-induced hyperglycemia in acute exacerbation of COPD failed to demonstrate an improvement in hyperglycemia (180).

The use of oral antidiabetic agents was not recommended in previous guidelines because of the lack of safety and efficacy studies in the inpatient setting (16). However, increasing evidence indicates that treatment with dipeptidyl peptidase-4 (DPP4) inhibitors, alone or in combination with basal insulin, is safe and effective in general medicine and surgery patients with mild to moderate hyperglycemia. In a pilot study, in general medicine and surgery patients with a blood glucose between 140 and 400 mg/dl (7.8 – 22.2 mmol/l) treated with diet, oral antidiabetic drugs, or low- dose insulin (≤0.4 U/kg/day) who were randomized to sitagliptin once daily, sitagliptin and basal insulin, or basal bolus insulin (181). All groups received correction doses of lispro before meals and bedtime for blood glucose >140 mg/dl (>7.8 mmol/l). In those with mild-moderate hyperglycemia (<180 mg/dl [<10 mmol/l]), the use of sitagliptin plus supplemental (correction doses) or in combination with basal insulin resulted in no significant differences in mean daily blood glucose, frequency of hypoglycemia, or in the number of treatment failures compared to a basal bolus regimen (181). The SITA-HOSPITAL trial, a multicenter, randomized controlled study in 279 general medicine and surgery patients with type 2 diabetes previously treated with oral anti-diabetic agents or low-dose insulin (<0.6 U/kg/d) also reported similar glycemic control, hypoglycemia rate, hospital length-of-stay, treatment failures, or hospital complications (including acute kidney injury or pancreatitis) between the combination of oral sitagliptin plus basal insulin to the more labor-intensive basal-bolus insulin regimen (182).


In 2020 a pooled analysis from three prospective studies using DPP4-i in general medicine and surgery patients with type 2 diabetes reported that treatment with DPP4-i alone or with basal insulin plus correctional doses with rapid-acting insulin for glucose >140mg/dl. reported no differences in mean hospital daily blood glucose, percentage of glucose readings within target of 70-180 mg/dl, length of stay, or complications. Importantly there was less hypoglycemia with DPP4-i compared to basal bolus insulin regimen (183).

Glucose Monitoring in the Hospital

All patients admitted to the hospital with a diagnosis of diabetes and those with newly discovered hyperglycemia should be monitored closely (38). The frequency of monitoring and the schedule of the blood glucose checks will depend on the nutritional intake, patient treatment, and schedule of insulin. There is some controversy regarding the best method to monitor blood glucose. However, considering the convenience and wide availability of the capillary point of care (POC) testing we suggest this as the best approach as long as it is done with a monitoring device that has demonstrated accuracy (184,185). It is important that when using POC blood glucose meters, that several things be kept in mind, in particular overall clinical conditions that might affect the POC value such as hemoglobin level, perfusion, and medications. Table 4 summarizes potential schedules for blood glucose monitoring based on the patient’s nutritional intake and medical regimen.


Several studies have reported on the efficacy of continuous glucose monitoring (CGM) in insulin treated patients in the hospital (88-92). The CGM devices provide estimated glucose values every 5-15 minutes resulting in a better assessment of glycemic control than capillary POC testing (186-188). Recent observational studies have shown increased detection of hypoglycemic events using CGM in the hospital in insulin treated patients (139,189). Additionally, a recent randomized trial by Singh et al. showed the ability of CGM to prevent and reduce hypoglycemia in high-risk hospitalized patients with diabetes through the use of remote CGM alarms (190). There are some concerns including the accuracy of CGM data when acute physiologic disturbances are present (i.e., hypoxemia, vasoconstriction, and rapidly changing glucose levels in diabetic ketoacidosis) or interference with glucose readings (such as salicylic acid, acetaminophen). They should also be removed for certain procedures – with each company having their own list –such as MRIs, CT scans, and diathermy. The use of CGM in the hospital has not been approved by regulatory agencies and remains investigational. Ongoing studies (NCT03832907) with factory-calibrated CGM are testing its accuracy in diverse inpatient populations and the use of a Glucose Telemetry System (GTS) with which glucose values can be wirelessly transmitted from the patient's bedside (CGMS) to a monitor device at the nursing station (NCT03508934, NCT03877068).


Table 4. Glucose Monitoring Schedule Based on Nutritional Intake, Insulin Regimen, and Special Patient Situations

Diet

Regimen

Glucose monitoring

Special caveats

NPO

Intravenous insulin infusion

Every 1-2 hrs


NPO

SC regular insulin every 6 hrs (6 am, noon, 6pm, midnight)

Every 6 hrs (6 am, noon, 6pm, midnight) prior to SC insulin dose


NPO

Basal insulin alone (e.g., glargine or detemir)

Every 6 hrs (6 am, noon, 6pm, midnight)


Eating 3 meals per day

Basal/bolus regimen with long acting (e.g., glargine, detemir) and rapid- acting insulin with meals (aspart, lispro, glulisine)

4 times per day: before breakfast, before lunch, before evening meal, and bedtime.

Consider a 3 am blood glucose check in those at risk of hypoglycemia

Nocturnal tube feeds and daytime oral intake

Regimen varies depending on clinical status. Basal insulin plus corrections or basal bolus with long and rapid-acting insulin.

Basal in AM and low- dose NPH insulin at the start of the nocturnal tube feeds

5 times per day: before breakfast, before lunch, before evening meal, bedtime and 3 am.


Continuous tube feeds

Basal insulin plus correction with regular insulin every 4-6 hours. NPH 2 or 3 times daily or regular insulin every 6 hrs

Every 6 hrs (6 am, noon, 6pm, midnight)


Patients eating small multiple meals per day. (e.g., cystic fibrosis)

Basal/bolus with long-acting insulin and rapid – acting insulin with meals – e.g. (carbohydrate counting)

At least 4 times per day: before breakfast, before lunch, before evening meal, and bedtime

More frequent checks might be warranted in order to include post prandial blood glucose

Those on high dose corticosteroids

Basal/bolus with long-acting insulin and rapid-acting insulin with meals. May add small dose of NPH to basal bolus regimen in those on morning dose of steroids.

AM dose of NPH may be used without basal insulin in persons on intermediate acting steroids (prednisone, methylprednisone) administered once daily

4 times per day: before breakfast, before lunch, before evening meal, and bedtime


NPO or eating 3 meals per day

Those on insulin pumps

4-8 times per day: before breakfast, before lunch, before evening meal, and bedtime. Consider post-prandial checks


NPO – nothing by mouth. NPH – Neutral Protamine Hagedorn, SC - subcutaneous

Medical Nutrition Therapy (MNT) in Hospitalized Patients with Diabetes

Medical nutrition therapy is a key component of the comprehensive management of diabetes and hyperglycemia in the inpatient setting. Maintaining adequate nutrition is important for glycemic control and to meet adequate caloric demands. Caloric demand in acute illness will differ from that in the outpatient setting. Achieving the proper nutritional balance in the inpatient setting is challenging. Anyone admitted to the hospital with diabetes or hyperglycemia should be assessed to determine the need for a modified diet in order to meet caloric demand.


The general approach to address MNT in the inpatient setting is usually based on expert opinions and patient need. There is limited data regarding what is the best approach or method to achieve the ideal caloric supply. To determine the best approach, method, and caloric needs of their patients, providers should work closely with a nutrition professional.


All patients with diabetes or hyperglycemia should receive an individualized assessment. In general, most patients will receive adequate caloric needs with 3 discrete meals per day. Further, the metabolic need for patients with diabetes is usually provided by 25 to 35 calories/kg where some critically ill patients might require less than 15 to 25 calories/kg per day (191). A consistent carbohydrate meal-planning system might help to facilitate glycemic control and insulin dosing in the inpatient setting. Most patients will require 1,500-2000 calories per day with 12-15 grams of carbohydrates per meal (15). Ideally, the carbohydrates should come from low glycemic index foods such as whole grains and vegetables.


Those individuals not able to achieve these goals should be evaluated in order to determine the need for enteral or parenteral nutrition. Enteral nutrition is the second-best option after oral nutrition and should be preferred over parenteral nutrition in hospitalized individuals (192,193). There are several advantages of enteral feeding versus parenteral feeding including: low cost, low risk of complications, physiologic route, less risk for gastric mucosa atrophy, and lower risk of infectious and thrombotic complications compared with the latter form of therapy (192,194). The benefit of parental nutrition has been documented in the critically ill patient. However, some research has shown a detrimental effect on patients with diabetes and hyperglycemia. Parental nutrition should be considered only in patients that are not able to receive enteral nutrition and should be coordinated with the institution parenteral nutrition team.


Enteral and parenteral nutrition can prevent the effects of starvation and malnutrition (192). The preference for use of EN over PN whenever possible is due to a lower risk of infectious and thrombotic complications (194,195). Standard enteral formulas reflect the reference values for macro- and micronutrients for a healthy population and contain 1-2 cal/ml. Most standard formulas contain whole protein, lipid in the form of long-chain triglycerides, and carbohydrates. Standard diabetes-specific formulas provide low amounts of lipids (30% of total calories) combined with a high carbohydrates (HCH) content (55–60% of total calories); however, newer diabetic formulas have replaced part of the carbohydrates with monounsaturated fatty acids (up to 35% of total calories) and also include 10-15 g/l dietary fiber and up to 30% fructose (196,197).


Diabetic enteral formulas containing low-carbohydrate high–monounsaturated fatty acids (LCHM) are preferable to standard high-carbohydrate formulas in hospitalized patients with type 1 and type 2 diabetes (196,198). A meta-analysis of studies comparing relatively newer enteral low-carbohydrate high-monounsaturated fatty acid (LCHM) formulas with older formulations, the postprandial rise in blood glucose was reduced by 18- 29 mg/dl with the newer formulations (198). Table 5 depicts the composition of standard and diabetic specific enteral formulas commonly used in hospitalized patients.


Table 5. Composition of Standard and Diabetic Specific Enteral Formulas Commonly Used in Hospitalized Patients in the USA


Calories (kcal/mL)

Carbohydrate (g/l)

Fat (g/l)

Protein (g/l)

Manufacture

Standard formula


Jevity® 1.0 Cal

1.0

155

35

44

Abbott Nutrition

Nutren® 1.0

1.0

127

38

40

Nestle Nutrition

Osmolite® 1.2 Cal

1.2

158

39

55

Abbott Nutrition

Jevity® 1.2

1.2

169

39

56

Nestle Nutrition

Fibersource® HN

1.2

160

39

53

Nestle Nutrition

Isosource® 1.5 Cal

1.5

170

65

68

Nestle Nutrition

Jevity® 1.5

1.5

216

50

64

Nestle Nutrition

Diabetes specific formula

Glucerna® 1.0 Cal

1.0

96

54

42

Abbott Nutrition

Nutren® Glytrol®

1.0

100

48

45

Nestle Nutrition

Glucerna® 1.2 Cal

1.2

115

60

60

Abbott Nutrition

Diabetisource® AC

1.2

100

59

60

Nestle Nutrition

Glucerna® 1.5 Cal

1.5

133

75

82

Abbott Nutrition


The UK Joint British Diabetes Societies has produced specific guidelines for the management of diabetes in those who are parenterally fed (193).

Corticosteroid Therapy – Impact on Blood Glucose

Steroid use in hospitalized patients is common. A single center cross sectional study showed that 12.8% of all the people in the hospital were on glucocorticoids (199). Steroids may be administered by various regimes and at variable doses. A single daily dose of steroid (e.g., prednisolone/prednisone) in the morning may be the commonest mode of administration (177,199,200). In susceptible individuals, this will often result in a rise in blood glucose by late morning that continues through to the evening. Overnight the blood glucose generally often falls back to baseline levels by the next morning. Thus, treatment should be tailored to treating the hyperglycemia, while avoiding nocturnal and early morning hypoglycemia. Multiple daily doses of steroid, be it intravenous hydrocortisone or oral dexamethasone, can cause a hyperglycemic effect throughout the 24-hour period. It may be, however that a twice daily premixed or basal bolus regimen may need to be started if oral medication, or once daily insulin proves insufficient to control hyperglycemia. Close attention will therefore need to be paid to blood glucose monitoring and early intervention may be necessary.


Glucose levels in most individuals can be predicted to rise approximately 4 to 8 hours following the administration of oral steroids, and sooner following the administration of intravenous steroids. Again, capillary blood glucose monitoring is paramount to guide appropriate therapeutic interventions. Conversely, glucose levels may improve to pre-steroid levels 24 hours after intravenous steroids are discontinued. If oral steroids are weaned down over several weeks, the glucose levels may decline in a dose dependent fashion, but this may not occur, particularly in those with pre-existing undiagnosed diabetes.


At the commencement of steroid therapy, or for those already on a supraphysiological dose of corticosteroid, capillary blood glucose testing should occur before meals and at bedtime, in particular before lunch or evening meal, when the hyperglycemic effects of a morning dose of steroid is likely to be greatest.


It is likely that subcutaneous insulin using a basal, or multiple daily injection regimen will be the most appropriate choice to achieve glycemic control in the event of hyperglycemia for the majority of patients. Morning administration of basal human insulin may closely fit the glucose excursion induced by a single morning dose of oral steroid. Basal analogue insulin may be appropriate if hyperglycemia is present for more prolonged periods. However, care should be taken to identify and protect against hypoglycemia overnight and in the early morning if long-acting insulin analogues are used in this context. Subsequent titration of the insulin dose   may be required to allow maintenance of glucose control in the face of increasing or decreasing steroid dose.


When a patient is discharged from the hospital on steroid therapy, a clear strategy for the management of hyperglycemia or potential hyperglycemia, and the titration of therapy to address the hyperglycemia, should be communicated to the community diabetes team and primary care team. Patients commenced on steroids as an inpatient and discharged after a short stay with the intention of continuing high dose steroids, should receive standard education in regard to diabetes, encompassing the risks associated with hyperglycemia and hypoglycemia.

Closed-Loop Technology 

Recent studies have reported that closed-loop systems, also referred to as artificial pancreas or automated insulin delivery systems have reported good efficacy with improved time in target and lower mean daily blood glucose without an increased rate of hypoglycemia in the ICU (201,202) and in non-ICU settings (203,204). In one non-ICU study, the time in target range between 100-180 mg/dl (5.6-10.0 mmol/l) was reported to be 59.8% in patients using the closed-loop technology compared to 38.1% with standard subcutaneous insulin regimen (204). Similarly, a closed-loop study in patients receiving nutritional support also reported higher time in target glucose range (68% vs 36.4%) and lower mean glucose values (153 vs 205 mg/dl [8.5-11.4 mmol/l]) compared to a standard insulin regimen (205). Same as the use of CGM in the hospital, treatment with artificial pancreas is experimental and larger studies are needed to prove safety and efficacy in ICU and non-ICU settings.

REFERENCES

  1. Federation ID. IDF atlas 9th edition. 2019; https://www.diabetesatlas.org/en/.
  2. Prevention CfDCa. National diabetes statistics report 2020. Estimates of diabetes and its burden in the United States. 2020; https://www.cdc.gov/diabetes/pdfs/data/statistics/national-diabetes-statistics-report.pdf.
  3. Boyle JP, Thompson TJ, Gregg EW, Barker LE, Williamson DF. Projection of the year 2050 burden of diabetes in the US adult population: dynamic modeling of incidence, mortality, and prediabetes prevalence. Population Health Metrics 2010; 8:29
  4. Pournaras DJ, Photi ES, Barnett N, Challand CP, Chatzizacharias NA, Dlamini NP, Doulias T, Foley A, Hernon J, Kumar B, Martin J, Nunney I, Panagiotopoulou I, Sengupta N, Shivakumar O, Sinclair P, Stather P, Than MM, Wells AC, Xanthis A, Dhatariya K. Assessing the quality of primary care referrals to surgery of patients with diabetes in the East of England: A multi-centre cross-sectional cohort study. International Journal of Clinical Practice 2017; 71:e12971
  5. Jiang HJ, Stryer D, Friedman B, Andrews R. Multiple hospitalizations for patients with diabetes. Diabetes Care 2003; 26:1421-1426
  6. Donnan PT, Leese GP, Morris AD. Hospitalizations for people with type 1 and type 2 diabetes compared with the nondiabetic population of Tayside, Scotland: a retrospective cohort study of resource use. Diabetes Care 2000; 23:1774-1779
  7. Harding JL, Benoit SR, Gregg EW, Pavkov ME, Perreault L. Trends in rates of infections requiring hospitalization among adults with versus without diabetes in the U.S., 2000 - 2015. Diabetes Care 2020; 43:106-116
  8. Umpierrez GE, Isaacs SD, Bazargan N, You X, Thaler LM, Kitabchi AE. Hyperglycemia: An independent marker of in-hospital mortality in patients with undiagnosed diabetes. Journal of Clinical Endocrinology Metabolism 2002; 87:978-982
  9. Digital N. National Diabetes Inpatient Audit (NaDIA) - 2018. 2019; https://digital.nhs.uk/data-and-information/publications/statistical/national-diabetes-inpatient-audit/2018.
  10. Sampson MJ, Dozio N, Ferguson B, Dhatariya K. Total and excess bed occupancy by age, speciality and insulin use for nearly one million diabetes patients discharged from all English Acute Hospitals. Diabetes Research & Clinical Practice 2007; 77:92-98
  11. Association AD. Economic costs of diabetes in the U.S. in 2017. Diabetes Care 2018; 41:917-928
  12. Prevention CfDCa. National vital statistics report. Deaths: Final data for 2017. 2019; 9:https://www.cdc.gov/nchs/data/nvsr/nvsr68/nvsr68_09-508.pdf, 68.
  13. Bommer C, Heesemann E, Sagalova V, Manne-Goehler J, Atun R, Barnighausen T, Vollmer S. The global economic burden of diabetes in adults aged 20-79 years: a cost-of-illness study. Lancet Diabetes and Endocrinology 2017; 5:423-430
  14. Bommer C, Sagalova V, Heesemann E, Manne-Goehler J, Atun R, Barnighausen T, Davies J, Vollmer S. Global economic burden of diabetes in adults: Projections from 2015 to 2030. Diabetes Care 2018; 41:963-970
  15. Umpierrez GE, Hellman R, Korytkowski MT, Kosiborod M, Maynard GA, Montori VM, Seley JJ, Van den Berghe G. Management of hyperglycemia in hospitalized patients in non-critical care setting: An Endocrine Society clinical practice guideline. Journal of Clinical Endocrinology Metabolism 2012; 97:16-38
  16. Moghissi ES, Korytkowski MT, Dinardo MM, Hellman R, Hirsch IB, Inzucchi S, Ismail-Beigi F, Kirkman MS, Umpierrez GE. American Association of Clinical Endocrinologists and American Diabetes Association consensus statement on inpatient glycemic control. Diabetes Care 2009; 32:1119-1131
  17. Dhatariya K, Mustafa OG, Rayman G. Safe care for people with diabetes in hospital. Clinical Medicine 2020; 20:21-27
  18. Sampson M. A good inpatient diabetes service. https://abcd.care/sites/abcd.care/files/resources/A_good_Inpatient%20Service_FINAL_Aug_19.pdf 2019; https://abcd.care/sites/abcd.care/files/resources/A_good_Inpatient%20Service_FINAL_Aug_19.pdf.
  19. investigators NSs. Intensive versus conventional glucose control in critically ill patients. New England Journal of Medicine 2009; 360:1283-1297
  20. Hulkower RD, Pollack RM, Zonszein J. Understanding hypoglycemia in hospitalized patients. Diabetes Management (Lond) 2014; 4:165-176
  21. McDonnell ME, Umpierrez GE. Insulin therapy for the management of hyperglycemia in hospitalized patients. Endocrinology & Metabolism Clinics of North America 2012; 41:175-201
  22. Qaseem A, Humphrey LL, Chou R, Snow V, Shekelle P, Physicians ftCGCotACo. Use of intensive insulin therapy for the management of glycemic control in hospitalized patients: A clinical practice guideline from the American College of Physicians. Annals of Internal Medicine 2011; 154:260-267
  23. Cook CB, Kongable GL, Potter DJ, Abad VJ, Leija DE, Anderson M. Inpatient glucose control: a glycemic survey of 126 U.S. hospitals. Journal of Hospital Medicine 2009; 4:E7-E14
  24. investigators NSs. Hypoglycemia and risk of death in critically ill patients. New England Journal of Medicine 2012; 367:1108-1118
  25. Turchin A, Matheny ME, Shubina M, Scanlon JV, Greenwood B, Pendergrass ML. Hypoglycemia and clinical outcomes in patients with diabetes hospitalized in the general ward. Diabetes Care 2009; 32:1153-1157
  26. Yamada T, Shojima N, Noma H, Yamauchi T, Kadowaki T. Glycemic control, mortality, and hypoglycemia in critically ill patients: a systematic review and network meta-analysis of randomized controlled trials. Intensive Care Medicine 2017; 43:1-15
  27. Levy N, Hall GM. National guidance contributes to the high incidence of inpatient hypoglycaemia. Diabetic Medicine 2019; 36:120-121
  28. Digital N. National Diabetes Inpatient Audit - Harms, 2019. 2019; https://digital.nhs.uk/data-and-information/clinical-audits-and-registries/national-diabetes-in-patient-audit-nadia-harms.
  29. Handelsman Y, Bloomgarden ZT, Grunberger G, Umpierrez G, Zimmerman RS, Bailey TS, Blonde L, Bray GA, Cohen AJ, Dagogo-Jack S, Davidson JA, Einhorn D, Ganda AP, Garber AJ, Garvey WT, Henry RR, Hirsch IB, Horton ES, Hurley DL, Jellinger PS, Jovanovic L, Lebovitz HE, LeRoith D, Levy P, McGill JB, Mechanick JI, Mestman JH, Moghissi ES, Orzeck EA, Pessah-Pollack R, Rosenblit PD, Vinik AI, Wyne K, Zangeneh F. American Association of Clinical Endocrinologists and American College of Endocrinology - clinical practice guidelines for developing a diabetes mellitus comprehensive care plan - 2015. Endocrine Practice 2015; 21:1-87
  30. Jacobi J, Bircher N, Krinsley J, Agus M, Braithwaite SS, Duutschman C, Freire AX, Geehan D, Kohl B, Nasraway SA, Rigby M, Sands K, Schallom L, Taylor B, Umpierrez G, Mazuski J, Schunemann H. Guidelines for the use of an insulin infusion for the management of hyperglycemia in critically ill patients. Critical Care Medicine 2012; 40:3251-3276
  31. Association AD. Diabetes care in the hospital: Standards of medical care in diabetes - 2020. Diabetes Care 2020; 43:S193-S202
  32. Kitabchi AE, Umpierrez GE, Miles JM, Fisher JN. Hyperglycemic crises in adult patients with diabetes. Diabetes Care 2009; 32:1335-1343
  33. Swanson C, Potter D, Kongable G, Cook C. Update on inpatient glycemic control in hospitals in the United States. Endocrine Practice 2017; 17:853-861
  34. Schmeltz LR, DeSantis AJ, Thiyagarajan V, Schmidt K, Shea-Mahler E, Johnson D, Henske J, McCarthy PM, Gleason TG, McGee EC, Molitch ME. Reduction of surgical mortality and morbidity in diabetic patients undergoing cardiac surgery with a combined intravenous and subcutaneous insulin glucose management strategy. Diabetes Care 2007; 30:823-828
  35. Carpenter DL, Gregg SR, Xu K, Buchman TG, Coopersmith CM. Prevalence and impact of unknown diabetes in the ICU. Critical Care Medicine 2015; 43:e541-e550
  36. Van Ackerbroeck S, Schepens T, Janssens K, Jorens PG, Verbrugge W, Collet S, Van Hoof V, Van Gaal L, De Block C. Incidence and predisposing factors for the development of disturbed glucose metabolism and DIabetes mellitus AFter Intensive Care admission: the DIAFIC study. Critical Care 2015; 19:355
  37. Kar P, Plummer MP, Ali Abdelhamid Y, Giersch EJ, Summers MJ, Weinel LM, Finnis ME, Phillips LK, Jones KL, Horowitz M, Deane AM. Incident diabetes in survivors of critical illness and mechanisms underlying persistent glucose intolerance: A prospective cohort study. Critical Care Medicine 2019; 47:e103-e111
  38. Dhatariya K, James J, Kong M-F, Berrington R. Diabetes at the front door. A guideline for dealing with glucose related emergencies at the time of acute hospital admission from the Joint British Diabetes Society (JBDS) for Inpatient Care Group. Diabetic Medicine 2020; 37:1578-1589
  39. Pasquel FJ, Gomez-Huelgas R, Anzola I, Oyedokun F, Haw JS, Vellanki P, Peng L, Umpierrez GE. Predictive value of admission hemoglobin A1c on inpatient glycemic control and response to insulin therapy in medicine and surgery patients with type 2 diabetes. Diabetes Care 2015; 38:e202-e203
  40. Greci LS, Kailasam M, Malkani S, Katz DL, Hulinsky I, Ahmadi R, Nawaz H. Utility of HbA1c levels for diabetes case finding in hospitalized patients with hyperglycemia. Diabetes Care 2003; 26:1064-1068
  41. Mazurek JA, Hailpern SM, Goring T, Nordin C. Prevalence of hemoglobin A1c greater than 6.5% and 7.0% among hospitalized patients without known diagnosis of diabetes at an urban inner city hospital. Journal of Clinical Endocrinology & Metabolism 2010; 95:1344-1348
  42. Cryer PE. Hypoglycemia, functional brain failure, and brain death. Journal of Clinical Investigation 2014; 117:868-870
  43. Amiel SA, Aschner P, Childs B, Cryer PE, de Galan BE, Frier BM, Gonder-Frederick L, Heller SR, Jones T, Khunti K, Leiter LA, Luo Y, McCrimmon RJ, Pedersen-bjergaard U, Seaquist ER, Zoungas S. Hypoglycaemia, cardiovascular disease, and mortality in diabetes: epidemiology, pathogenesis, and management. Lancet Diabetes & Endocrinology 2019; 7:385-396
  44. Corssmit EP, Romijn JA, Sauerwein HP. Regulation of glucose production with special attention to nonclassical regulatory mechanisms: A review. Metabolism 2014; 50:742-755
  45. Boden G. Gluconeogenesis and glycogenolysis in health and diabetes. Journal of Investigative Medicine 2004; 52:375-378
  46. van de Werve G, Jeanrenaud B. Liver glycogen metabolism: An overview. Diabetes/Metabolism Reviews 1987; 3:47-78
  47. Gerich JE, Lorenzi M, Bier DM, Tsalikian E, Schneider V, Karam JH, Forsham PH. Effects of physiologic levels of glucagon and growth hormone on human carbohydrate and lipid metabolism. Studies involving administration of exogenous hormone during suppression of endogenous hormone secretion with somatostatin. Journal of Clinical Investigation 1976; 57:875-884
  48. Rizza RA, Mandarino LJ, Gerich JE. Dose-response characteristics for effects of insulin on production and utilization of glucose in man. American Journal of Physiology - Endocrinology & Metabolism 1981; 240:E630-E639
  49. Dungan KM, Braithwaite SS, Preiser J-C. Stress hyperglycaemia. Lancet 2009; 373:1798-1807
  50. McCowen KC, Malhotra A, Bistrian BR. Stress-induced hyperglycemia. Critical Care Clinics 2001; 17:107-124
  51. Stentz FB, Umpierrez GE, Cuervo R, Kitabchi AE. Proinflammatory cytokines, markers of cardiovascular risks, oxidative stress, and lipid peroxidation in patients with hyperglycemic crises. Diabetes 2004; 53:2079-2086
  52. Chaudhuri A, Umpierrez GE. Oxidative stress and inflammation in hyperglycemic crises and resolution with insulin: implications for the acute and chronic complications of hyperglycemia. Journal of Diabetes and its Complications 2012; 26:257-258
  53. Reyes-Umpierrez D, Davis G, Cardona S, Pasquel FJ, Peng L, Jacobs S, Vellanki P, Fayfman M, Haw S, Halkos M, Guyton RA, Thourani VH, Umpierrez GE. Inflammation and oxidative stress in cardiac surgery patients treated to intensive versus conservative glucose targets. Journal of Clinical Endocrinology & Metabolism 2016; 102:309-315
  54. Esposito K, Nappo F, Marfella R, Giugliano G, Giugliano F, Ciotola M, Quagliaro L, Ceriello A, Giugliano D. Inflammatory cytokine concentrations are acutely increased by hyperglycemia in humans: Role of oxidative stress. Circulation 2002; 106:2067-2072
  55. Fan J, Li YH, Wojnar MM, Lang CH. Endotoxin-induced alterations in insulin-stimulated phosphorylation of insulin receptor, IRS-1, and MAP kinase in skeletal muscle. Shock 1996; 6:164-170
  56. Evans NR, Dhatariya KK. Assessing the relationship between admission glucose levels, subsequent length of hospital stay, readmission and mortality. Clinical Medicine, Journal of the Royal College of Physicians 2012; 12:137-139
  57. Haddadin F, Clark A, Evans N, Dhatariya K. Admission blood glucose helps predict 1 year, but not 2 years, mortality in an unselected cohort of acute general medical admissions. International Journal of Clinical Practice 2014; 69:643-648
  58. Frisch A, Chandra P, Smiley D, Peng L, Rizzo M, Gatcliffe C, Hudson M, Mendoza J, Johnson R, Lin E, Umpierrez GE. Prevalence and clinical outcome of hyperglycemia in the perioperative period in noncardiac surgery. Diabetes Care 2010; 33:1783-1788
  59. Kotagal M, Symons RG, Hirsch IB, Umpierrez GE, Dellinger EP, Farrokhi ET, Flum DR. Perioperative hyperglycemia and risk of adverse events among patients with and without diabetes. Annals of Surgery 2016; 261:97-103
  60. Umpierrez G, Cardona S, Pasquel F, Jacobs S, Peng L, Unigwe M, Newton CA, Smiley-Byrd D, Vellanki P, Halkos M, Puskas JD, Guyton RA, Thourani VH. Randomized controlled trial of intensive versus conservative glucose control in patients undergoing coronary artery bypass graft surgery: GLUCO-CABG trial. Diabetes Care 2015; 38:1665-1672
  61. Umpierrez GE, Smiley D, Jacobs S, Peng L, Temponi A, Mulligan P, Umpierrez D, Newton C, Olson D, Rizzo M. Randomized study of basal-bolus insulin therapy in the inpatient management of patients with type 2 diabetes undergoing general surgery (RABBIT 2 Surgery). Diabetes Care 2011; 34:256-261
  62. Krinsley JS. Association between hyperglycemia and increased hospital mortality in a heterogeneous population of critically ill patients. Mayo Clinic Proceedings 2003; 78:1471-1478
  63. Furnary AP, Zerr KJ, Grunkemeier GL, Starr A. Continuous intravenous insulin infusion reduces the incidence of deep sternal wound infection in diabetic patients after cardiac surgical procedures. Annals of Thoracic Surgery 1999; 67:352-362
  64. Montori VM, Bistrian BR, McMahon MM. Hyperglycemia in acutely ill patients. JAMA 2002; 288:2167-2169
  65. Falciglia M, Freyberg RW, Almenoff PL, D'Alessio DA, Render ML. Hyperglycemia-related mortality in critically ill patients varies with admission diagnosis. Critical Care Medicine 2009; 37:3001-3009
  66. Bruno A, Gregori D, Caropreso A, Lazzarato F, Petrinco M, Pagano E. Normal glucose values are associated with a lower risk of mortality in hospitalized patients. Diabetes Care 2008; 31:2209-2210
  67. Blaha J, Mraz M, Kopecky P, Stritesky M, Lips M, Matias M, Kunstyr J, Porizka M, Kotulak T, Kolnikova I, Simanovska B, Zakharchenko M, Rulisek J, Sachl R, Anyz J, Novak D, Linder J, Hovorka R, Svacina S, Haluzik M. Perioperative tight glucose control reduces postoperative adverse events in nondiabetic cardiac surgery patients. Journal of Clinical Endocrinology & Metabolism 2015; 100:3081-3089
  68. McAlister FA, Majumdar SR, Blitz S, Rowe BH, Romney J, Marrie TJ. The relation between hyperglycemia and outcomes in 2,471 patients admitted to the hospital with community-acquired pneumonia. Diabetes Care 2005; 28:810-815
  69. Rains JL, Jain SK. Oxidative stress, insulin signaling, and diabetes. Free Radical Biology and Medicine 2011; 50:567-575
  70. Furnary AP, Gao G, Grunkemeier GL, Wu Y, Zerr KJ, Bookin SO, Floten HS, Starr A. Continuous insulin infusion reduces mortality in patients with diabetes undergoing coronary artery bypass grafting. Journal of Thoracic & Cardiovascular Surgery 2003; 125:1007-1021
  71. Krinsley JS, Maurer P, Holewinski S, Hayes R, McComsey D, Umpierrez GE, Nasraway SA. Glucose control, diabetes status, and mortality in critically ill patients. Mayo Clinic Proceedings 2017; 92:1019-1029
  72. van Vught LA, Holman R, de Jong E, de Keizer NF, van der Poll T. Diabetes is not associated with increased 90-day mortality risk in critically ill patients with sepsis. Critical Care Medicine 2017; 45:e1026-e1035
  73. Vanhorebeek I, Gunst J, Van den Berghe G. Critical care management of stress-induced hyperglycemia. Current Diabetes Reports 2018; 18:17
  74. Baker EH, Janaway CH, Philips BJ, Brennan AL, Baines DL, Wood DM, Jones PW. Hyperglycaemia is associated with poor outcomes in patients admitted to hospital with acute exacerbations of chronic obstructive pulmonary disease. Thorax 2006; 61:284-289
  75. Martin ET, Kaye KS, Knott C, Nguyen H, Santarossa M, Evans R, Bertran E, Jaber L. Diabetes and risk of surgical site infection: A systematic review and meta-analysis. Infection Control & Hospital Epidemiology 2016; 37:88-99
  76. Noordzij PG, Boersma E, Schreiner F, Kertai MD, Feringa HH, Dunkelgrun M, Bax JJ, Klein J, Poldermans D. Increased preoperative glucose levels are associated with perioperative mortality in patients undergoing noncardiac, nonvascular surgery. European Journal of Endocrinology 2007; 156:137-142
  77. Pomposelli JJ, Baxter JK, Babineau TJ, Pomfret EA, Driscoll DF, Forse RA, Bistrian BR. Early postoperative glucose control predicts nosocomial infection rate in diabetic patients. Journal of Parenteral and Enteral Nutrition 1998; 22:77-81
  78. Ramos M, Khalpey Z, Lipsitz S, Steinberg J, Panizales MT, Zinner M, Rogers SO. Relationship of perioperative hyperglycemia and postoperative infections in patients who undergo general and vascular surgery. Annals of Surgery 2015; 248:585-591
  79. Sadoskas D, Suder NC, Wukich DK. Perioperative glycemic control and the effect on surgical site infections in diabetic patients undergoing foot and ankle surgery. Foot and Ankle Specialist 2016; 9:24-30
  80. Wallia A, Schmidt K, Oakes DJ, Pollack T, Welsh N, Kling-Colson S, Gupta S, Fulkerson C, Aleppo G, Parikh N, Levitsky J, Norvell JP, Rademaker A, Molitch ME. Glycemic control reduces infections in post-liver transplant patients: Results of a prospective, randomized study. Journal of Clinical Endocrinology & Metabolism 2017; 102:451-459
  81. Kyi M, Colman PG, Wraight PR, Reid J, Gorelik A, Galligan A, Kumar S, Rowan LM, Marley KA, Nankervis AJ, Russell DM, Fourlanos S. Early intervention for diabetes in medical and surgical inpatients decreases hyperglycemia and hospital-acquired infections: A cluster randomized trial. Diabetes Care 2019; 42:832-840
  82. Sheen YJ, Huang CC, Huang SC, Hung MD, Lin CH, Lee IT, Lin SY, Sheu WH. Implimentation of an electronic dashboard with a remote management system to improve glycemic management among hospitalized adults. Endocrine Practice 2020; 26:179-191
  83. Garg R, Schuman B, Bader A, Hurwitz S, Turchin A, Underwood P, Metzger C, Rein R, Lortie M. Effect of preoperative diabetes management on glycemic control and clinical outcomes after elective surgery. Annals of Surgery 2018; 267:858-862
  84. Gregory NS, Seley JJ, Ukena J, Shah S, Fred MR, Dargar SK, Mauer E, Kim RJ. Decreased rates of inpatient hypoglycemia following implementation of an automated tool in the electronic medical record for identifying root causes. Journal of Diabetes Science and Technology 2018; 12:63-68
  85. Wang YY, Hu SF, Ying HM, Chen L, Li HL, Tian F, Zhou ZF. Postoperative tight glycemic control significantly reduces postoperative infection rates in patients undergoing surgery: A meta-analysis. BMC Endocrine Disorders 2018; 18:42
  86. Yamamoto JM, Murphy HR. Inpatient hypoglycaemia; should we should we focus on the guidelines, the targets or our tools? Diabetic Medicine 2019; 36:122-123
  87. Dashora U, George S, Sampson M, Walden E. National guidelines have contributed to safer care for inpatients with diabetes. Diabetic Medicine 2019; 36:124-126
  88. Wernerman J, Desaive T, Finfer S, Foubert L, Furnary A, Holzinger U, Hovorka R, Joseph J, Kosiborod M, Krinsley J, Mesotten D, Nasraway S, Rooyackers O, Schultz M, Van Herpe T, Vigersky R, Preiser JC. Continuous glucose control in the ICU: report of a 2013 round table meeting. Critical Care 2014; 18:226
  89. Amrein K, Ellmerer M, Hovorka R, Kachel N, Fries H, von Lewinski D, Smolle K, Pieber TR, Plank J. Efficacy and safety of glucose control with space GlucoseControl in the medical intensive care unit - An open clinical investigation. Diabetes Technology & Therapeutics 2012; 14:690-695
  90. Leelarathna L, English SW, Thabit H, Caldwell K, Allen JM, Kumareswaran K, Wilinska ME, Nodale M, Mangat J, Evans ML, Burnstein R, Hovorka R. Feasibility of fully automated closed-loop glucose control using continuous subcutaneous glucose measurements in critical illness: a randomized controlled trial. Critical Care 2013; 17:R159
  91. Evans K, Green E, Hudson B, Stewart M, Evans M, Gregory R, Wilmot E, Soloman A, Karamat M, Narendran P. Clinical Guideline: Guidelines for managing continuous subcutaneous insulin infusion (CSII, or 'insulin pump') therapy in hospitalised patients. 2019; https://abcd.care/sites/abcd.care/files/CSII_DTN_FINAL%20210218.pdf.
  92. Wang M, Singh LG, Spanakis EK. Advancing the use of CGM devices in a non-ICU setting. Journal of Diabetes Science and Technology 2019; 13:674-681
  93. Lazar HL, McDonnell M, Chipkin SR, Furnary AP, Engelman RM, Sadhu AR, Bridges CR, Haan CK, Svedjeholm R, Taegtmeyer H, Shemin RJ. The Society of Thoracic Surgeons Practice Guideline Series: Blood glucose management during adult cardiac surgery. Annals of Thoracic Surgery 2009; 87:663-669
  94. Group JBDSIC. Guidelines for the management of inpatient diabetes. 2019; https://abcd.care/joint-british-diabetes-societies-jbds-inpatient-care-group.
  95. UK D. End of life diabetes care. 2018; https://www.diabetes.org.uk/resources-s3/2018-03/EoL_Guidance_2018_Final.pdf.
  96. Van den Berghe G, Wouters P, Weekers F, Verwaest C, Bruyninckx F, Schetz M, Vlasselaers D, Ferdinande P, Bouillon R, Lauwers P. Intensive insulin therapy in critically ill patients. New England Journal of Medicine 2001; 345:1359-1367
  97. Van den Berghe G, Wilmer A, Hermans G, Meersseman W, Wouters PJ, Milants I, Van Wijngaerden E, Bobbaers H, Bouillon R. Intensive insulin therapy in the medical ICU. New England Journal of Medicine 2006; 354:449-461
  98. Brunkhorst FM, Engel C, Bloos F, Meier-Hellmann A, Ragaller M, Weiler N, Moerer O, Gruendling M, Oppert M, Grond S, Olthoff D, Jaschinski U, John S, Rossaint R, Welte T, Schaefer M, Kern P, Kuhnt E, Kiehntopf M, Hartog C, Natanson C, Loeffler M, Reinhart K. Intensive insulin therapy and pentastarch resuscitation in severe sepsis. New England Journal of Medicine 2008; 358:125-139
  99. De La Rosa G, Donado JH, Restrepo AH, Quintero AM, Gonzalez LG, Saldarriaga NE, Bedoya M, Toro JM, Velasquez JB, Valencia JC, Arango CM, Aleman PH, VAsquez EM, Chavarriaga JC, Yepes A, Pulido W, Cadavid CA. Strict glycaemic control in patients hospitalised in a mixed medical and surgical intensive care unit: a randomised clinical trial. Critical Care 2008; 12:R120
  100. Preiser J-C, Brunkhorst F. Tight glucose control and hypoglycemia. Critical Care Medicine 2008; 36:1391-1392
  101. Hall L, Fisher M. Aspirin for primary prevention in diabetes? Practical Diabetes International 2009; 26:6-8
  102. Marik PE. Tight glycemic control in acutely ill patients: low evidence of benefit, high evidence of harm! Intensive Care Medicine 2016; 42:1475-1477
  103. Preiser J-C, Devos P, Ruiz-Santana S, Melot C, Annane D, Groeneveld J, Iapichino G, Leverve XM, Nitenberg G, Singer P, Wernerman J, Joannidis M, Stecher A, Chiolero R. A prospective randomised multi-centre controlled trial on tight glucose control by intensive insulin therapy in adult intensive care units: the Glucontrol study. Intensive Care Medicine 2009; 35:1738-1748
  104. Malmberg KA, Efendic S, Ryden LE. Feasibility of insulin-glucose infusion in diabetic patients with acute myocardial infarction: A report from the multicenter trial: DIGAMI. Diabetes Care 1994; 17:1007-1014
  105. Lazar HL, Chipkin SR, Fitzgerald CA, Bao Y, Cabral H, Apstein CS. Tight glycemic control in diabetic coronary artery bypass graft patients improves perioperative outcomes and decreases recurrent ischemic events. Circulation 2004; 109:1497-1502
  106. Gandhi GY, Nuttall GA, Abel MD, Mullany CJ, Schaff HV, O'Brien PC, Johnson MG, Williams AR, Cutshall SM, Mundy LM, Rizza RA, McMahon MM. Intensive intraoperative insulin therapy versus conventional glucose management during cardiac surgery: A randomized trial. Annals of Internal Medicine 2007; 146:233-243
  107. Agus MS, Steil GM, Wypij D, Costello JM, Laussen PC, Langer M, Alexander JL, Scoppettuolo LA, Pigula FA, Charpie JR, Ohye RG, Gaies MG. Tight glycemic control versus standard care after pediatric cardiac surgery. New England Journal of Medicine 2012; 367:1208-1219
  108. Agus MS, Wypij D, Hirshberg EL, Srinivasan V, Faustino EV, Luckett PM, Alexander JL, Asaro LA, Curley MA, Steil GM, Nadkarni VM. Tight glycemic control in critically ill children. New England Journal of Medicine 2017; 376:729-741
  109. Macrae D, Grieve R, Allen E, Sadique Z, Morris K, Pappachan J, Parslow R, Tasker RC, Elbourne D. A randomized trial of hyperglycemic control in pediatric intensive care. New England Journal of Medicine 2014; 370:107-118
  110. Kalfon P, Giraudeau B, Ichai C, Guerrini A, Brechot N, Cinotti R, Dequin P-F, Riu-Poulenc B, Montravers P, Annane D, Dupont H, Sorine M, Riou B. Tight computerized versus conventional glucose control in the ICU: a randomized controlled trial. Intensive Care Medicine 2014; 40:171-181
  111. Cinotti R, Ichai C, Orban JC, Kalfon P, Feuillet F, Roquilly A, Riou B, Blanloeil Y, Asehnoune K, Rozec B. Effects of tight computerized glucose control on neurological outcome in severely brain injured patients: A multicenter sub-group analysis of the randomized-controlled open-label CGAO-REA study. Critical Care 2014; 18:498
  112. Okabayashi T, Shima Y, Sumiyoshi T, Kozuki A, Tokumaru T, Iiyama T, Sugimoto T, Kobayashi M, Yokoyama M, Hanazaki K. Intensive versus intermediate glucose control in surgical intensive care unit patients. Diabetes Care 2014; 37:1516
  113. Cardona S, Pasquel FJ, Fayfman M, Peng L, Jacobs S, Vellanki P, Weaver J, Halkos M, Guyton RA, Thourani VH, Umpierrez GE. Hospitalization costs and clinical outcomes in CABG patients treated with intensive insulin therapy. Journal of Diabetes and its Complications 2017; 31:742-747
  114. Dhatariya K. Should inpatient hyperglycaemia be treated? British Medical Journal 2013; 346:f134
  115. Phillips VL, Byrd AL, Adeel S, Peng L, Smiley DD, Umpierrez GE. A comparison of inpatient cost per day in general surgery patients with type 2 diabetes treated with basal-bolus versus sliding scale insulin regimens. PharmacoEconomics - Open 2017; 1:109-115
  116. Cryer PE, Axelrod L, Grossman AB, Heller SR, Montori VM, Seaquist ER, Service FJ. Evaluation and management of adult hypoglycemic disorders: An Endocrine Society clinical practice guideline. Journal of Clinical Endocrinology & Metabolism 2009; 94:709-728
  117. Seaquist ER, Anderson J, Childs B, Cryer P, Dagogo-Jack S, Fish L, Heller SR, Rodriguez H, Rosenzweig J, Vigersky R. Hypoglycemia and diabetes: A report of a workgroup of the American Diabetes Association and The Endocrine Society. Diabetes Care 2013; 36:1384-1395
  118. Krikorian A, Ismail-Beigi F, Moghissi ES. Comparisons of different insulin infusion protocols: a review of recent literature. Current Opinion in Clinical Nutrition & Metabolic Care 2010; 13:198-204
  119. Umpierrez GE, Smiley D, Zisman A, Prieto LM, Palacio A, Ceron M, Puig A, Mejia R. Randomized study of basal-bolus insulin therapy in the inpatient management of patients with type 2 diabetes (RABBIT 2 trial). Diabetes Care 2007; 30:2181-2186
  120. Rajendran R, Kerry C, Rayman G, group obotMs. Temporal patterns of hypoglycaemia and burden of sulfonylurea-related hypoglycaemia in UK hospitals: a retrospective multicentre audit of hospitalised patients with diabetes. BMJ Open 2014; 4
  121. Digital N. National Diabetes Inpatient Audit (NaDIA) - 2017. 2018; https://digital.nhs.uk/data-and-information/publications/statistical/national-diabetes-inpatient-audit/national-diabetes-inpatient-audit-nadia-2017.
  122. Krinsley JS, Grover A. Severe hypoglycemia in critically ill patients: Risk factors and outcomes. Critical Care Medicine 2007; 35:2262-2267
  123. Kagansky N, Levy S, Rimon E. Hypoglycemia as a predictor of mortality in hospitalized elderly patients. Archives of Internal Medicine 2003; 163:1825-1829
  124. Stanisstreet D, Walden E, Jones C, Graveling A, Amiel SA, Crowley C, Dhatariya K, Frier B, Malik R. The hospital management of hypoglycaemia in adults with diabetes mellitus. 2020. https://abcd.care/resource/hospital-management-hypoglycaemia-adults-diabetes.
  125. Smith WD, Winterstein AG, Johns T, Rosenberg E, Sauer BC. Causes of hyperglycemia and hypoglycemia in adult inpatients. American Journal of Health-System Pharmacy 2005; 62:714-719
  126. Maynard G, Lee J, Phillips G, Fink E, Renvall M. Improved inpatient use of basal insulin, reduced hypoglycemia, and improved glycemic control: Effect of structured subcutaneous insulin orders and an insulin management algorithm. Journal of Hospital Medicine 2009; 4:3-15
  127. Agency NPS. Insulin safety. Reducing harm associated with the unsafe use of insulin products. 2010; http://www.patientsafetyfirst.nhs.uk/Content.aspx?path=/interventions/relatedprogrammes/medicationsafety/insulin/
  128. Dendy J, Chockalingam V, Tirumalasetty N, Dornelles A, Blonde L, Bolton P, Meadows R, Andrews S. Identifying risk factors for severe hypoglycemia in hospitalized patients with diabetes. Endocrine Practice 2014; 20:1051-1056
  129. Lake A, Arthur A, Byrne C, Davenport K, Yamamoto JM, Murphy HR. The effect of hypoglycaemia during hospital admission on health-related outcomes for people with diabetes: a systematic review and meta-analysis. Diabetic Medicine 2019; 36:1349-1359
  130. Griesdale DE, de Souza RJ, van Dam RM, Heyland DK, Cook DJ, Malhotra A, Dhaliwal R, Henderson WR, Chittock DR, Finfer S, Talmor D. Intensive insulin therapy and mortality among critically ill patients: a meta-analysis including NICE-SUGAR study data. Canadian Medical Association Journal 2009; 180:821-827
  131. Zoungas S, Patel A, Chalmers J, de Galan BE, Li Q, Billot L, Woodward M, Ninomiya T, Neal B, MacMahon S, Grobbee DE, Kengne AP, Marre M, Heller S. Severe hypoglycemia and risks of vascular events and death. New England Journal of Medicine 2010; 363:1410-1418
  132. Wiener RS, Wiener DC, Larson RJ. Benefits and risks of tight glucose control in critically ill adults: A meta-analysis. JAMA 2008; 300:933-944
  133. Kosiborod M, Inzucchi S, Goyal A, Krumholz HM, Masoudi FA, Xiao L, Spertus JA. Relationship between spontaneous and iatrogenic hypoglycemia and mortality in patients hospitalized with acute myocardial infarction. JAMA 2009; 301:1556-1564
  134. Arabi YM, Tamin HM, Rishu AH. Hypoglycemia with intensive insulin therapy in critically ill patients: Predisposing factors and association with mortality. Critical Care Medicine 2009; 37:2536-2544
  135. Vriesendorp TM, DeVries JH, van Santen S, Moeniralam HS, de Jong E, Roos YB, Schultz MJ, Rosendaal FR, Hoekstra JB. Evaluation of short-term consequences of hypoglycemia in an intensive care unit. Critical Care Medicine 2006; 34:2714-2718
  136. Krinsley JS, Schultz MJ, Spronk PE, Harmsen RE, van Braam Houckgeest F, van der Sluijs JP, Melot C, Preiser JC. Mild hypoglycemia is independently associated with increased mortality in the critically ill. Critical Care 2011; 15:R173
  137. Digital N. National Diabetes Inpatient Audit (NaDIA) - 2016. 2017; http://www.content.digital.nhs.uk/catalogue/PUB23539.
  138. Dashora U, Sampson M, Castro E, Stanisstreet D, Hillson R. The best hypoglycaemia avoidance initiative in the UK. British Journal of Diabetes 2017; 17:74-77
  139. Gomez AM, Umpierrez GE. Continuous glucose monitoring in insulin-treated patients in non-ICU settings. Journal of Diabetes Science and Technology 2014; 8:930-936
  140. Cardona S, Gomez PC, Vellanki P, Anzola I, Ramos C, Urrutia MA, Haw JS, Fayfman M, Wang H, Galindo RJ, Pasquel FJ, Umpierrez GE. Clinical characteristics and outcomes of symptomatic and asymptomatic hypoglycemia in hospitalized patients with diabetes. BMJ Open Diabetes Research & Care 2018; 6:e000607
  141. Gill GV, Woodward A, Casson IF, Weston PJ. Cardiac arrhythmia and nocturnal hypoglycaemia in type 1 diabetes—the 'dead in bed' syndrome revisited. Diabetologia 2009; 52:42-45
  142. Desouza C, Salazar H, Cheong B, Murgo J, Fonseca V. Association of hypoglycemia and cardiac ischemia. Diabetes Care 2003; 26:1485-1489
  143. Petersen KG, Schluter KJ, Kerp L. Regulation of serum potassium during insulin-induced hypoglycemia. Diabetes 1982; 31:615-617
  144. Razavi Nematollahi L, Kitabchi AE, Stentz FB, Wan JY, Larijani BA, Tehrani MM, Gozashti MH, Omidfar K, Taheri E. Proinflammatory cytokines in response to insulin-induced hypoglycemic stress in healthy subjects. Metabolism - Clinical and Experimental 2009; 58:443-448
  145. Desouza CV, Bolli GB, Fonseca V. Hypoglycemia, diabetes, and cardiovascular events. Diabetes Care 2010; 33:1389-1394
  146. Wright RJ, Newby DE, Stirling D, Ludlam CA, Macdonald IA, Frier BM. Effects of acute insulin-induced hypoglycemia on indices of inflammation. Diabetes Care 2010; 33:1591-1597
  147. Rana OA, Byrne CD, Greaves K. Intensive glucose control and hypoglycaemia: a new cardiovascular risk factor? Heart 2014; 100:21-27
  148. Boucai L, Southern WN, Zonszein J. Hypoglycemia-associated mortality is not drug-associated but linked to comorbidities. American Journal of Medicine 2011; 124:1028-1035
  149. George JT, Warriner D, McGrane DJ, Rozario KS, Price HC, Wilmot EG, Kar P, Stratton IM, Jude EB, McKay GA, Team obotTDS. Lack of confidence among trainee doctors in the management of diabetes: the Trainees Own Perception of Delivery of Care (TOPDOC) Diabetes Study. QJM 2011; 104:761-766
  150. Horton WB, Law S, Darji M, Conaway MR, Akbashev MY, Kubiak NT, Kirby JL, Thigpen SC. A multicenter study evaluating perceptions and knowledge of inpatient glycemic control among resident physicians: analyzing themes to inform and improve care. Endocrine Practice 2019; 25:1295-1303
  151. Brown G, Dodek P. Intravenous insulin nomogram improves blood glucose control in the critically ill. Critical Care Medicine 2001; 29:1714-1719
  152. Rea RS, Donihi AC, Bobeck M, Herout P, McKaveney TP, Kane-Gill SL, Korytkowski MT. Implementing an intravenous insulin infusion protocol in the intensive care unit. American Journal of Health-System Pharmacy 2007; 64:385-395
  153. Umpierrez GE, Kelly JP, Navarrete JE, Casals MM, Kitabchi AE. Hyperglycemic crises in urban blacks. Archives of Internal Medicine 1997; 157:669-675
  154. George S, Dale J, Stanisstreet D. A guideline for the use of variable rate intravenous insulin infusion in medical inpatients. Diabetic Medicine 2015; 32:706-713
  155. Miller EE, Lalla M, Zaidi A, Elgash M, Zhao H, Rubin DJ. Eating and glycemic control among critically ill patients receiving continuous intravenous insulin. Endocrine Practice 2020; 26:43-50
  156. Salinas PD, Mendez CE. Glucose management technologies for the critically ill. Journal of Diabetes Science and Technology 2019; 13:682-690
  157. Newton CA, Smiley D, Bode BW, Kitabchi AE, Davidson PC, Jacobs S, Steed RD, Stentz F, Peng L, Mulligan P, Freire AX, Temponi A, Umpierrez GE. A comparison study of continuous insulin infusion protocols in the medical intensive care unit: Computer-guided vs. standard column-based algorithms. Journal of Hospital Medicine 2010; 5:432-437
  158. Ullal J, Aloi JA. Subcutaneous insulin dosing calculators for inpatient glucose control. Current Diabetes Reports 2019; 19:120
  159. Bouw JW, Campbell N, Hull MA, Juneja R, Guzman O, Overholser BR. A retrospective cohort study of a nurse-driven computerized insulin infusion program versus a paper-based protocol in critically ill patients. Diabetes Technology & Therapeutics 2012; 14:125-130
  160. Juneja R, Roudebush C, Kumar N, Macy A, Golas A, Wall D, Wolverton C, Nelson D, Carroll J, Flanders SJ. Utilization of a computerized intravenous insulin infusion program to control blood glucose in the intensive care unit. Diabetes Technology & Therapeutics 2007; 9:232-240
  161. Marvin MR, Inzucchi SE, Besterman BJ. Computerization of the Yale insulin infusion protocol and potential insights into causes of hypoglycemia with intravenous insulin. Diabetes Technology & Therapeutics 2013; 15:246-252
  162. Goldberg PA, Siegel MD, Sherwin RS, Halickman JI, Lee M, Bailey VA, Lee SL, Dziura JD, Inzucchi SE. Implementation of a safe and effective insulin infusion protocol in a medical intensive care unit. Diabetes Care 2004; 27:461-467
  163. Boutin JM, Gauthier L. Insulin infusion therapy in critically ill patients. Canadian Journal of Diabetes 2014; 38:144-150
  164. DeSantis AJ, Schmeltz LR, Schmidt K, O'Shea-Mahler E, Rhee C, Wells A, Brandt S, Peterson S, Molitch ME. Inpatient management of hyperglycemia: The Northwestern experience. Endocrine Practice 2006; 12:491-505
  165. Davidson PC, Steed RD, Bode BW. Glucommander. A computer-directed intravenous insulin system shown to be safe, simple, and effective in 120,618 h of operation. Diabetes Care 2005; 28:2418-2423
  166. Hirsch IB. Sliding scale insulin--time to stop sliding. JAMA 2009; 301:213-214
  167. Umpierrez GE, Maynard G. Glycemic chaos (not glycemic control) still the rule for inpatient care. How do we stop the insanity? Journal of Hospital Medicine 2006; 1:141-144
  168. Swan E, Dhatariya K. Differential effects of intravenous and subcutaneous sliding scale insulin regimes used to improve blood glucose levels in a tertiary care setting. Practical Diabetes International 2009; 26:2i
  169. King AB, Armstrong DU. Basal bolus dosing: A clinical experience. Current Diabetes Reviews 2005; 1:215-220
  170. Umpierrez GE, Hor T, Smiley D, Temponi A, Umpierrez D, Ceron M, Munoz C, Newton C, Peng L, Baldwin D. Comparison of inpatient insulin regimens with detemir plus aspart versus neutral protamine hagedorn plus regular in medical patients with type 2 diabetes. Journal of Clinical Endocrinology Metabolism 2009; 94:564-569
  171. Umpierrez GE, Smiley D, Hermayer K, Khan A, Olson DE, Newton C, Jacobs S, Rizzo M, Peng L, Reyes D, Pinzon I, Fereira ME, Hunt V, Gore A, Toyoshima MT, Fonseca VA. Randomized study comparing a basal-bolus with a basal plus correction insulin regimen for the hospital management of medical and surgical patients with type 2 diabetes: Basal plus trial. Diabetes Care 2013; 36:2169-2174
  172. Pietras S, Hanrahan P, Arnold L, Sternthal E, McDonnell M. State-of-the-art inpatient diabetes care: The evolution of an academic hospital. Endocrine Practice 2010; 16:512-521
  173. Clement S, Bowen-Wright H. Twenty-four hour action of insulin glargine (Lantus) may be too short for once-daily dosing: A case report. Diabetes Care 2002; 25:1479-1147a
  174. Rubin DJ, Rybin D, Doros G, McDonnell ME. Weight-based, insulin dose-related hypoglycemia in hospitalized patients with diabetes. Diabetes Care 2011; 34:1723-1728
  175. Nesto RW, Bell D, Bonow RO, Fonseca V, Grundy SM, Horton ES, Le Winter M, Porte D, Semenkovich CF, Smith S, Young LH, Kahn R. Thiazolidinedione use, fluid retention, and congestive heart failure. Diabetes Care 2004; 27:256-263
  176. Willi SM, Kennedy A, Brant BP, Wallace P, Rogers NL, Garvey WT. Effective use of thiazolidinediones for the treatment of glucocorticoid-induced diabetes. Diabetes Research & Clinical Practice 2002; 58:87-96
  177. Roberts A, James J, Dhatariya K, Care oBotJBDSJfI. Management of hyperglycaemia and steroid (glucocorticoid) therapy: a guideline from the Joint British Diabetes Societies (JBDS) for Inpatient Care group. Diabetic Medicine 2018; 35:1011-1017
  178. Nirantharakumar K, Marshall T, Kennedy A, Hemming K, Coleman JJ. Hypoglycaemia is associated with increased length of stay and mortality in people with diabetes who are hospitalized. Diabetic Medicine 2012; 29:e445-e448
  179. Roumie CL, Greevy RA, Grijalva CG, Hung AM, Liu X, Murff HJ, Elasy TA, Griffin MR. Association between intensification of metformin treatment with insulin vs sulfonylureas and cardiovascular events and all-cause mortality among patients with diabetes. JAMA 2014; 311:2288-2296
  180. Gerards MC, Venema GE, Patberg KW, Kross M, Potter van Loon BJ, Hageman IM, Snijders D, Brandjes DP, Hoekstra JB, Vriesendorp TM, Gerdes VE. Dapagliflozin for prednisone-induced hyperglycemia in acute exacerbation of chronic obstructive pulmonary disease. Diabetes, Obesity and Metabolism 2018; 20:1306-1310
  181. Umpierrez GE, Gianchandani R, Smiley D, Wesorick DH, Newton C, Farrokhi F, Peng L, Lathkar-Pradhan S, Pasquel F. Safety and efficacy of sitagliptin therapy for the inpatient management of general medicine and surgery patients with type 2 diabetes: A pilot, randomized, controlled study. Diabetes Care 2013; 36:3430-3435
  182. Pasquel FJ, Gianchandani R, Rubin DJ, Dungan KM, Anzola I, Gomez PC, Peng L, Hodish I, Bodnar T, Wesorick D, Balakrishnan V, Osei K, Umpierrez GE. Efficacy of sitagliptin for the hospital management of general medicine and surgery patients with type 2 diabetes (Sita-Hospital): a multicentre, prospective, open-label, non-inferiority randomised trial. Lancet Diabetes and Endocrinology 2017; 5:125-133
  183. Lorenzo-Gonzalez C, Atienza-Sanchez E, Reyes-Umpierrez D, Vellanki P, Davis GM, Pasquel FJ, Cardona S, Fayman M, Peng L, Umpierrez GE. Safety and efficacy of DDP-4 inhibitors for management of hospitalized general medicine and surgery patients with type 2 diabetes. Endocrine Practice 2020; 26:722-728
  184. Rice MJ, Smith JL, Coursin DB. Glucose measurement in the ICU: Regulatory intersects reality. Critical Care Medicine 2017; 45:741-743
  185. Pilackas K, El-Oshar S, Carter C. Clinical reliability of point-of-care glucose testing in critically ill patients. Journal of Diabetes Science and Technology 2020; 14:65-69
  186. Gomez AM, Umpierrez GE, Munoz OM, Herrera F, Rubio C, Aschner P, Buendia R. Continuous glucose monitoring versus capillary point-of-care testing for inpatient glycemic control in type 2 diabetes patients hospitalized in the general ward and treated with a basal bolus insulin regimen. Journal of Diabetes Science and Technology 2016; 10:325-329
  187. Schaupp L, Donsa K, Neubauer KM, Mader JK, Aberer F, Holl B, Spat S, Augustin T, Beck P, Pieber TR, Plank J. Taking a closer look: Continuous glucose monitoring in non-critically ill hospitalized patients with type 2 diabetes mellitus under basal-bolus insulin therapy. Diabetes Technology & Therapeutics 2015; 17:611-618
  188. Davis GM, Galindo RJ, Migdal AL, Umpierrez GE. Diabetes technology in the inpatient setting for management of hyperglycemia. Endocrinology and Metabolism Clinics 2020; 49:79-93
  189. Galindo RJ, Migdal AL, Davis GM, Urrutia MA, Albury B, Zambrano C, Vellanki P, Pasquel FJ, Fayfman M, Peng L, Umpierrez GE. Comparison of the FreeStyle Libre Pro flash continuous glucose monitoring (CGM) system and point-of-care capillary glucose testing (POC) in hospitalized patients with type 2 diabetes (T2D) treated with basal-bolus insulin regimen. Diabetes Care 2020; 43:2730-2735
  190. Singh LG, Satyarengga M, Marcano I, Scott WH, Pinault LF, Feng Z, Sorkin JD, Umpierrez GE, Spanakis EK. Reducing inpatient hypoglycemia in the general wards using real-time continuous glucose monitoring: The glucose telemetry system, a randomized clinical trial. Diabetes Care 2020; 43:2736-2743
  191. Gosmanov AR, Umpierrez GE. Medical nutrition therapy in hospitalized patients with diabetes. Current Diabetes Reports 2012; 12:93-100
  192. McMahon MM, Nystrom E, Braunschweig C, Miles J, Compher C, Nutrition ASfPaE. A.S.P.E.N. clinical guidelines: Nutrition support of adult patients with hyperglycemia. Journal of Parenteral and Enteral Nutrition 2013; 37:23-36
  193. Roberts AW, Penfold S, Care obotJBDSJfI. Glycaemic management during the inpatient enteral feeding of people with stroke and diabetes. Diabetic Medicine 2018; 35:1027-1036
  194. Schafer RG, Bohannon B, Franz M, Freeman J, Holmes A, McLaughlin S, Haas LB, Kruger DF, Lorenz RA, McMahon MM. Translation of the diabetes nutrition recommendations for health care institutions. Diabetes Care 1997; 20:96-105
  195. McMahon MM, Rizza RA. Nutrition support in hospitalized patients with diabetes mellitus. Mayo Clinic Proceedings 1996; 71:587-594
  196. Singer P, Blaser AR, Berger MM, Alhazzani W, Calder PC, Casaer MP, Hiesmayr M, Mayer K, Montejo JC, Pichard C, Preiser J-C, van Zanten AR, Oczkowski S, Szczeklik W, Bischoff SC. ESPEN guideline on clinical nutrition in the intensive care unit. Clinical Nutrition 2019; 38:48-79
  197. Via MA, Mechanick JI. Inpatient enteral and parental nutrition for patients with diabetes. Current Diabetes Reports 2011; 11:99-105
  198. Elia M, Ceriello A, Laube H, Sinclair AJ, Engfer M, Stratton RJ. Enteral nutritional support and use of diabetes-specific formulas for patients with diabetes: A systematic review and meta-analysis. Diabetes Care 2005; 28:2267-2279
  199. Narwani V, Swafe L, Stavraka C, Dhatariya K. How frequently are bedside glucose levels measured in hospital inpatients on glucocorticoids? Clinical Medicine 2014; 14:327-328
  200. Sudlow A, O'Connor HM, Narwani V, Swafe L, Dhatariya K. Assessing the prevalence of dexamethasone use in patients undergoing surgery, and subsequent glucose measurements: a retrospective cohort study. Practical Diabetes 2017; 34:117-121
  201. Yatabe T, Yamazaki R, Kitagawa H, Okabayashi T, Yamashita K, Hanazaki K, Yokoama M. The evaluation of the ability of closed-loop glycemic control device to maintain the blood glucose concentration in intensive care unit patients. Critical Care Medicine 2011; 39:575-578
  202. Levitt DL, Spanakis EK, Ryan KA, Silver KD. Insulin pump and continuous glucose monitor initiation in hospitalized patients with type 2 diabetes mellitus. Diabetes Technology & Therapeutics 2018; 20:32-38
  203. Bally L, Thabit H, Hartnell S, Andereggen E, Ruan Y, Wilinska ME, Evans ML, Wertli MM, Coll AP, Stettler C, Hovorka R. Closed-loop insulin delivery for glycemic control in noncritical care. New England Journal of Medicine 2018; 379:547-556
  204. Thabit H, Hartnell S, Allen JM, Lake A, Wilinska ME, Ruan Y, Evans ML, Coll AP, Hovorka R. Closed-loop insulin delivery in inpatients with type 2 diabetes: a randomised, parallel-group trial. Lancet Diabetes & Endocrinology 2020; 5:117-124
  205. Boughton CK, Bally L, Martignoni F, Hartnell S, Herzig D, Vogt A, Wertli MM, Wilinska ME, Evans ML, Coll AP, Stettler C, Hovorka R. Fully closed-loop insulin delivery in inpatients receiving nutritional support: a two-centre, open-label, randomised controlled trial. Lancet Diabetes & Endocrinology 2019; 7:368-377