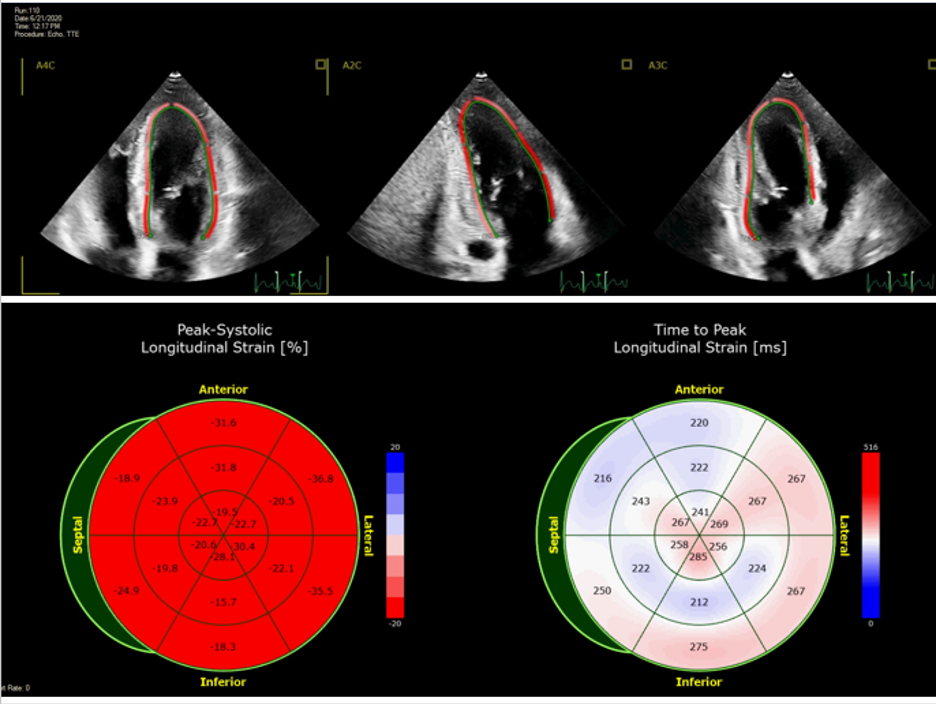
Figure 4. Global longitudinal strain by speckle tracking echocardiography. Assessment of global longitudinal strain (GLS) in a healthy, asymptomatic individual with a GLS of -25%. The top row displays regional strain map superimposed on the grayscale two-dimensional echocardiographic images in apical four-chamber (A4C), apical two-chamber (A2C), and apical three-chamber (A3C) views. The bottom left bullseye displays regional longitudinal strain for each segment of a 16-segment model of the left ventricle. Bright red denotes to most negative normal values of GLS. The bottom right bullseye displays the time (ms) between aortic valve opening and peak longitudinal strain, a measure of dyssynchrony, for each segment.