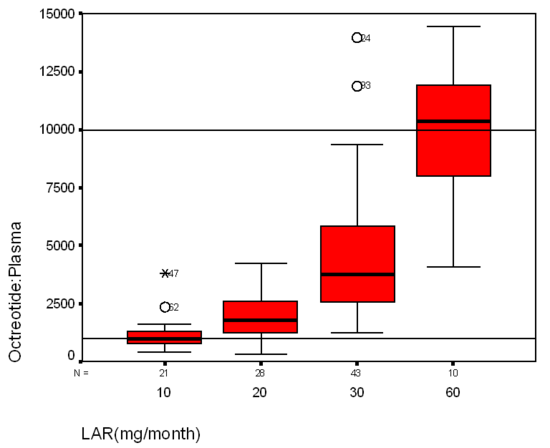
Figure 50. This figure represents the range of plasma octreotide levels versus the monthly dosage of LAR for the combined Novartis and ISI data. The dark line on each box-plot represents the median of the range, whereas the bottom and top of the solid box represents the 25th and 75th percentile of the plasma levels. The 2 reference lines are drawn at the Kd and saturation levels of the sst 2 receptor. Only the 60 mg/mo LAR dose covers the concentrations that would saturate sst 2 . Circles and asterisks with values represent data that is out of range(16,112).