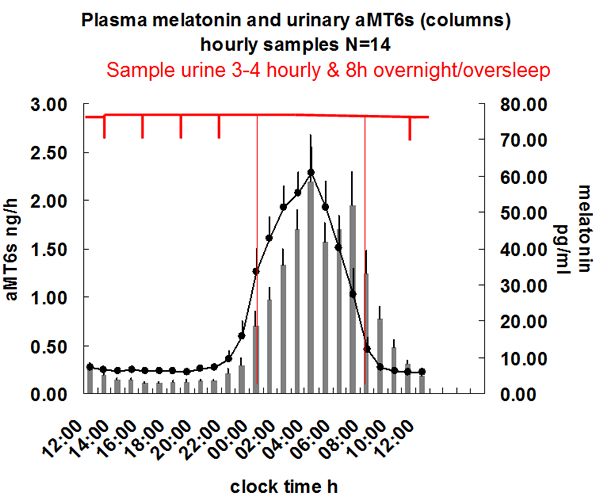
Figure 3b.Plasma melatonin and urin ary aMT6s in hourly samples, mean ” SEM, N=14, to show the delay in the rhythm of aMT6s compared to melatonin. If urine is sampled 3-4 hourly with an over-sleep collection as shown, a close correlation with plasma melatonin amplitude and phase is found. Drawn from data in reference 105.