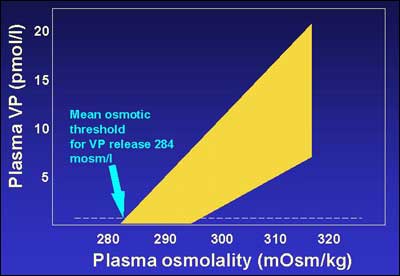
Figure 6.The relationship of plasma VP concentration to changes in plasma osmolality during controlled hypertonic stimulation. VP concentration determined during progressive hypertonicity induced by infusion of 855 mmol/l saline in a group of healthy adults. Increases in plasma osmolality increase plasma VP concentrations in a linear manner, defined by the function, plasma VP = 0.43 (plasma osmolality – 284), r = +0.96. The abscissal intercept of this regression line indicates the mean ‘osmotic threshold’ for VP release: the mean plasma osmolality above which plasma VP starts to increase. The shaded area represents the range of normal response. LD represents the limit of detection of the assay, 0.3 pmol/l.