The best Clinical Endocrinology source in the world, and FREE.

Endotext requires free registration
Login or Register

Menu

Skip to content
  • Home / Sections
  • Clinical Guidelines
  • Webinar Case Studies
  • Editorial Team
  • Country Associates
  • About
  • Instructions for Authors

figure10

Published May 16, 2013 at 400 × 285 in The Neurohypophysis: Endocrinology of Vasopressin and Oxytocin.
← Previous Next →

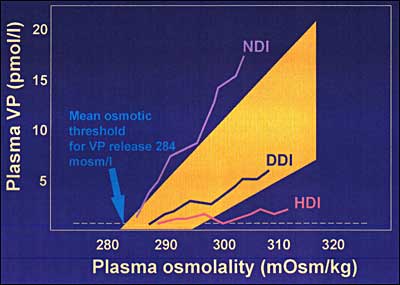
Figure 10.The relationship of plasma VP concentration to changes in plasma osmolality during controlled hypertonic stimulation in diabetes insipidus. Measurement of plasma VP during controlled hypertonic stress testing can effectively differentiate between HDI, NDI and DDI.

  • Agreement on Use
  • Supporters
  • Donations
  • Privacy Policy
  • Instructions for Authors (5/03/23)

Copyright © 2000-2025, MDText.com, Inc. All rights reserved.