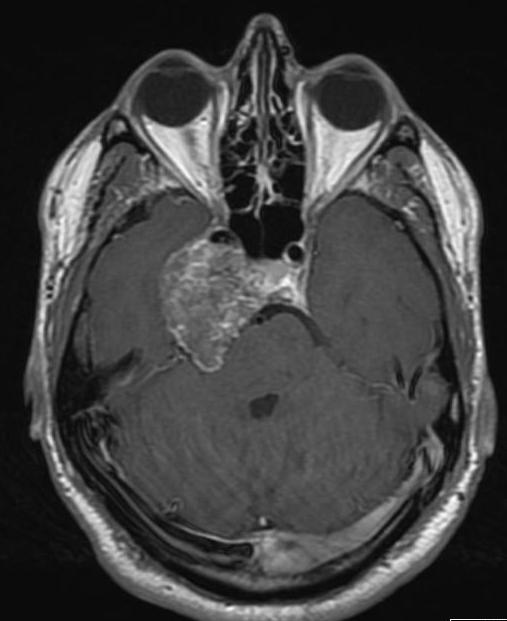
Figure 27B:Axial T2 (A) and axial enhanced T1 weighted (B) images of a chondrosarcoma. This shows the typical bubbly high T2 signal and involves the right side of the pituitary fossa , the Rt cavernous sinus and extends into the Rt middle cranial fossa.