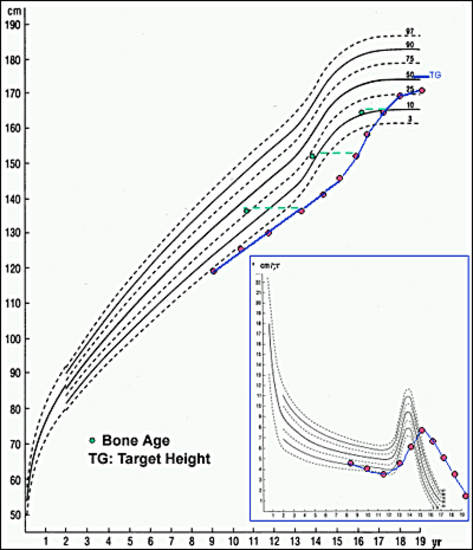
Figure 7.Growth curve of a boy with constitutional delay showing slower growth in the peripubertal time and then achievement of the normal range by the end of the growth process. The growth velocity curve is shown with a more attenuated and lower increase at puberty.