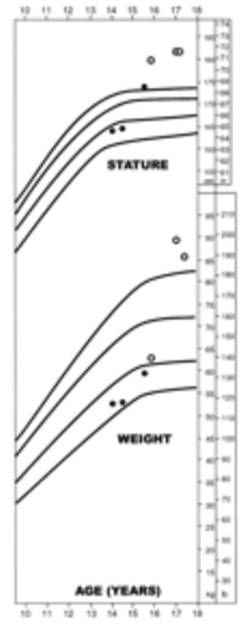
Figure 14a. The patient’s growth and weight chart with normal growth and weight curves (solid lines, 5th, 50th, 75th, and 95th percentile). (i) Measurements subsequent to therapeutic intervention. Reproduced from Maheshwari HG, Prezant TR, Herman-Bonert V, Shahinian H, Kovacs K, Melmed S. Long-acting peptidomimergic control of gigantism caused by pituitary acidophilic stem cell adenoma J. Clin. Endocrinol. Metab. 2000 85: 3409-3416, with permission.