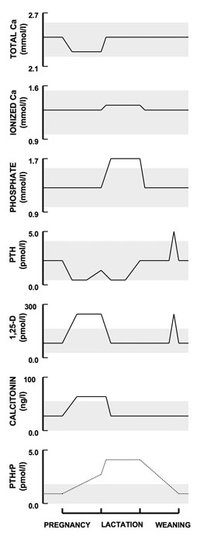
Figure 2. Schematic illustration of the longitudinal changes in calcium, phosphate, and calciotropic hormone levels that occur during pregnancy and lactation. Normal adult ranges are indicated by the shaded areas. The progression in PTHrP levels has been depicted by a dashed line to reflect that the data is less complete; the implied comparison of PTHrP levels in late pregnancy and lactation are uncertain extrapolations because no reports followed patients serially. In both situations PTHrP levels are elevated. Adapted from ref. ( 1 ), © 1997, The Endocrine Society.