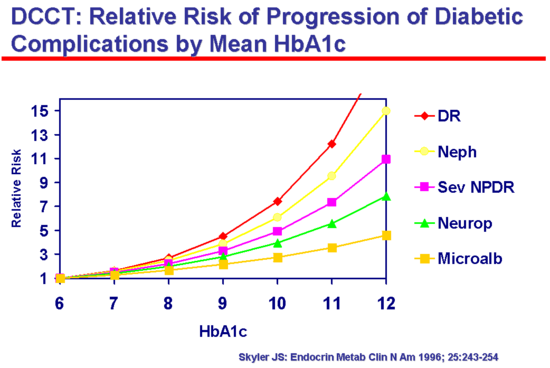
Figure 2. Relationship between microvascular complications and A1c in type 1 diabetes. Stylized relative risks for development of various complications as a function of mean A1c during follow-up in the DCCT. For the purposes of illustration, the relative risk of various complications is set to 1 at A1c of 6%. The lines depict a stylized relationship for risk of: (A) sustained progression of retinopathy (u), (B) progression to clinical nephropathy (urinary albumin excretion > 300 mg/24 hrs) (), (C) progression to severe non-proliferative or proliferative retinopathy (¢), (D) progression to clinical neuropathy (), and (E) progression to microalbuminuria (urinary albumin excretion > 40 mg/24 hrs) (£). Adapted from: Skyler JS: Diabetic Complications: Glucose Control Is Important. Endocrinology and Metabolism Clinics of North America 1996; 25:243-254.