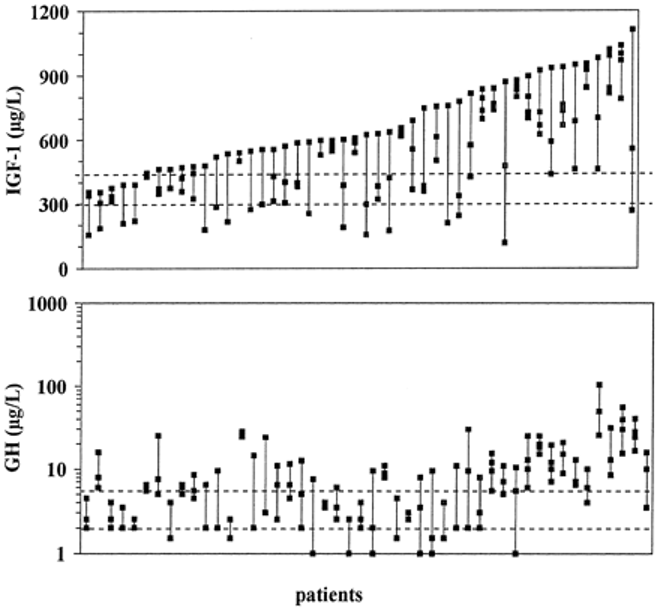
Fig 8. Plasma IGF-1 and GH responses to dopamine agonist suppressive therapy in patients with pure GH secreting tumors. The upper squares indicate the pretreatment levels and lower squares correspond to the concentrations obtained by progressively increasing the weekly dose of cabergoline i.e., 1.0, 1.75, and 3.5 mg, respectively. Note the log scale for GH.