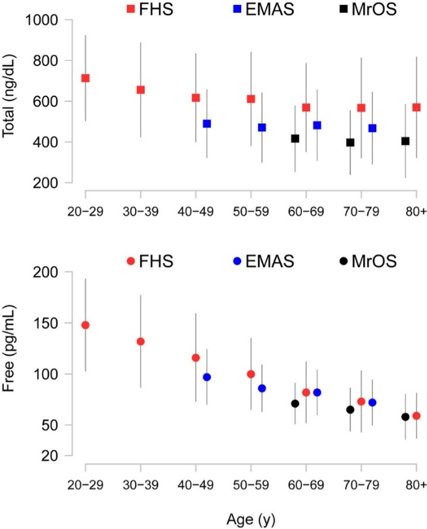
Figure 1. The distribution of total and free testosterone levels by decades of age in male participants of the Framingham Heart Study, the European Male Aging Study (EMAS) and the Study of Osteoporotic Fractures in Men (MrOS). Means and standard deviations are shown. To convert total testosterone from ng/dL to nmol/L, multiply concentrations in ng/dL with 0.0347. To convert free testosterone from pg/mL to pmol/L, multiply concentrations in pg/mL with 3.47. Reproduced with permission from Bhasin et al, J Clin Endocrinol Metab. 2011 Aug;96(8):2430-9.