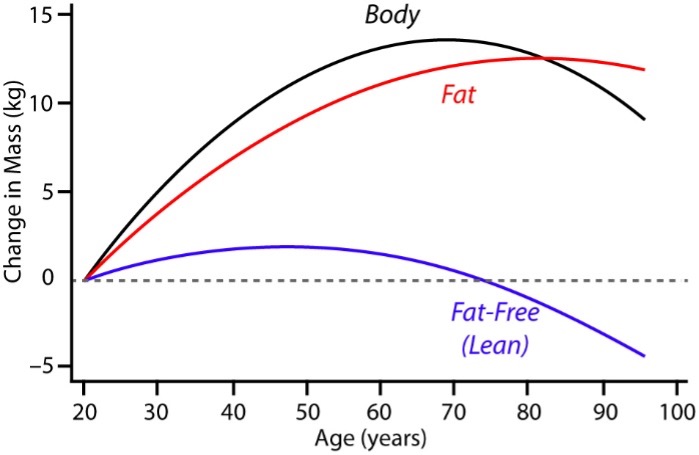
Figure 3. A schematic diagram of the age-related changes in body composition in 7265 men. Lines represent the longitudinal changes in body weight (black line), fat mass (red line) and fat-free. mass (blue line) components from age 20 years. The estimated mass values at age 20 years were as follows: body mass, 72.72 kg; fat mass, 9.14 kg; fat-free mass, 64.09 kg. Figure adapted with permission from Jackson et al. Br J Nutr. 2012;107(7):1085-91.