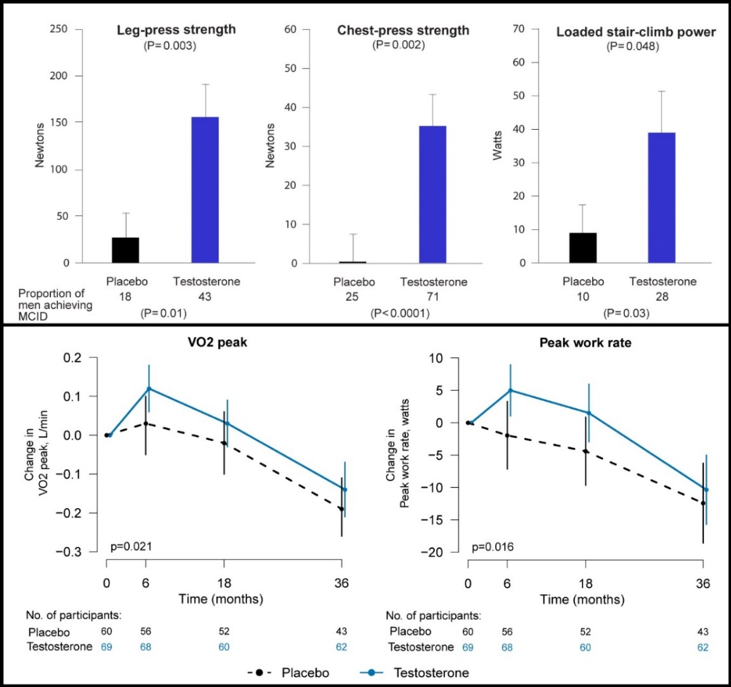
Figure 6. Effects of testosterone administration on measures of muscle performance and physical function in randomized testosterone trials in older men. Panel A shows the mean (SD) change from baseline to maximal voluntary strength in the leg press and chest press exercises and on loaded stair climbing power at either the end of the intervention period or at the last measurement performed in who dropped out before study completion in the testosterone in older men with mobility limitation (The TOM Trial). The minimal clinically important difference (MCID) for each outcome was determined using an anchor-based method within the trial. The proportion of men (percent) whose change from baseline either equaled or exceeded the MCID is shown below the figure along with the P-value for the comparison of placebo and testosterone groups (figure adapted with permission from Spitzer et al. Nat Rev Endocrinol. 2013;9(7):414-24). Panel B shows the long-term effects of testosterone administration on aerobic capacity in older men participating in the TEAAM trial. Data points represent mean changes from baseline and error bars are 95% CI in VO2peak (L/min) and in peak work rate. P values indicate the overall effect of the testosterone intervention over time (figure reproduced with permission from Traustadóttir et al, J Clin Endocrinol Metab. 2018;103(8):2861-2869).