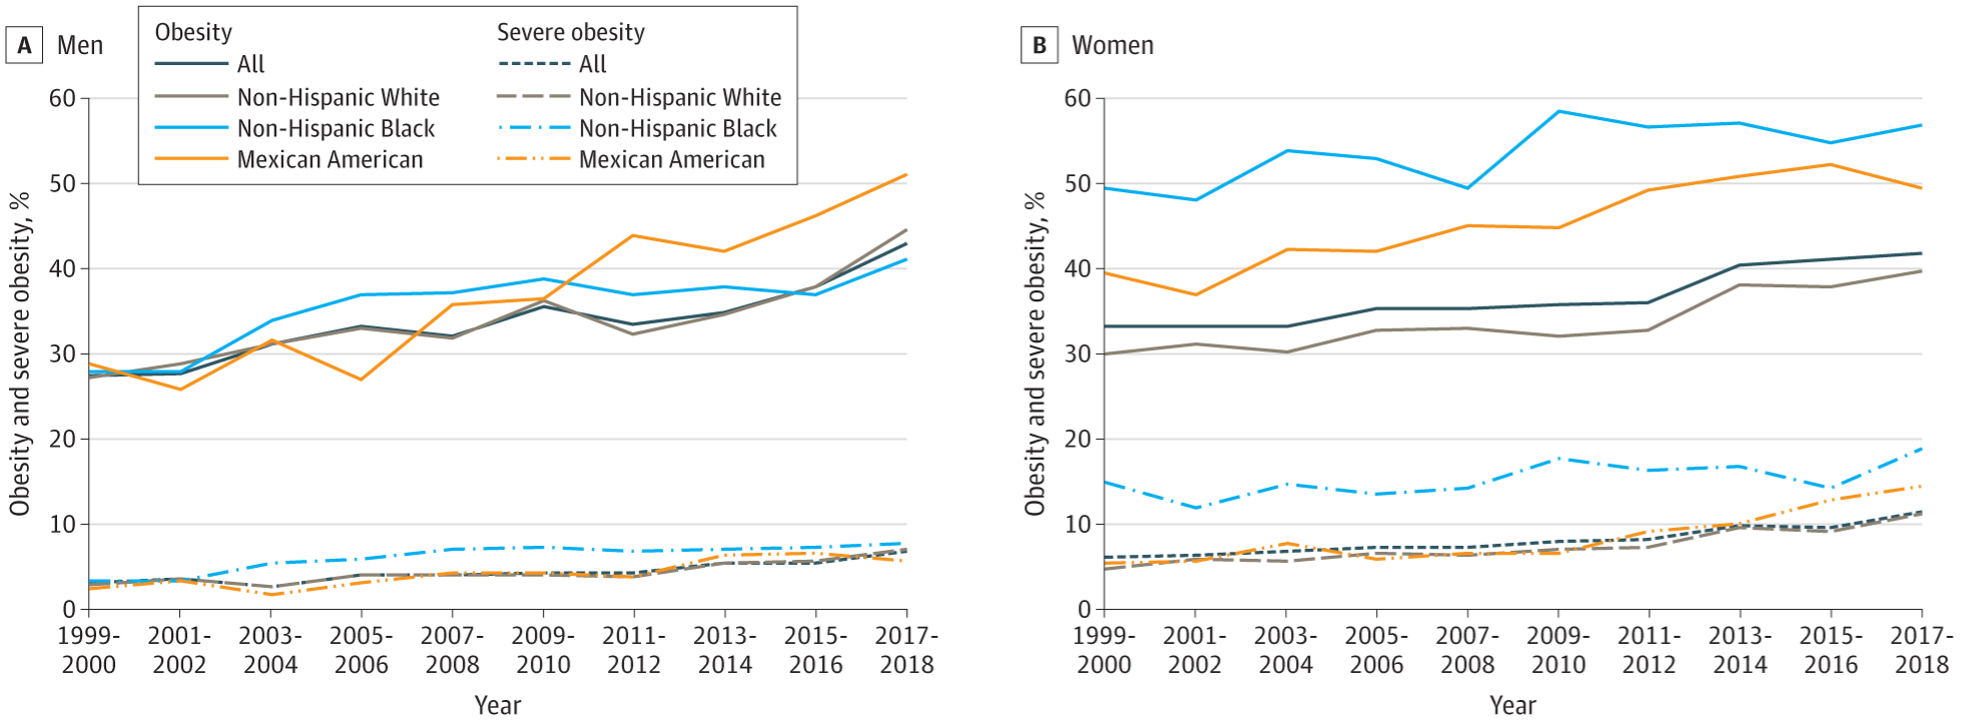
Figure 2. Age-Adjusted Prevalence of Obesity and Severe Obesity in US Adults. National Health and Nutrition Examination Survey data, prevalence estimates are weighted and age-adjusted to the projected 2000 Census population using age groups 20-39, 40-59, and 60 or older. Significant linear trends (P < .001) for all groups except for obesity among non-Hispanic Black men, which increased from 1999-2000 to 2005-2006 and then leveled after 2005-2006. Data taken from reference (31).