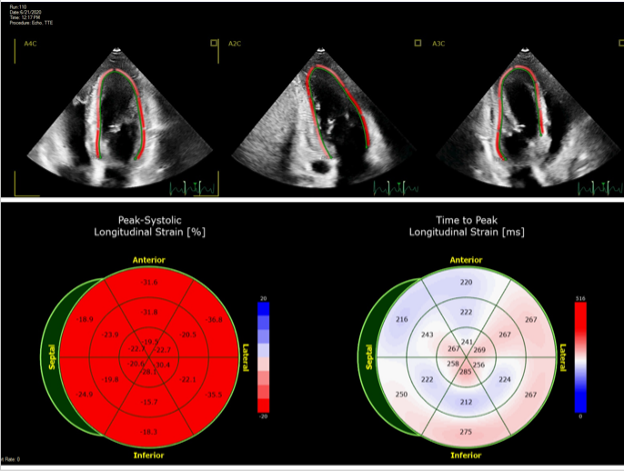
Figure 4. Global longitudinal strain by speckle tracking echocardiography. Assessment of global longitudinal strain (GLS) in a healthy, asymptomatic individual with a GLS of -25%. The top row displays a regional strain map superimposed on the grayscale two-dimensional echocardiographic images in apical four-chamber (A4C), apical two-chamber (A2C), and apical three-chamber (A3C) views. The bottom left bullseye displays regional longitudinal strain for each segment of a 16-segment left ventricle model. Bright red denotes the most negative normal values of GLS. The bottom right bullseye shows the time (ms) between aortic valve opening and peak longitudinal strain, a measure of desynchrony, for each segment.