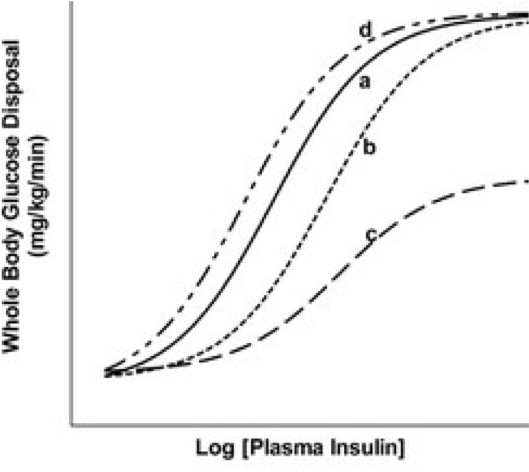
Figure 1. Schematic representation of concentration-response relationships between plasma insulin concentrations and insulin-mediated whole-body glucose disposal. Curve a: normal insulin sensitivity and responsiveness. Curve b: rightward shift in insulin concentration-response curve. This represents decreased insulin sensitivity (increased EC50) with normal insulin responsiveness. Curve c: Decreased insulin sensitivity (increased EC50) and reduced insulin responsiveness. Curve d: Leftward shift in the insulin concentration-response response curve. This represents increased insulin sensitivity (decreased EC50) with normal insulin responsiveness.