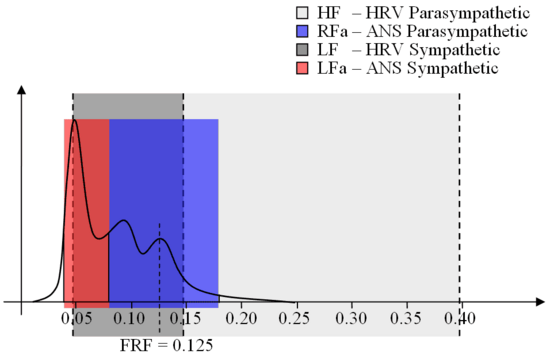
Figure 16. This is a sample power spectrum of the HRV signal from a subject breathing at an average rate of 7.5 breaths per minute (Fundamental Respiratory Frequency, FRF = 0.125 Hz). The method using HRV alone defines two fixed spectral regions for the low-frequency (LF) and high-frequency (HF) measure (dark gray and light gray, respectively). It is clear that the high-frequency (light gray) region includes very little area under the HRV spectral curve, suggesting very little parasympathetic activity. The great majority of the HRV spectral activity is under the low-frequency (dark gray) region suggesting primarily sympathetic activity. These representations are incorrect because the slow-breathing subject should have a large parasympathetic component reflective of the vagal activity. This parasympathetic component is represented correctly by the method using both HRV and respiratory activity which defines the red and blue regions of the spectrum in the graph. The blue region defined by the FRF represents purely parasympathetic activity whereas the remainder of the lower frequency regions (red region) represents purely sympathetic activity.