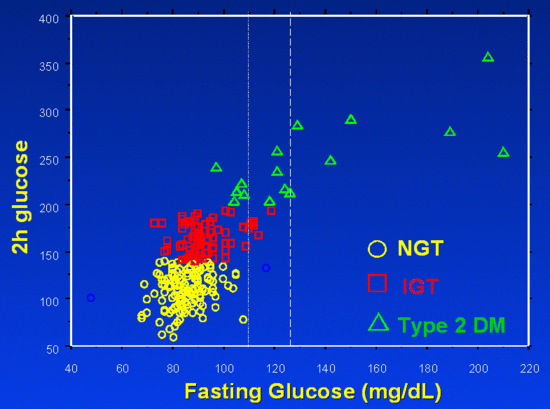
Figure 7: Distribution of glucose tolerance (NGT= normal glucose tolerance or 2h glucose < 140 mg/dL, IGT = impaired glucose tolerance or 2h glucose 140-199 mg/dL, Type 2 DM = 2h glucose ≥ 200 mg/dL) by fasting glucose level in a large cohort (N = 254) women with PCOS. The vertical lines at 110 mg/dL and 126 mg/dL on the fasting glucose x axis indicate the thresholds for impaired fasting glucose and type 2 diabetes by fasting levels (62).