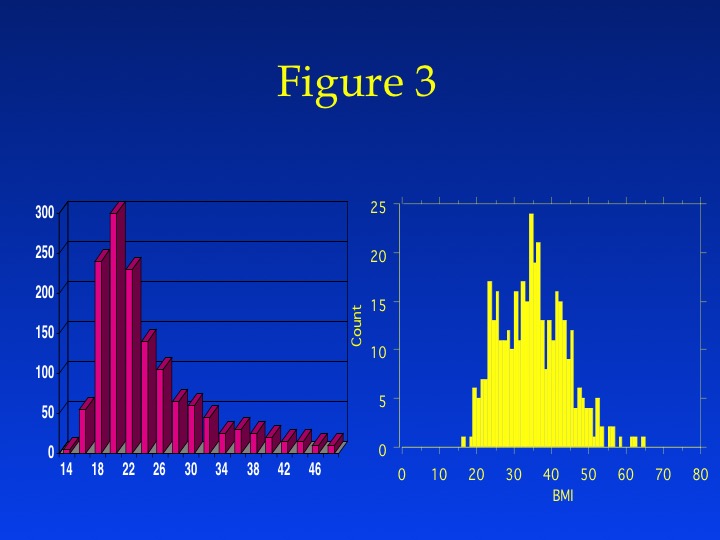
Figure 3: Distribution (counts on y axis) of BMI in women with PCOS from a large cohort of women diagnosed with PCOS in the United Kingdom ( N = 1741)(21) compared to that from a cohort in the United States ( N = 398) (Legro, unpublished data). Compare a mode of BMI of 20 for the UK women with a BMI of 35 for the U.S. women.