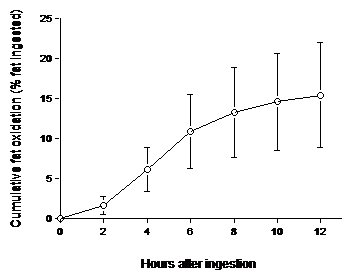
Figure 2: Cumulative oxidation (mean ± sd) of dietary fat as a percentage of intake, over time after ingestion, as calculated from tracer recovery in urine produced at two-hour intervals (After reference 4).
Figure 2: Cumulative oxidation (mean ± sd) of dietary fat as a percentage of intake, over time after ingestion, as calculated from tracer recovery in urine produced at two-hour intervals (After reference 4).