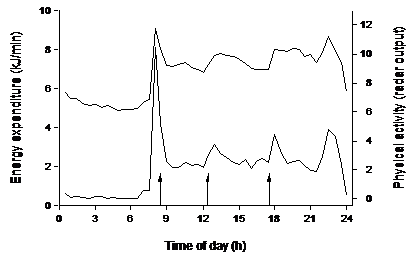
Figure 4: Energy expenditure (upper line) and physical activity (lower line) as measured over a 24-h interval in a respiration chamber. Arrows denote meal times. Data are the average of 37 subjects, 17 women and 20 men, age 20-35 y and body mass index 20-30 kg/m2.
Figure 4: Energy expenditure (upper line) and physical activity (lower line) as measured over a 24-h interval in a respiration chamber. Arrows denote meal times. Data are the average of 37 subjects, 17 women and 20 men, age 20-35 y and body mass index 20-30 kg/m2.