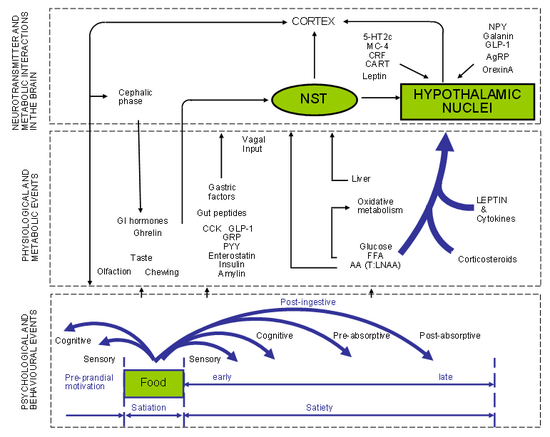
Figure 1. Diagram showing the expression of appetite as the relationship between three levels of operations: the behavioral pattern, peripheral physiology and metabolism, and brain activity. PVN – paraventricular nucleus; NST – nucleus of the tractus solitarius; CCK – cholecystokinin; FFA – free fatty acids; T: LNAA, tryptophan: large neutral amino acids. (See Blundell, 1991 for detailed diagram.)