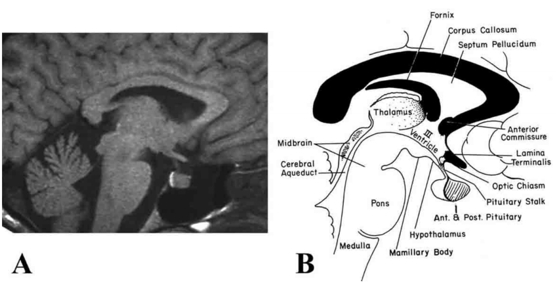
Figure 6. (A) Magnetic resonance image (MRI) and (B) corresponding schematic illustration of the human hypothalamus (H) and pituitary gland seen in sagittal orientation. Note the high intensity or “bright spot” of the posterior pituitary by MRI in (A), sharply defining the boundary between the anterior pituitary gland. III = third ventricle (Modified from Lechan RM. Neuroendocrinology of Pituitary Hormone Regulation. Endocrinology and Metabolism Clinics 16:475-501, 1987.)