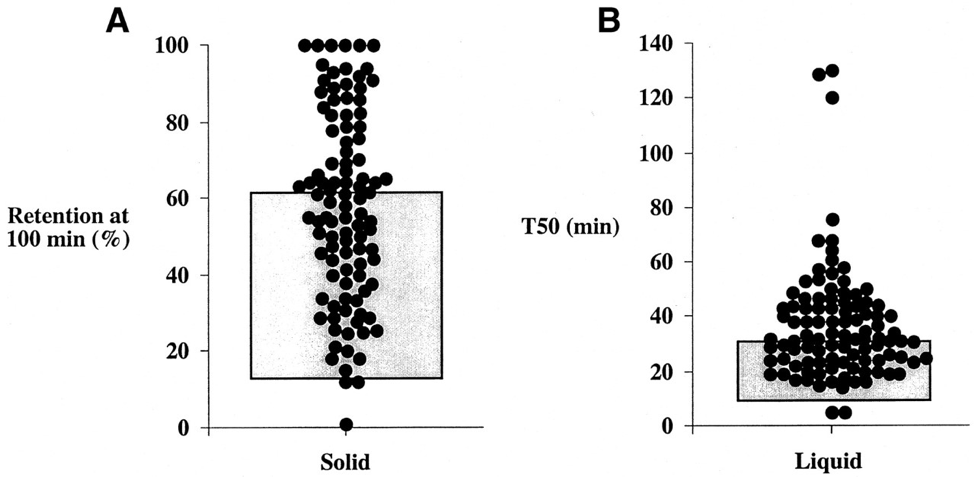
Figure 2. Gastric emptying of solids (minced beef) (A), shown as the retention at 100 min (percent); and the gastric emptying of liquids (10% dextrose) (B), shown as the 50% emptying time (minutes) in 101 outpatients with diabetes. The normal range is indicated by the shaded area. Reproduced with permission from Jones et al (37).