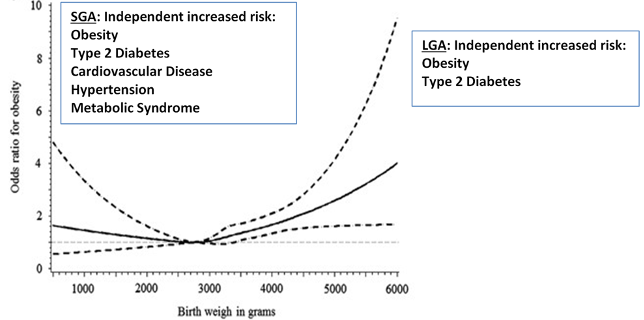
Figure 5. U-shaped curve of odds risk for obesity at age 9-11 years based on birth weight. Curve is corrected for gestational diabets, gestional age, childs age, breast or formula feeding, highest level of parental education, sleep time, moderately vigorous physical acitivvity time (MVPA), sendentary time and healthy/unhealthy diet scores (288) weight Dashed lines identify 95% confidence intervals. Inserted text boxes indicate independent effects of small for gestational age (SGA) and large for gestational age (LGA) on various health parameters in adults.