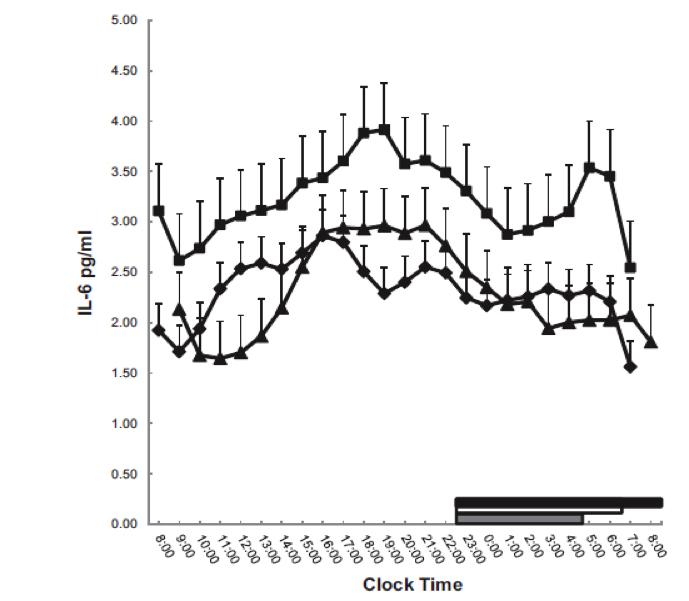
Figure 8. Serial 24-h IL-6 values at baseline (♦), restriction (■), and recovery
(▲). Thick white, gray, and black lines on the abscissa indicate the nighttime sleep recording period
at baseline, restriction, and recovery, respectively.
Figure 8. Serial 24-h IL-6 values at baseline (♦), restriction (■), and recovery
(▲). Thick white, gray, and black lines on the abscissa indicate the nighttime sleep recording period
at baseline, restriction, and recovery, respectively.