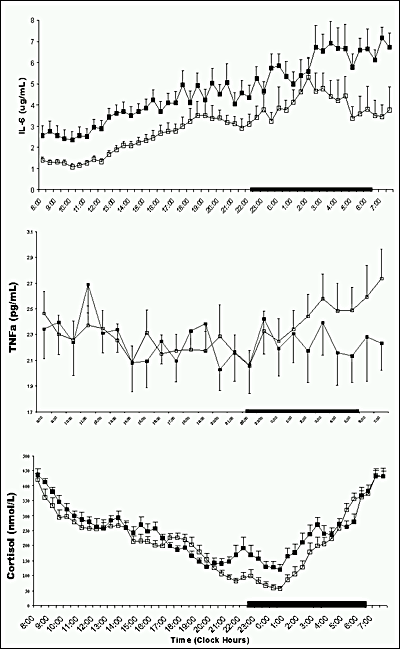
Figure 8. Twenty-four-hour plasma concentrations of IL-6 (top), TNF (middle), and cortisol (bottom) in healthy young ( ) and old ( ) individuals. Each data point represents the mean + SE. The darkened area indicates the sleep recording period.
Figure 8. Twenty-four-hour plasma concentrations of IL-6 (top), TNF (middle), and cortisol (bottom) in healthy young ( ) and old ( ) individuals. Each data point represents the mean + SE. The darkened area indicates the sleep recording period.