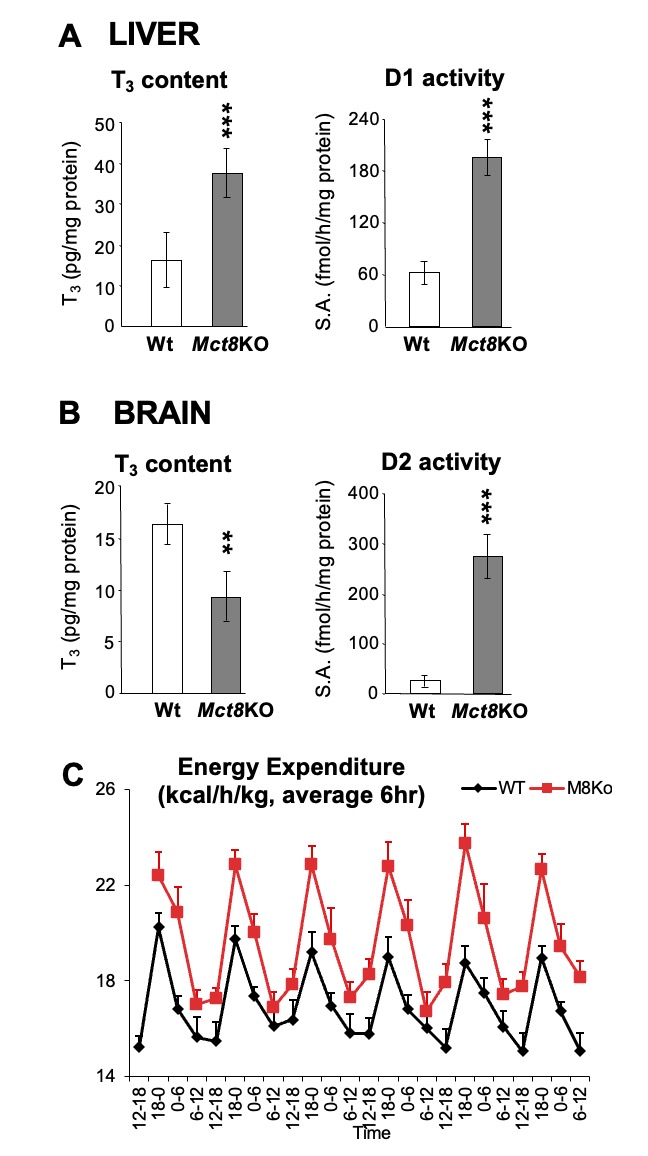
Figure 12. Data from Mct8KO vs Wt mice. A. T3 content and D1 enzymatic activity in liver. B. T3 content and D2 enzymatic activity in brain. Data from Mct8KO mice are represented as grey bars and those from Wt littermates are in open bars. ** p-value <0.01, *** p-value <0.001. C. Total energy expenditure (TEE) flow chart represented as 6h average over 6 days, Mct8KO mice are shown in red.