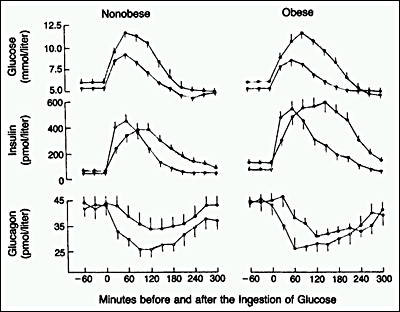
Figure 14.Mean (±SE) arterial plasma glucose, insulin, and glucagon concentrations before and after glucose ingestion in 16 normal subjects (o) and 15 subjects with impaired glucose tolerance (*). (Copyright 1992 by the Massachusetts Medical Society. Republished with permission of Massachusetts Medical Society from Mitrakou et al. Role of reduced suppression of glucose production and diminished early insulin release in impaired glucose tolerance. N Engl J Med 326:22-29, 1992.)