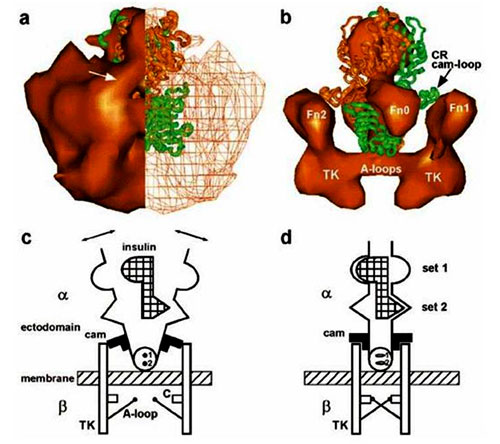
Figure 1. Insulin/insulin receptor complex. (a) End view of the full-mass representation of the IR dimer: left half, surface rendering; right half, wire mesh representation. Fitted structure of two IR-adapted LCL regions (green and orange-brown) showing correspondence of surface features and extent in uppermost regions (L1). Arrow: cam-like region on the CR domain. (b) Higher density solid surface representation of the view rotated slightly from panel a to show CR loop regions (cams) of atomic structure reaching the top portion of Fn2 domains of the 3D reconstruction. (c and d) Simplified schematic of structural changes during activation of the insulin receptor. (c) Inhibitory state: ectodomain of dimeric subunits each with two differing insulin binding sites and a blocking cam. Unbound bivalent insulin: subunits resting against cams, crossing membrane, with tyrosine kinase (TK) domains separated. Abbreviations: A-loop, activation loop; C, catalytic region. Small on-axis circles (1 and 2) represent the two – disulfide bonds. Arrows indicate thermally induced motion. (d) Insulin bound state: blocking cams rotated and subunits resting closer to the center of the ectodomain. TK domains are in position for transphosphorylation via A-loops. Sets 1 and 2 indicate schematically different sets of amino acids from monomers I and II interacting with corresponding different sites on insulin. Reprinted with permission from “Mechanism of Transmembrane Signaling: Insulin Binding and the Insulin Receptorâ€. By Ottensmeyer, et al., Biochemistry, Vol 39, No. 40, p.12103-12112. (2000). Copyright (2000) American Chemical Society