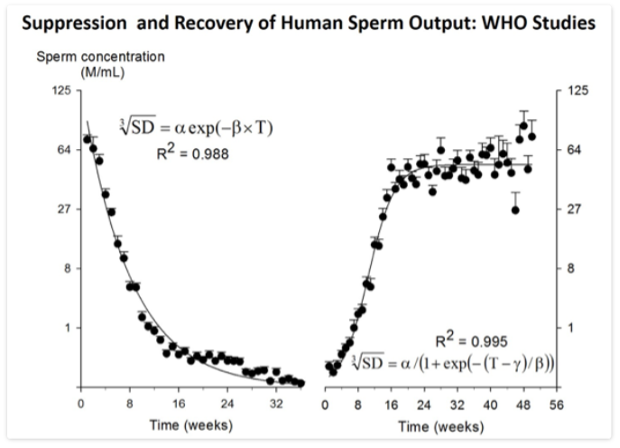
Figure 2. Plot of suppression (left panel) and recovery (right panel) of sperm output from the WHO Studies 85921 (15) and 89903 (14) involved pooling ~14,000 semen samples from 16 centers in 10 countries (282). Data-points represent mean and SE (error bar) of semen samples grouped within weeks with between six and 383 samples per time-point. Note cube-root scale on y-axis. For suppression, the smooth line is the two-parameter, single term exponential decay function plotted to fit the data by non-linear regression. For recovery, the smooth line is the three-parameter sigmoidal curve plotted to fit the data by non-linear regression.