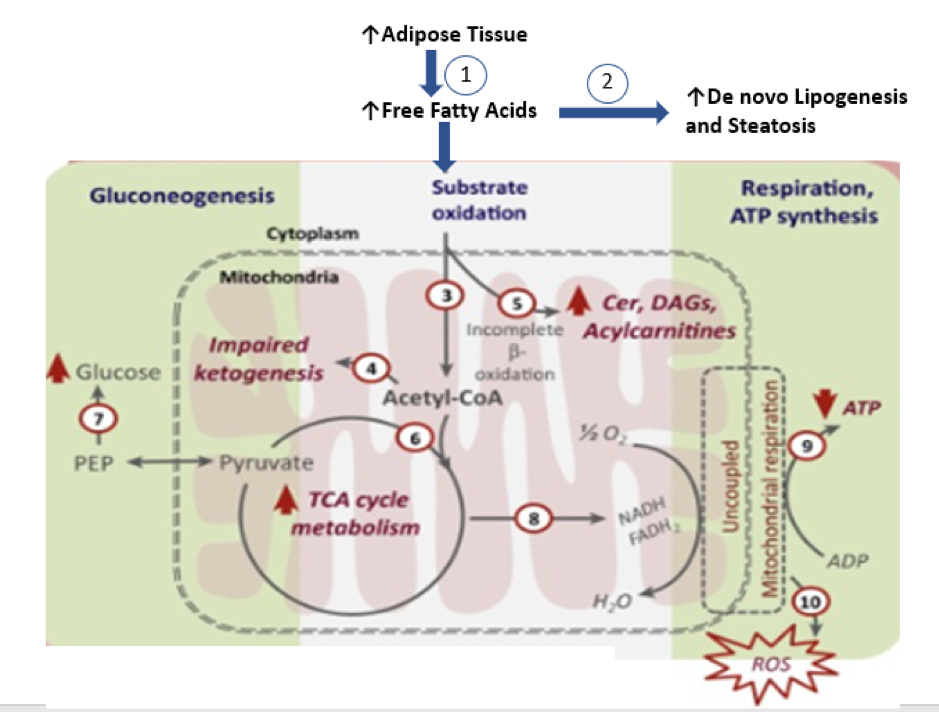
Figure 2. Hepatic Mitochondrial Oxidative Dysfunction during NASH (71). Adipose tissue insulin resistance results in increased lipolysis and higher flux of FFAs into the liver (1), resulting in high rates of hepatic triglyceride accretion (2). Initial breakdown of FFA in the liver proceeds through b-oxidation, generating two-carbon units of acetyl-CoA (3). During hepatic insulin resistance, disposal of acetylCoA units through ketogenesis undergoes an early compensatory induction in simple steatosis, but is impaired in NASH (4). In spite of FFA overload, hepatic insulin resistance and steatosis result in beta-oxidation being inefficient and incomplete as evident from accumulating levels of hepatic ceramides, DAGs, and long-chain acylcarnitine (5). However, complete oxidation of acetyl-CoA units through the mitochondrial TCA cycle continues unabated during simple steatosis and NASH (6), potentially to meet the energetic demands of maintaining high rates of gluconeogenesis (7). The chronically elevated oxidative flux through TCA cycle during NASH has the potential to uncouple hepatic TCA cycle activity from mitochondrial respiration (8) by disrupting the mitochondrial electrochemical gradient and to impair ATP synthesis (9). This mitochondrial milieu could be a chronic source of ROS generation (10) and cellular inflammation, and could be a target for therapeutic manipulations. Abbreviations: Cer, ceramides; CoA, coenzyme A; DAGs, diacylglycerols; FFAs, free fatty acid; NASH, nonalcoholicsteatohepatitis; PEP, phosphoenolpyruvate; ROS, reactive oxygen species; TCA, tricarboxylic acid.