The best Clinical Endocrinology source in the world, and FREE.

Endotext requires free registration
Login or Register

Menu

Skip to content
  • Home / Sections
  • Clinical Guidelines
  • Webinar Case Studies
  • Editorial Team
  • Country Associates
  • About
  • Instructions for Authors

etx-pit-ch5-fig10

Published November 7, 2020 at 452 × 454 in Normal Physiology of ACTH and GH Release in the Hypothalamus and Anterior Pituitary in Man.
← Previous Next →

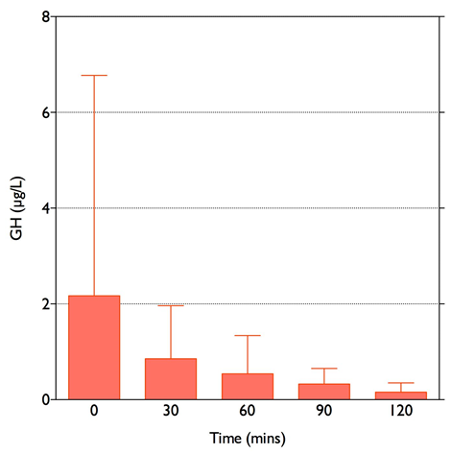
Figure 10. GH response to 75g oral glucose in 8 non-acromegalic, non-diabetic women, given at time 0. Error bars denote SD. Note the high variability of the baseline GH level due to the pulsatile nature of GH secretion. GH levels fall to <0.4 µg/L at 120 minutes.

  • Agreement on Use
  • Supporters
  • Donations
  • Privacy Policy
  • Instructions for Authors (5/03/23)

Copyright © 2000-2025, MDText.com, Inc. All rights reserved.