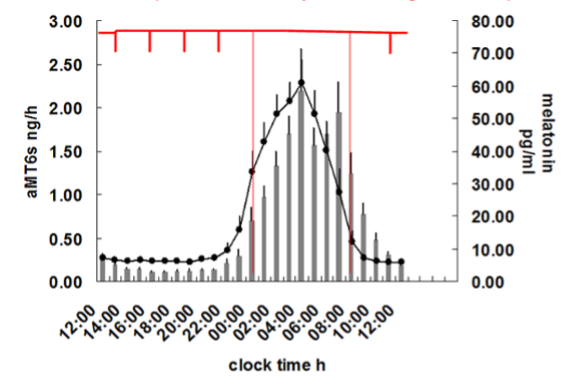
Figure 4. Plasma melatonin and urinary aMT6s in hourly samples to show the delay in the rhythm of urinary aMT6s compared to plasma melatonin (mean/SEM, N=14). Red lines show typical urine sample collection times over 24-48h to determine timing of the rhythm in out-patient or field studies. Redrawn from R. Naidoo, Thesis, University of Surrey, UK, 1998.