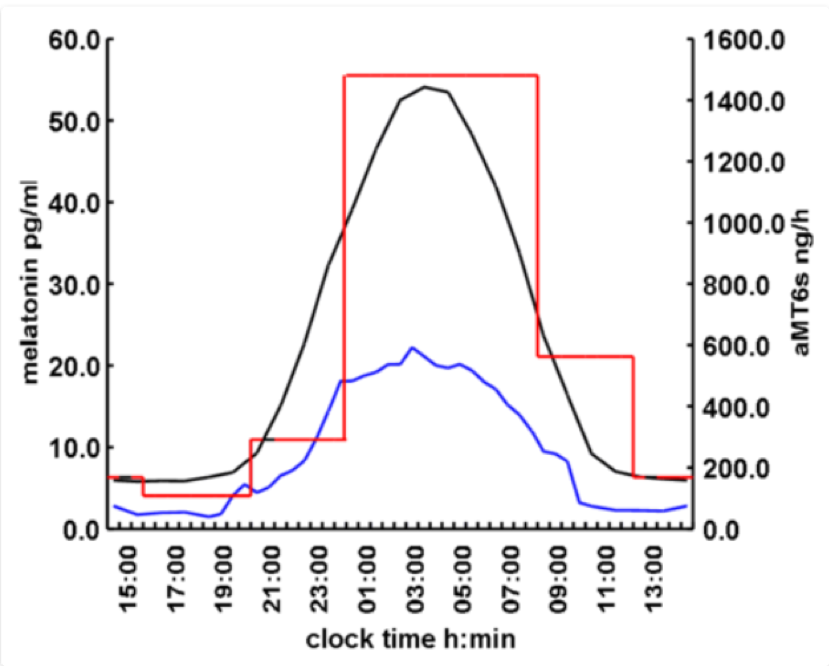
Figure 3. Average concentrations of melatonin in plasma (black, N=133), saliva (blue, N=28) and 6-sulphatoxymelatonin (aMT6s) in urine (red, N=88) using radioimmunoassay measurements. Diagrammatic representation of mean normal values (healthy men and women over 18 years old) from Dr. Arendt’s laboratory.