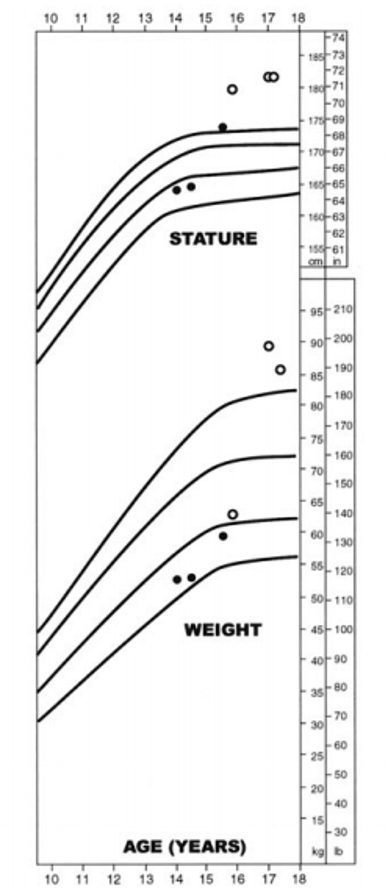
Figure 14. The patient’s growth and weight chart with normal growth and weight curves (solid lines, 5th, 50th, 75th, and 95th percentile). Measurements subsequent to therapeutic intervention. Reproduced from (165), with permission.
Figure 14. The patient’s growth and weight chart with normal growth and weight curves (solid lines, 5th, 50th, 75th, and 95th percentile). Measurements subsequent to therapeutic intervention. Reproduced from (165), with permission.