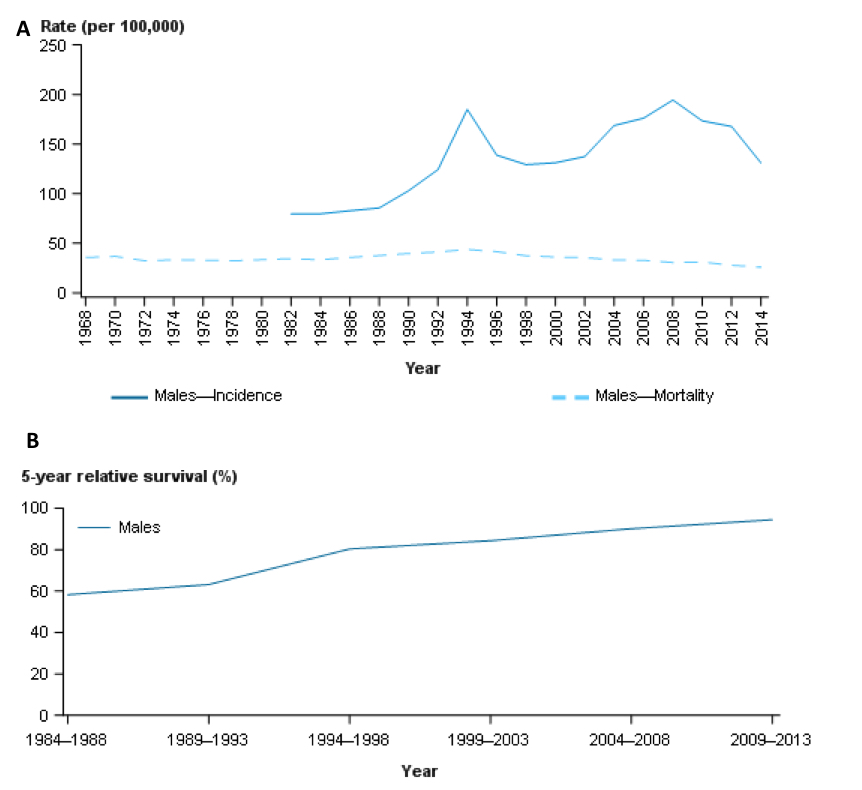
Figure 3: Panel A – Incidence (solid line) during 1982 – 2014 in Australia demonstrating a rise after widespread availability of PSA testing with a dip after the prostate cancer backlog was addressed: mortality (dashed line) has been falling slowly since the mid-1990s. Panel B – 5-year relative survival from prostate cancer, 1984–1988 to 2009–2013 in Australia demonstrated a reciprocal improvement since the mid-1990s https://prostate-cancer.canceraustralia.gov.au/statistics