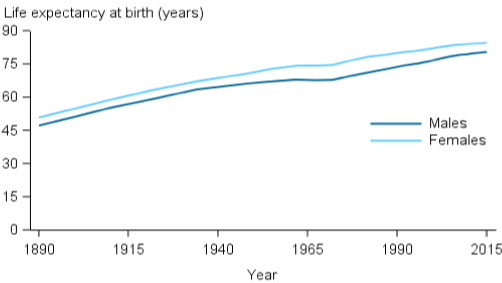
Figure 6: Panel A – life expectancy estimates for Australian men and women since 1890. Panel B – Population pyramid for Australia in 2016, demonstrating the proportion of population for each age group. Available from: https://www.aihw.gov.au/reports/life-expectancy-death/deaths-in-australia/contents/life-expectancy