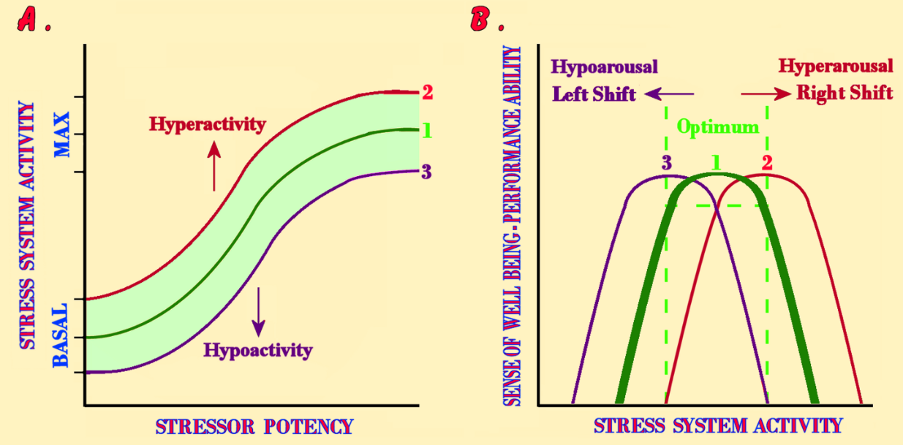
Figure 12. A. The dose-response curve between the potency of an imposed stressor and the activity of the stress system components responding to this specific stressor. Curve 1 (green): the normal dose-response curve; Curve 2 (red): the dose-response curve which defines the upper physiologic level of stress system activity; Curve 3 (purple): the dose-response curve which defines the lower physiologic level of stress system activity. Any curve higher than Curve 2 represents stress system hyperactivity, while any curve lower than Curve 3 represents stress system hypoactivity. B. The inverted U-shaped dose-response curve between the sense of well-being or performance ability and the stress system activity. Curve 1 (green): optimal stress system activity curve; Curve 2 (red): excessive stress system activity curve; Curve 3 (purple): defective stress system activity curve. Curves 2 and 3 curtail the top of the optimal curve and represent shifts to the right (hyperarousal/anxiety) and to the left (hypoarousal), respectively, whilst both are associated with suboptimal sense of well-being or diminished performance. [Adapted from Chrousos G.P. and Gold P.W., JAMA, 1992, 267,1244].