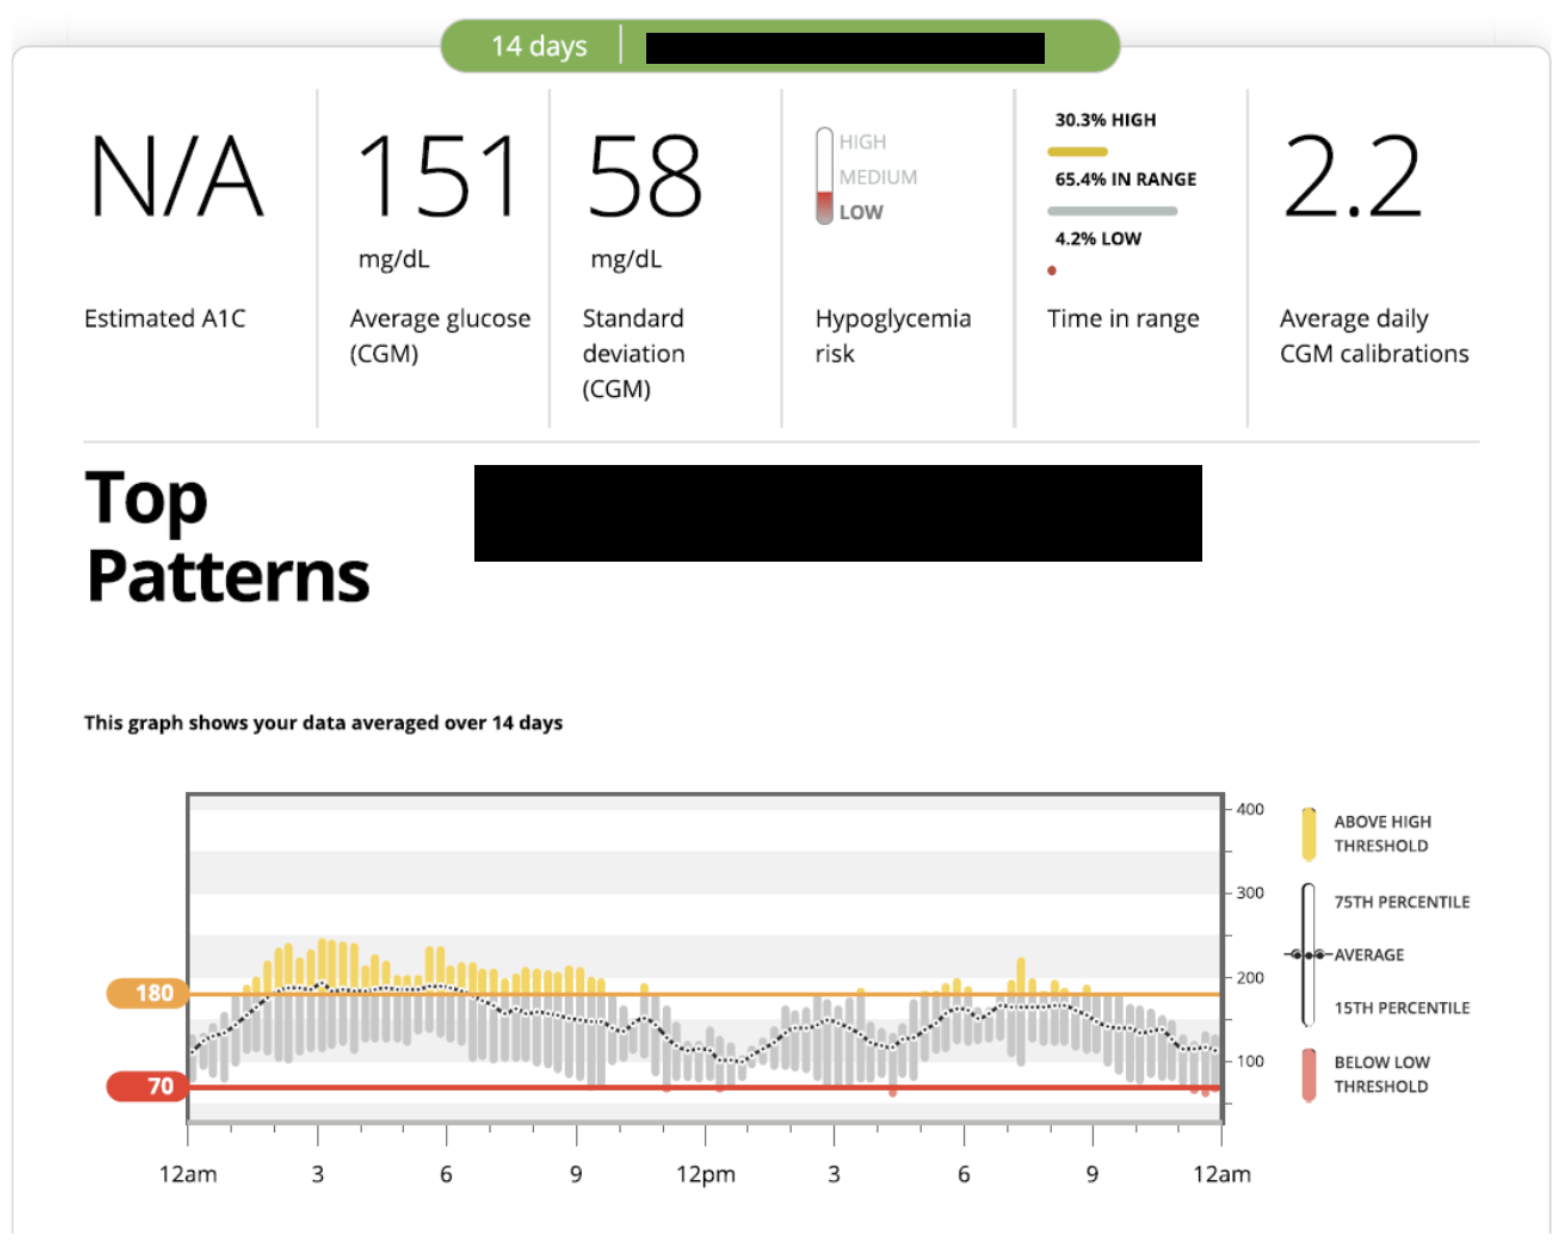
Figure 6. A 14 day DEXCOM CGM overview report showing glucose data over a 24 hour period including mean (dotted line), standard deviation, interquartile range (grey bars), upper and lower thresholds (orange and red lines, set by the user), hypoglycemia risk (high, medium or low), percent time in range and average daily calibrations.