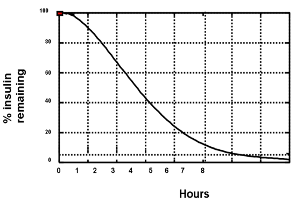
Figure 13. The appearance of insulin into the blood stream (pharmacokinetics) is different than the measurement of insulin action (pharmacodynamics). This figure is a representation of timing of insulin action for insulin aspart from euglycemic clamp data (0.2 U/kg into the abdomen). Using this graph assists patients to avoid “insulin stacking”. For example, 3 hours after administration of 10 units of insulin aspart, one can estimate that there is still 40% X 10 units, or 4 units of insulin remaining. By way of comparison, the pharmacodynamics of regular insulin is approximately twice that of insulin aspart or insulin lispro. Currently used insulin pumps keep track of this “insulin-on-board” to avoid insulin stacking. Adapted from reference (40).