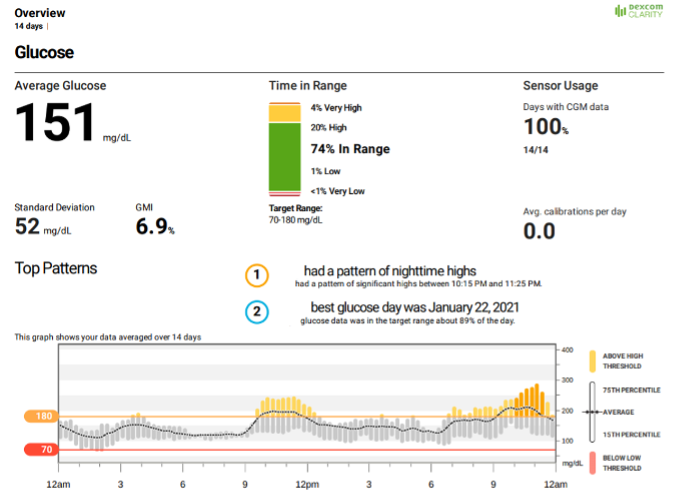
Figure 7. A 14-day DEXCOM CGM overview report showing sensor glucose data over a 24-hour period including mean (dotted line), standard deviation, glucose management indicator, interquartile range (grey bars), upper and lower glucose thresholds (orange and red lines, set by the user), percent time in range, sensor usage, top patterns, and average daily calibrations.