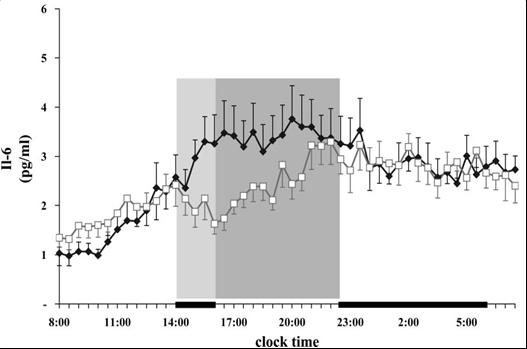
Figure 7 . Twenty-four-hour IL-6 values pre-( ♦ ) and post-(□) sleep deprivation in the no-nap goup (top) and the nap group (bottom). Thick black lines on the abscissa indicate nighttime and nap recording periods. Significant reduction of IL-6 during the nap period (1400-1600),P<0.05