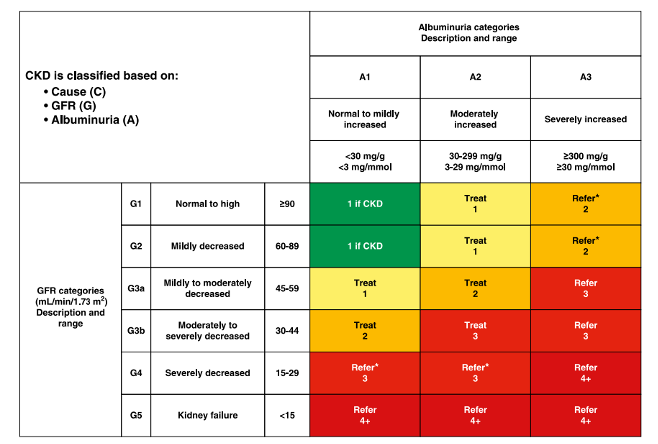
Figure 2. Risk of progression by intensity of coloring (green, yellow, orange, red, deep red). The numbers in the boxes are a guide to the frequency of monitoring (number of times per year). These are general parameters only based on expert opinion and must take into account underlying comorbid conditions and disease state, as well as the likelihood of impacting a change in management for any individual patient. CKD, chronic kidney disease; GFR, glomerular filtration rate. Source: Reprinted by permission from American Diabetes (252).