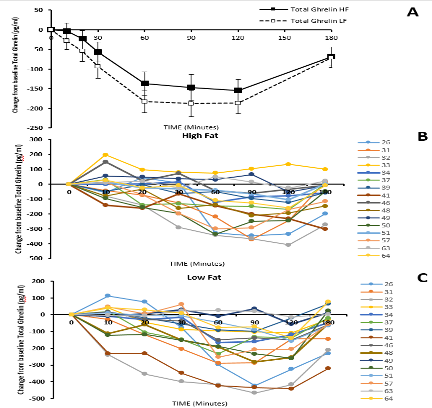
Figure 2. Panel A shows the average ghrelin suppression after high fat and low-fat meals and Panel B and C shows the individual profiles of ghrelin for each participant after both high and low-fat meals. Adapted from (63).
Figure 2. Panel A shows the average ghrelin suppression after high fat and low-fat meals and Panel B and C shows the individual profiles of ghrelin for each participant after both high and low-fat meals. Adapted from (63).