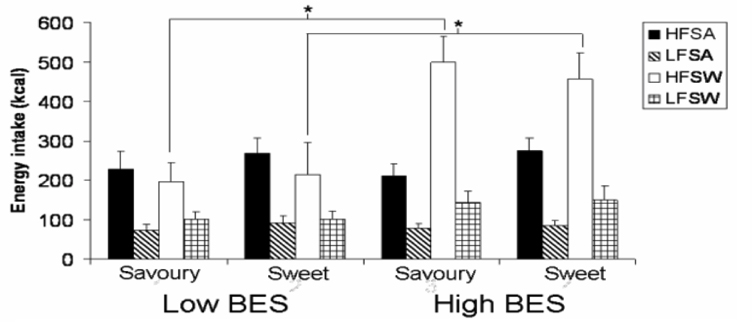
Figure 6: Mean energy intake according to fattiness and taste properties of test mean foods after savoury and sweet preload for high and low BES groups. * P < 0.05
Figure 6: Mean energy intake according to fattiness and taste properties of test mean foods after savoury and sweet preload for high and low BES groups. * P < 0.05