etx-dm-ch3-fig10

Figure 10. The canonical insulin receptor signal transduction network. The two major canonical insulin receptor signaling cascades (PI3K and ERK) are shown. The critical nodes (IR/IRS, PI3K, AKT) are boxed. Crosstalk from IGF-I receptor, cytokine receptors and TNFα is indicated. Negative regulation by PTP1B and PTEN is shown. See text and reference 83 for detailed explanation. From reference 82, used with permission.

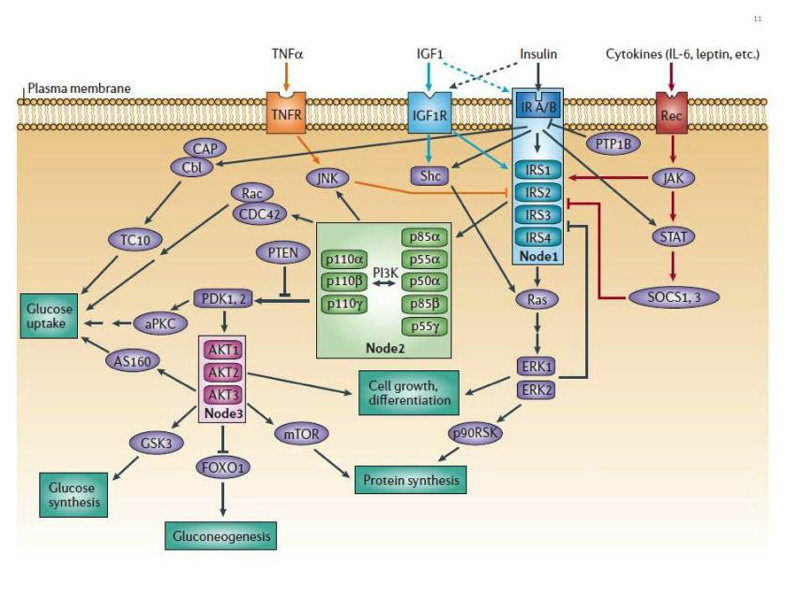
Figure 10. The canonical insulin receptor signal transduction network. The two major canonical insulin receptor signaling cascades (PI3K and ERK) are shown. The critical nodes (IR/IRS, PI3K, AKT) are boxed. Crosstalk from IGF-I receptor, cytokine receptors and TNFα is indicated. Negative regulation by PTP1B and PTEN is shown. See text and reference 83 for detailed explanation. From reference 82, used with permission.

Figure 10. The canonical insulin receptor signal transduction network. The two major canonical insulin receptor signaling cascades (PI3K and ERK) are shown. The critical nodes (IR/IRS, PI3K, AKT) are boxed. Crosstalk from IGF-I receptor, cytokine receptors and TNFα is indicated. Negative regulation by PTP1B and PTEN is shown. See text and reference 83 for detailed explanation. From reference 82, used with permission.